|
Table of Contents |
||
|
1. Introduction 2. Sea Surface Temperature (SST) 3. Climatology 4. Sea Surface Temperature Anomaly (SSTA) 5. Coral Bleaching HotSpot 6. Degree Heating Week (DHW) 7. Bleaching Alert Area 8. SST Trend 9. Composites and Animations 10. Regional Virtual Stations 11. Satellite Bleaching Alert (SBA) Email System 12. Accessing 5km Product Data 13. Tutorial 14. References |
||
SUMMARY: Coral reef ecosystems worldwide are threatened by an increasing array of impacts, primarily from global climate change, unsustainable fishing practices, and land-based pollution. Mass coral bleaching has become one of the most visible and damaging marine ecological impacts of persistently rising ocean temperatures driven by climate change. Satellites provide synoptic views of the global oceans in near real-time and monitor coral reef environmental conditions worldwide. Using these data, NOAA Coral Reef Watch (CRW) has developed a suite of next-generation operational daily global 5km satellite coral bleaching heat stress monitoring products that pinpoint areas around the world where corals are at risk for mass bleaching.
Corals are marine invertebrates that create reef structures. Coral reefs are presently Earth's largest biological structures and have taken thousands of years to form. Researchers estimate that coral reefs support more than 25% of all known marine life, making coral reefs one of the most biodiverse and valuable ecosystems on Earth. Corals provide significant economic and social benefits for fisheries, tourism, shoreline protection, and medical research innovation. Based on these values, coral reefs are estimated to provide over $9.8 trillion/year in ecosystem services (Costanza et al., 2014).
Coral reef ecosystems worldwide have been declining at alarming rates. They are threatened by an increasing array of impacts, primarily from global climate change, unsustainable fishing practices, and land-based pollution. Coral bleaching is one of the most significant contributors to this increased deterioration (Wilkinson, 2008). Coral bleaching occurs when the symbiotic relationship between a host coral and the algae (zooxanthellae) living within its tissues breaks down under certain environmental stresses. Corals and zooxanthellae have a mutualistic relationship. The coral provides the algae with a protected environment and compounds they need for photosynthesis. In return, the algae produce oxygen and help the coral to remove wastes. Most importantly, zooxanthellae supply the coral with glucose, glycerol, and amino acids (the products of photosynthesis). The coral uses these products to make proteins, fats, and carbohydrates, and to produce calcium carbonate. (Click here to learn more.) This is why the deterioration of the coral-zooxanthellae symbiosis under environmental stress is so detrimental to the coral - because without its zooxanthellae, the coral begins to starve. In addition, its white calcium carbonate skeleton is exposed, and the affected coral colony becomes stark white or pale in color. This is known as "bleaching".
Coral bleaching can be triggered and sustained under various environmental stresses. Increases in warming ocean temperatures stress tropical corals; the hotter water temperatures become, the more stress corals experience. In fact, ambient water temperatures as little as 1 to 2 °C above a coral's tolerance level, indicated by summer monthly mean temperatures, can cause coral bleaching (Berkelmans and Willis, 1999; Reaser et al., 2000). When a coral bleaches, it is not dead; however, it is more susceptible to damage from other stressors, including disease outbreaks. Often, corals that are partially to totally bleached for long periods of time eventually die, causing dramatic long-term ecological and socio-economic impacts, including loss of reef-building corals, and changes in benthic habitat and in fish populations on the reef. Even under favorable conditions, it can take decades for severely bleached reefs to fully recover (Wilkinson, 2008).
First observed in the early 1980s (Glynn, 1990; Coffroth et al., 1990), mass coral bleaching has become one of the most visible and damaging marine ecological impacts of persistently rising ocean temperatures. The high ocean temperatures are primarily driven by accelerating global climate change. Mass coral bleaching events have become more frequent and intense over the last 40 years (Eakin et al., 2018). As manifested by the devastating 2014-2017 global coral bleaching event, now considered the longest, most widespread and most damaging coral bleaching event on record (Eakin et al. 2018), mass bleaching events around the globe are now often lasting longer (many months); are becoming an annual event; and are impacting coral reefs that never bleached before.
The need for improved understanding, monitoring, and prediction of environmental conditions leading to coral bleaching is imperative. Satellite remote sensing, which provides synoptic views of the global oceans in near real-time and monitors remote reef areas previously known only to wildlife, is an essential tool for coral reef managers and scientists. In 1997, NOAA's National Environmental Satellite, Data, and Information Service (NESDIS) began producing web-accessible, satellite-derived, global near real-time nighttime sea surface temperature (SST) products to monitor thermal conditions conducive to coral bleaching, and to assess the intensity of bleaching stress around the globe. This activity evolved into a crucial part of NOAA's Coral Reef Watch (CRW) program in 2000 (Strong et al., 2004; Liu et al., 2005).
CRW's original, heritage global satellite coral bleaching heat stress monitoring products (including SST, SST Anomaly, Coral Bleaching HotSpot, coral bleaching Degree Heating Week, Bleaching Alert Area, and the Virtual Stations) were produced twice-weekly at 50km-resolution. They were supported and delivered in "operational" status by NESDIS' Office of Satellite and Product Operations (OSPO). These products served the US and international coral reef communities for more than 20 years (1997-2020), as the only global early-warning system of coral reef ecosystem physical environmental changes. They monitored and predicted all major mass coral bleaching events observed globally since 1997, while also providing other critical information to users, especially during times of high heat stress. While the 50km products were retired on April 30, 2020 and are no longer updated in near real-time, since they served as vital tools for CRW's users for so many years, archived 50km data and images are still available on the CRW website.
The 50km heritage products built the foundation of the CRW program. They established CRW's position, and thus NOAA's position, as the sentinel of global coral reef environment monitoring since 1997. With the retirement of the 50km products, as of May 1, 2020, CRW's coral bleaching heat stress monitoring officially entered a new era with its next-generation, operational daily global 5km (0.05 degree) coral bleaching heat stress monitoring products (Liu et al., 2014).
CRW developed the higher-resolution 5km products at the direct request of CRW's user community. Originally released as Version 1.0 on July 5, 2012, the 5km suite was enhanced with a next-generation SST analysis and an improved climatology to create Version 2.0 on May 5, 2014. A significantly improved climatology was then introduced in the Version 3.0 product suite, released May 4, 2017. CRW's current version of the daily global 5km products (Version 3.1) was released on August 1, 2018. Click here to learn more about the evolution of the daily global 5km product suites.
The 5km products provide service at or near reef-scales and allow direct monitoring of 95% of coral reefs globally. Data gaps were reduced significantly through: a higher-resolution land mask, processing of data right up to the shoreline, significantly increased data density, and reduced cloud contamination - the latter two via the use of data from a collection of polar-orbiting and geostationary satellites.
The operational daily global 5km coral bleaching heat stress monitoring products are now the core of CRW's decision support system for coral reef management. In its latest version (Version 3.1 or v3.1), the products span January 1, 1985 to the present and include: SST (a.k.a. CoralTemp), SST Anomaly (SSTA), Coral Bleaching HotSpot, coral bleaching Degree Heating Week (DHW), a single-day Bleaching Alert Area, a 7-day maximum Bleaching Alert Area, and a 7-day SST Trend. CRW produces year-to-date (for the current year), monthly, and annual composites of the SST, SSTA, Coral Bleaching HotSpot, DHW, and Bleaching Alert Area products. We also provide the most recent 30-day and 90-day animations of the SST, SSTA, Coral Bleaching HotSpot, DHW, Bleaching Alert Area (7-day maximum), and SST Trend products. In addition, we offer Daily 5km Regional Virtual Stations/Bleaching Heat Stress Gauges and a free, automated 5km Satellite Bleaching Alert Email System that are based on the global products. All of these products are described in the following sections. Data and images are available for free on the CRW website at: https://coralreefwatch.noaa.gov/product/5km/index.php.
2. Sea Surface Temperature (SST)
SUMMARY: On August 1, 2018, CRW released its Version 3.1 (v3.1) daily global 5km satellite sea surface temperature (SST) product, known as CoralTemp. Derived from a combination of three satellite SST datasets, and spanning January 1, 1985 to the present, CoralTemp is one of the best and most internally consistent gap-free daily global 5km SST products currently available. Data and images are updated daily.
NOAA has been measuring SST via satellites since 1972. Monitoring of SST from earth-orbiting infrared radiometers has had a wide impact on oceanographic science. SST data come from multiple sensors (e.g., thermal infrared, microwave) deployed on both polar-orbiting and geostationary satellites. In situ SSTs from buoys (drifting and moored) are used operationally to maintain the accuracy of satellite SST by removing biases and compiling statistics with time (McClain et al., 1985; Strong, 1991; Montgomery and Strong, 1995; Strong et al., 2000).
In August 2018, in partnership with NOAA/NESDIS' Geostationary-Polar-orbiting (Geo-Polar) Blended Satellite SST product team, CRW released CoralTemp, a daily global 5km-resolution (0.05 degree exactly) gap-free SST data product. Produced in near real-time, the v3.1 CoralTemp SST product spans January 1, 1985 to the present. Note that the v3.1 CoralTemp SST is consistent with the versioning of the daily global 5km satellite coral bleaching heat stress monitoring products.
The CoralTemp SST provides a measurement of the nighttime ocean temperature at the sea surface, calibrated to 0.2 meters depth. Nighttime-only satellite SST observations are used to reduce the influence of daytime warming caused by solar heating at and near the sea surface and to avoid contamination from solar glare. Furthermore, at night, water temperatures at and near the sea surface are more vertically uniform. Compared with the daytime SST and blended day-night SST, the nighttime SST measurements provide more stable estimates of heat stress conducive to coral bleaching. The CoralTemp SST can be considered as a sea surface foundation temperature as described by the Group for High Resolution Sea Surface Temperature (GHRSST).
CoralTemp is derived using a combination of the following three level-4 (i.e., gridded and gap-filled analysis) satellite SST products, which are produced daily and gridded at the same 0.05 degree spatial resolution:
The reprocessed version of the Geo-Polar Blended SST (i.e., NOAA's Geo-Polar Blended SST reanalysis), spanning September 2002-December 2016, was used as the backbone of the CoralTemp SST record. This dataset was extended via the OSTIA reanalysis backwards in time to January 1985, and forwards to the present via the near real-time Geo-Polar Blended SST.
CRW developed the CoralTemp SST for use with its coral bleaching heat stress monitoring products; therefore, the three level-4 satellite SST datasets were merged during two overlapping time periods with the least (little to no) global heat stress activities (Skirving et al., 2019). Since 29 days represent a full tidal cycle, by gradually merging the two datasets over this period, we minimized any local differences between the two datasets. Accordingly, the percentage of global coral reef pixels at HotSpot ≥ 1 were calculated and examined for the two years to determine respective 29-day transition time periods.
We chose November 2002 as the month, in which CoralTemp would switch from using the OSTIA reanalysis to the Geo-Polar Blended SST reanalysis. To avoid any unusual jumps in temperature for any one satellite pixel, we transitioned from the OSTIA reanalysis to the Geo-Polar Blended SST reanalysis during the first 29 days of November 2002, with the OSTIA reanalysis being phased out and the Geo-Polar Blended SST reanalysis being phased in, using a linear approach. During the 29-day transition period, each day's CoralTemp SST was therefore calculated as:
Day 1: (28 x SSTOSTIA + 1 x SSTGeo-Polar-Blended Reanalysis)/29
Day 2: (27 x SSTOSTIA + 2 x SSTGeo-Polar-Blended Reanalysis)/29
...
Day 29: (1 x SSTOSTIA + 28 x SSTGeo-Polar-Blended Reanalysis)/29
For the transition from NOAA's Geo-Polar Blended SST reanalysis to NOAA's near real-time Geo-Polar Blended SST, we used a similar approach. We chose October 2016 as the month when we transitioned the CoralTemp SST product from using the Geo-Polar Blended SST reanalysis to the near real-time Geo-Polar Blended SST. The transition occurred over the period October 1-29, 2016, and was calculated similarly to the above.
By using the specific source datasets described above, CoralTemp was made available as one of the best and most internally consistent daily global 5km SST products that span the period 1985 to the present.
CoralTemp was originally released online on the CRW website as version 1.0 (v1.0). However, on March 21, 2019, it became v3.1, without any change to the product. In other words, v1.0 i and v3.1 are the same product. The change in version number was due solely to CoralTemp becoming part of CRW's daily global 5km satellite coral bleaching heat stress product suite. Since the versioning of CRW products is done at the product suite level, CoralTemp's change from v1.0 to v3.1 became necessary for consistency.
The product is updated each afternoon at about 12:00pm U.S. Eastern Time. Data and images are available for free on the CRW website at https://coralreefwatch.noaa.gov/product/5km/index.php. The color range of temperatures displayed on the SST maps is -2.0 to 35.0 °C. Each color gradation on the color bar is 1.0 °C. Any satellite pixels that have SST values greater than 35.0 °C are displayed in the same color as SST equal to 35.0 °C. An ice mask is also incorporated, courtesy of the United Kingdom Met Office and the NOAA National Centers for Environmental Prediction (NCEP).
SUMMARY: Coral bleaching is caused by unusually warm sea surface temperatures (SSTs). Therefore, the first step in looking for areas at risk for bleaching is to define the "usual" temperatures in the world's oceans as baseline (or reference). This is accomplished by calculating a set of 12 long-term monthly mean SSTs, or climatologies. The climatologies CRW developed for its v3.1 daily global 5km satellite coral bleaching heat stress monitoring products use 28 years of satellite data (1985-2012), based on the v3.1 daily global 5km CoralTemp satellite SST data product, but have a baseline (or reference) time period of 1985-1990 plus 1993 only. The Maximum of the Monthly Mean SST climatology is then defined as the warmest of the 12 monthly mean climatology values for each pixel around the world, indicating the upper limit of "usual" temperature. These climatologies are available as images and netCDF4 data files on the CRW website.
A climatology, by definition, is the long-term condition for a specified time period. The climatology for CRW's v3.1 daily global 5km satellite coral bleaching heat stress monitoring products has a baseline (or reference) time period of 1985-1990 plus 1993 only. This climatology was derived from daily SST values, from 1985-2012, of CRW's v3.1 CoralTemp data product. This follows CRW's currently-established methodology (Heron et al., 2015) for its daily global 5km satellite coral bleaching heat stress products. Note that although we used data from 1985-2012 to derive the climatology, an adjustment (see below) made the resultant climatology represent the baseline (reference) time period of 1985-1990 plus 1993.
We created the climatology through the following steps:
We derived the climatology in this way to allow us to use a sufficiently long time series (1985-2012) of daily satellite SST values to adequately capture inter-annual SST variability in the initial climatology, but also maintain, in the final climatology produced, the baseline (reference) time period of 1985-1990 plus 1993. This baseline time period is used in CRW's heritage 50km climatology and subsequent 5km climatologies (both current and historical).
The 5km-resolution climatologies are available as images and netCDF4 data files on the CRW website.
Special note on the climatology baseline (reference) time period:
When CRW first developed its coral bleaching heat stress monitoring algorithm and implemented the derived coral bleaching heat stress products in near real-time, satellite SST data were only available for the time period 1985-1993. (These were the 36km satellite-only reprocessed SST data from the Multi-Channel SSTs by the Rosenstiel School of Marine and Atmospheric Science at the University of Miami (Gleeson and Strong, 1995). In situ SSTs from drifting and moored buoys were used to remove any biases, and statistics were compiled with time to derive the reprocessed SSTs.) From these available data to build a climatology, data from 1991-1992 were omitted from the climatology baseline time period, due to their low accuracy (significant cold bias). Data inaccuracies were caused by intervening aerosol contamination following the eruption of Mt. Pinatubo on June 15, 1991. Its aerosol cloud spread rapidly around the earth in about three weeks and attained global coverage by about one year after the eruption. Later, when longer time series of higher-quality satellite SST data became available, CRW tested whether adding data from 1991-92 and/or more recent years (after 1993) to its climatology baseline time period would impact the coral bleaching heat stress monitoring algorithm. Addition of these data caused dysfunction of the algorithm and subsequent coral bleaching heat stress monitoring. Very recently, the quality of reprocessed SST data for 1991-92, including those used in CoralTemp, has improved significantly. For that reason, we incorporated the v3.1 daily global 5km CoralTemp SST data from 1991-92 into the derivation of our initial climatology from 1985-2012 (see the processing steps described above). However, for the final climatology, we adjusted its mean to correspond to the baseline (reference) time period of 1985-1990 plus 1993, to maintain consistency with our heritage products and to avoid inferring an assumption that corals are able to adapt as quickly as the climate is warming.
A much more detailed description with graphic illustration on the climatology baseline (reference) time period is provided here.
4. Sea Surface Temperature Anomaly (SSTA)
SUMMARY: CRW's daily global 5km satellite SST Anomaly (SSTA) is produced by subtracting the long-term mean SST climatology (for a specific location and a specific day of year) from a daily SST value. A positive anomaly means that the daily SST is warmer than the long-term average for that day; a negative anomaly means it is cooler than the average. Data and images are produced globally at 5km-resolution and are updated daily.
CRW's daily global 5km satellite SSTA product makes it possible to quickly pinpoint regions of elevated SST throughout the world's oceans. It is especially valuable for the tropical regions where most of the world's coral reef ecosystems thrive. It also is very useful in assessing El Niño-Southern Oscillation (ENSO) development, monitoring hurricane "wake" cooling, observing major shifts in coastal upwelling, etc.
The daily global 5km SSTA product requires a daily climatology to calculate the daily SST anomalies. Daily climatologies (DC) are derived from the monthly mean (MM) climatology via linear interpolation. To achieve this, we assigned the MM value to the 15th day of each corresponding month, with the individual days between these dates being derived using linear interpolation.
We then calculate the SSTA product using:
SST_anomaly = SST - DC
where the SST is the value for the day in question, and DC is the corresponding daily climatology for that day of the year.
The color range of temperature anomalies displayed on the SSTA maps is -5.0 to +5.0 °C. Areas with SSTA values less than -5.0 °C are displayed as -5.0 °C, and areas with values greater than +5.0 °C are displayed as +5.0 °C. A positive anomaly means that the current SST is warmer than average; a negative anomaly means it is cooler than average. Very small anomaly values, such as between -0.2 to +0.2 °C, are considered temperatures that are climatologically normal, at locations around the world, for a specified date. This, in part, is because of errors due to satellite instrument precision and accuracy. Therefore, in the SSTA product maps, we mask out areas of small anomaly values in light grey. Since the light grey areas comprise only a small portion of each image, this allows a user to focus on more significant anomalies that may impact the coral reef ecosystem.
Note that these anomalies are somewhat less reliable at high latitudes where more persistent clouds limit the amount of satellite data available for deriving accurate SST analysis fields and climatologies.
The SSTA product is produced daily at 5km (0.05-degree) resolution. SSTA data, along with the corresponding 0.05-degree MM SST climatologies, are available from January 1, 1985 to the present at https://coralreefwatch.noaa.gov/product/5km/index.php.
SUMMARY: Corals are vulnerable to bleaching when the SST exceeds the temperatures normally experienced in the hottest month of the year. This is shown in the daily global 5km satellite Coral Bleaching HotSpot product, which highlights regions where the SSTs are warmer than the highest climatological monthly mean (i.e., the Maximum Monthly Mean, MMM) SST at those locations. The HotSpot value of 1.0 °C is a threshold for accumulated heat stress leading to coral bleaching (i.e., the bleaching threshold). Data and images are produced globally at 5km-resolution and are updated daily.
CRW's daily global 5km satellite Coral Bleaching HotSpot product measures the occurrence and magnitude of instantaneous heat stress conducive to coral bleaching. It is a type of anomaly product but is different from the SST anomaly that we use to describe the departure of SST from a long-term average of the corresponding time period. The HotSpot anomaly is measured against the long-term mean SST of the climatologically hottest month of year (often referred to as the Maximum Monthly Mean (MMM) SST climatology) (Liu et al., 2003; Liu et al., 2005; Skirving, 2006). This MMM SST climatology is simply the highest of the monthly mean (MM) SST climatologies described above in the Climatology section.
CRW derived the MMM SST climatology as a threshold for satellite remote monitoring of coral bleaching, following a laboratory study by Glynn and D'Croz (1990), which showed that temperatures exceeding 1 °C above the usual (average) summertime maximum are sufficient to cause stress, including bleaching, to corals. (This is why 1 °C above the MMM is referred to as the bleaching threshold temperature.) CRW's subsequent development of the satellite SST-based Coral Bleaching HotSpot was based on work by Goreau and Hayes (1994). Then in 1997, CRW released online, to the global coral reef community, its very first near real-time satellite global coral bleaching monitoring product, HotSpot (Goreau et al., 2000).
We calculate the Coral Bleaching HotSpot value as the difference between the measured daily global 5km (0.05-degree) satellite SST and the MMM SST climatology:
HotSpot = SST - MMM_SST_climatology
Only positive values are displayed in the Coral Bleaching HotSpot maps, since the HotSpot is designed to show
the occurrence and distribution of bleaching heat stress exceeding the MMM climatology. The range of HotSpots displayed
is 0.0 to +5.0 °C. HotSpot values between 0 and
1.0 °C are shown in shades of purple. HotSpots that are
at least 1.0 °C greater than the MMM SST climatology (i.e., at or
above the bleaching threshold) are displayed in yellow to red colors. This dramatic change
in the color scheme at 1.0 °C highlights the severity of heat stress and the initiation
of its accumulated effect on corals (see the Degree Heating Week [DHW] section directly below
for more information). Areas with Coral Bleaching HotSpot values greater than +5.0 °C are displayed
in the same color as +5.0 °C.
The Coral Bleaching HotSpot product is produced daily at 5km (0.05-degree) resolution. Data are available from January 1, 1985 to the present at https://coralreefwatch.noaa.gov/product/5km/index.php.
SUMMARY: Mass coral bleaching has been shown to be caused by prolonged periods of heat stress. The daily global 5km satellite coral bleaching Degree Heating Week (DHW) product accumulates Coral Bleaching HotSpots greater than 1 °C, over a 12-week window, thus showing accumulated heat stress conditions experienced by corals in the prior three months. It is a cumulative measurement of both intensity and duration of heat stress, and it is expressed in the unit °C-weeks. DHWs over 4 °C-weeks have been shown to cause significant coral bleaching; values over 8 °C-weeks have caused severe bleaching and significant mortality. Data and images are produced globally at 5km-resolution and are updated daily.
CRW's daily global 5km satellite coral bleaching DHW product measures the accumulation of heat stress that coral reefs experienced over the prior 12 weeks (3 months), up to and including the most current product update. While the daily global 5km satellite Coral Bleaching HotSpot provides an instantaneous measure of heat stress, corals are sensitive to an accumulation of heat stress over time (Glynn and D'Croz, 1990). In order to monitor this cumulative effect, CRW developed a heat stress index, the coral bleaching DHW, in 2000 (Liu et al., 2003; Liu et al., 2005). Since Glynn and D'Croz (1990) had shown that temperatures exceeding 1 °C above the usual summertime maximum (i.e., the bleaching threshold temperature) are sufficient to cause stress, including bleaching, to corals, CRW chose to only accumulate Coral Bleaching HotSpot values equal to or larger than 1 °C. In other words, a HotSpot value is accumulated into the DHW calculation when the SST on any day reaches or exceeds the bleaching threshold (MMM + 1 °C); it is not accumulated on the days when it is below this threshold. As one example calculation, a DHW of 2 is equivalent to one week of HotSpot values persistently at 2 °C, or two weeks of HotSpot values persistently at 1 °C, etc.
Note that since the daily global 5km DHW is a 12-week accumulation of Coral Bleaching HotSpots, it is possible for a location to have a non-zero DHW value on a day when the HotSpot value is less than 1 °C and even 0 °C. This condition simply means that heat stress was present at that location within the last three months, but local conditions are not stressful for corals on the day in question. Exposure to the previous heat stress may still have had adverse impacts on the corals, although recovery also may be underway.
The formula used to calculate the DHW is below. In this mathematical equation, the DHW value for a given day i (DHWi) is calculated as the summation, over a 12-week (84 days) running window up to and including that day (i), of 1/7 of each Coral Bleaching HotSpot (HSj) value of 1 °C or more. The factor of 1/7 is used to express the final DHW value in terms of degree Celsius-weeks (°C-weeks), as the development of coral bleaching is usually on the order of weeks:
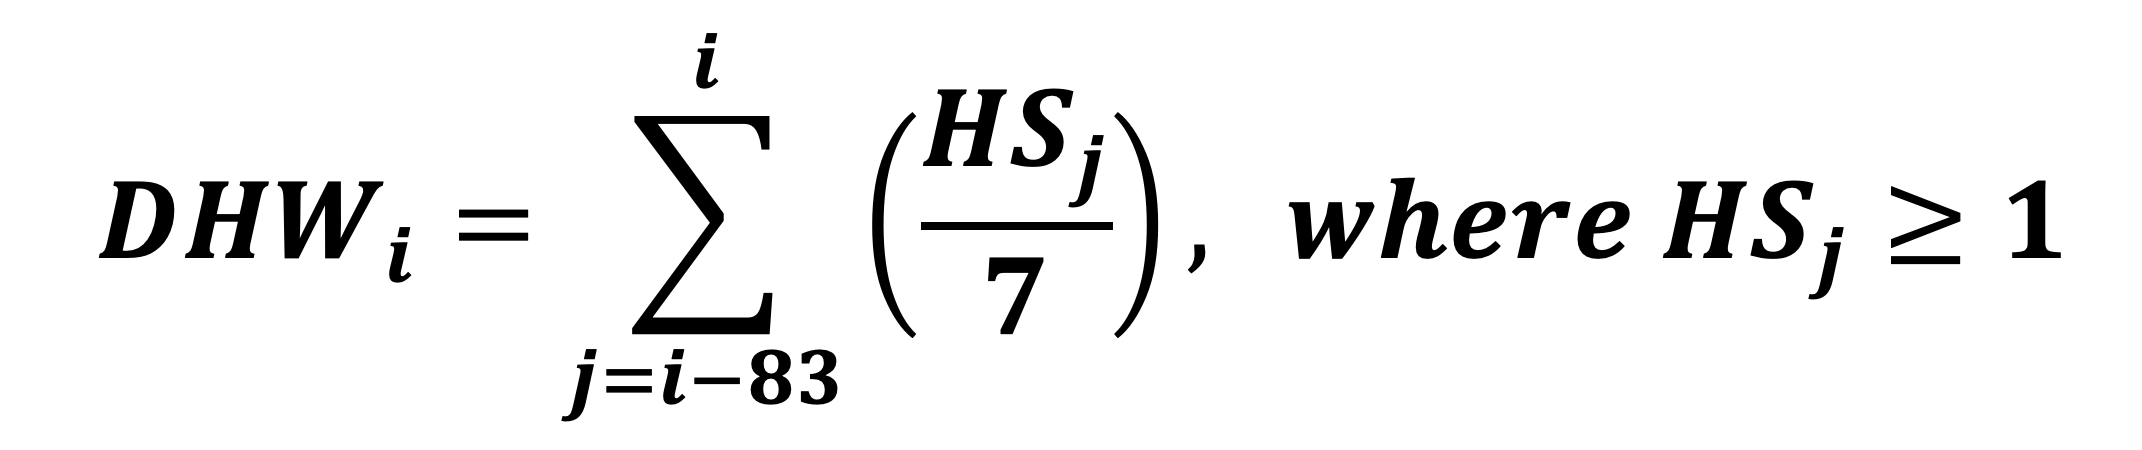
Let's look at an hypothetical example. Say that within a 12-week window ending on June 1, 2014 (i = June 1, 2014), there had been only four daily Coral Bleaching HotSpot values above zero: 1.0, 2.0, 0.8 and 1.2 °C. Because 0.8 °C is less than 1 °C, we would not have included it in the DHW summation of accumulated heat stress. However, 1.0, 2.0, and 1.2 °C each would have been divided by 7, and then summed. The resulting DHW value for June 1, 2014 (DHWJune 1, 2014) then would have been 0.6 °C-weeks.
The range of DHWs displayed on the daily global 5km satellite coral bleaching DHW maps is 0.0 to 20.0 °C-weeks. Any area with a DHW value greater than 20 °C-weeks is displayed in the same color as 20 °C-weeks.
Field observations around the globe from both professional scientific surveys and informal monitoring have indicated that there is a correlation with reef-wide coral bleaching when the DHW value reaches 4 °C-weeks. By the time the DHW value reaches 8 °C-weeks, reef-wide coral bleaching with mortality of heat-sensitive corals can be expected. Since its inauguration in 2000, the DHW product, at both 50km resolution and now (in its next-generation version) at 5km resolution, has successfully monitored in near real-time and helped CRW alert users to all major mass coral bleaching events observed globally (e.g., Goreau et al., 2000, Wellington et al., 2001; Strong et al., 2002; Liu et al., 2005; Strong et al., 2003; Liu et al., 2003; Skirving et al., 2006; and Eakin et al., 2010).
Note: the timing of the peak bleaching season each year varies among ocean basins and hemispheres, but it is generally during the local summertime. Thus, the peak season is July-September for the northern Atlantic and Pacific Oceans, and January-March for the southern Atlantic and Pacific. The peak is April-June for the northern Indian Ocean and January-April for the southern Indian Ocean.
SUMMARY: The daily global 5km satellite coral Bleaching Alert Area (7-day maximum) is a composite product that summarizes the current DHW and Coral Bleaching HotSpot values. At a glance, this product outlines the current locations, coverage, and potential risk level of coral bleaching heat stress around the world. Data and images are produced globally at 5km-resolution and are updated daily.
CRW's daily global 5km coral Bleaching Alert Area (7-day maximum) product outlines the areas around the world where coral bleaching heat stress currently reaches various levels, based on CRW's satellite SST monitoring.
SST variability is often considerably higher at the much finer 5km spatial and daily temporal resolutions, when compared with CRW's heritage twice-weekly global 50km coral bleaching heat stress monitoring products. Due to resulting day-to-day fluctuations between stress levels in highly variable locations, the daily global 5km Bleaching Alert Area single-day product does not consistently and adequately identify potentially harmful heat stress levels, especially with regard to accumulated heat stress impacts. Therefore, CRW chose to feature the Bleaching Alert Area (7-day maximum) composite as the main Bleaching Alert Area product on its website. The Bleaching Alert Area (7-day maximum) product is updated daily, after the corresponding seven Bleaching Alert Area single-day products. The 7-day composite product shows the maximum stress level that a satellite pixel has experienced during the most recent seven consecutive days, as depicted by the corresponding seven Bleaching Alert Area single-day products. Data and images are dated on the last day of the 7-day period.
The heat stress level in the individual Bleaching Alert Area single-day products at a 5km satellite data grid, on any day, is based on CRW's daily global 5km Coral Bleaching HotSpot and DHW products for that day. The coral bleaching heat stress levels are defined in the table below (updated in December 2023):
| Stress Level | Definition | Potential Coral Bleaching and Mortality | ||
|
|
|
|
While the Bleaching Alert Area single-day product is not featured on the CRW website, it is available through the Archived Data and Images pulldown menus on the daily global 5km satellite coral bleaching heat stress monitoring products data page at https://coralreefwatch.noaa.gov/product/5km/index.php.
Note that in the Bleaching Alert Area (7-day maximum) composite product, locations with a status of No Stress or Bleaching Watch, for a 7-day time period, may still have been exposed to recent heat stress, including in the days immediately preceding the 7-day period under evaluation. The reason is that the Bleaching Alert Area (7-day maximum) composite product classifies the heat stress condition for a specified 7-day period only -- and that heat stress level is determined by the seven, most-recent daily value pairs of CRW's daily global 5km Coral Bleaching HotSpot and DHW. So if, during the specified 7-day period being evaluated, the seven Coral Bleaching HotSpot values (within the seven daily pairs of Coral Bleaching HotSpot/DHW) were all zero, this would indicate the absence of active heat stress. For that reason, a No Stress level would be assigned; and any heat stress experienced during the 11 weeks preceding the 7-day period would not be examined, as corals should be in a recovery state. If, during the specified 7-day period being evaluated, any of the seven Coral Bleaching HotSpot values (within the seven daily Coral Bleaching HotSpot/DHW pairs) were greater than zero, but below the bleaching threshold for accumulating DHWs, this would indicate that there is currently insufficient heat stress to actively cause or worsen visible bleaching. For this reason, none of the seven daily DHW values (within the seven daily Coral Bleaching HotSpot/DHW pairs) would be examined; a Bleaching Watch level would be assigned; and any recently-accumulated DHWs greater than zero, that occurred within the 11 weeks preceding the 7-day period, would not be used to determine the current Bleaching Alert Area heat stress level. With that said, if on any future day, the Coral Bleaching HotSpot resurrected, and was greater than the threshold for accumulating DHWs, then recent heat stress exposure during the entire past 12 weeks (84 days) would be evaluated. This means all daily Coral Bleaching HotSpot values that exceeded the bleaching threshold during the past 12 weeks would be accumulated to calculate the DHWs and determine the Bleaching Alert Area (7-day maximum) composite product heat stress level. As a result, a future heat stress level could jump from No Stress or Bleaching Watch to any of the higher levels, as the calculation again would be dependent on recent heat stress exposure during the last 12 weeks. This situation also applies to the single-day Bleaching Alert Area product.
As noted previously, the timing of the peak bleaching season each year varies among ocean basins and hemispheres, but it is generally during the local summertime. Thus, the peak season is July-September for the northern Atlantic and Pacific Oceans, and January-March for the southern Atlantic and Pacific. The peak is April-June for the northern Indian Ocean and January-April for the southern Indian Ocean.
SUMMARY: CRW's daily global 5km 7-day SST Trend product shows the SST trend for the most recent seven days. Pixels colored in green have insignificant trends due to either failing the test or due to very small SST trends (within the range -0.2 to 0.2 °C). Data and images are produced globally at 5km-resolution and are updated daily.
CRW's daily global 5km 7-day SST Trend product provides information on the near-term pace and direction of SST variation, and thus coral bleaching heat stress over the past seven days. Seven daily 5km CoralTemp SST measurements for each pixel are included in the calculation used to derive the product images. Trends are checked statistically with the two-tailed Student's t-test for the 20% significance level with five degrees of freedom. Pixels colored in green have insignificant trends due either to small SST trends (within the range -0.2 to 0.2 °C) or trends that failed the statistical test.
SUMMARY: CRW offers year-to-date, monthly, and annual composites, as well as 30-day and 90-day animations, of its v3.1 daily global 5km satellite coral bleaching heat stress products.
CRW offers on its website year-to-date (for the current year), monthly, and annual composites of its v3.1 daily global 5km satellite coral bleaching heat stress monitoring products. Composite products include SST, SSTA, Coral Bleaching HotSpot, DHW, and Bleaching Alert Area. Maximum composites are available for all of these variables. Minimum and mean composites are available only for the SST and SSTA products because the Coral Bleaching HotSpot, DHW, and Bleaching Alert Area are positive-value-only products. A mean, maximum, or minimum composite of a product for a specified time period, is simply the arithmetic average, maximum, or minimum of all the daily values of the product within the specified time period, respectively. Composite data and maps can be accessed here.
CRW also provides the most recent 30-day and 90-day animations of the SST, SSTA, Coral Bleaching HotSpot, DHW, Bleaching Alert Area (7-day maximum), and SST Trend products. Animations can be accessed here and on each of the aforementioned product pages on the CRW website.
SUMMARY: CRW's daily 5km Regional Virtual Stations focus the v3.1 daily global 5km satellite data products on environmental conditions of 214 individual coral reef regions. The Regional Virtual Stations provide near real-time, comprehensive, collective information on all reefs in a jurisdiction or predetermined sub-region. As part of the Regional Virtual Stations product, we offer time series data (including two-year and multi-year time series graphs), Regional Bleaching Heat Stress Gauges, maps with data overlays in a Google Maps interface and in a Google Earth file, and a free, automated, subscription-based Satellite Bleaching Alert (SBA) Email System. The Regional Virtual Stations product also includes a prediction of bleaching heat stress for up to eight weeks into the future, based on CRW's Four-Month Coral Bleaching Outlook product. Data and images are produced at 5km-resolution and are updated daily.
CRW's daily 5km Regional Virtual Stations represent a change in the way we have looked at Virtual Stations in the past. The Virtual Stations product was created to provide comprehensive information for a coral reef area or region. It is like having a temperature sensor in the water next to a coral reef, but data are completely based on satellite remote sensing measurements. In the heritage twice-weekly 50km Coral Bleaching Virtual Stations, each Station was based on data from a single, spatially-large satellite pixel (i.e., a data grid point), sufficient to represent a coral reef area or region. With CRW's move to our next-generation daily global 5km coral bleaching heat stress monitoring, data from a single 5km pixel provide much higher spatial detail about a reef area or region, but the spatial coverage is much smaller (i.e., at 5km). Therefore, data from any single 5km pixel may be less representative of a region's thermal conditions. As a result, we designed the daily 5km Regional Virtual Stations to take advantage of the higher-resolution data, while simultaneously providing comprehensive and collective information on all reefs in a jurisdiction or predetermined sub-region. A Regional Virtual Station includes the data from all of the 5km pixels within that individual jurisdiction (e.g., Main Hawaiian Islands). An alert for a region is meant to inform users that they should look at the map products for more detail. Click here to learn more.
CRW expanded the geographic network of the daily 5km Regional Virtual Stations to include all coral reefs around the world, based on available references. These included the Millennium Coral Reef Mapping Project, the International Union for Conservation of Nature (IUCN)'s Coral Reefs of the World (Vol. 1, 2, and 3), the United Nations Environment Programme-World Conservation Monitoring Centre (UNEP-WCMC) World Atlas of Coral Reefs, several country scale atlas publications, and a few other resources. We continue to update the reef mask as new information on reef locations is added periodically. We separated reef locations into 214 individual Stations, covering most of the global coral reef regions and following country boundaries and island nation groups where possible, while keeping the number of Stations manageable. As a result, the size of each Regional Virtual Station varies greatly, but the methodology for calculating alerts within each region is consistent across all Stations. Data for the Regional Virtual Stations are produced from the 5km coral reef pixels within each Station plus all 5km pixels within a 20km buffer (outlined in each Regional Virtual Station map). The number of selected 5km pixels ranges from hundreds to thousands among the different Stations.
We use the data that fall within the boundary of each Regional Virtual Station to create a time series. Rather than provide the value of every 5km satellite pixel data point within a Station's boundary, we developed a new Regional Virtual Station algorithm. The algorithm is based on the daily 90th percentile Coral Bleaching HotSpot value among a Station's 5km pixels, and the other variables at the pixel where the 90th percentile HotSpot value locates. Daily Regional Virtual Station SST, SSTA, and Coral Bleaching HotSpot values for a given day are the respective values from the satellite pixel where the 90th percentile Coral Bleaching HotSpot value occurs on that day. The Daily Regional Virtual Station DHW is then calculated (accumulated) from the Daily Regional Virtual Station HotSpots over a consecutive 84 days, following the DHW algorithm. The Daily Regional Virtual Station Bleaching Alert Area single-day value is derived from the Daily Regional Virtual Station Coral Bleaching HotSpot and DHW pair, and a rolling Bleaching Alert Area (7-day maximum) composite value is then produced.
The heat stress level indicated by the Daily Regional Virtual Station's Bleaching Alert Area (7-day maximum) composite is used to change the Bleaching Heat Stress Gauge and send automated alerts to SBA Email System subscribers.
Note: since CRW's Daily 5km Regional Virtual Stations product provides summarized and recalculated regional statistical analyses of heat stress based on select data from a Station's 5km satellite pixels, the Daily Regional Virtual Station variables may not match what may be sensed directly from the Daily 5km Regional Virtual Station maps.
Time series data are available in ASCII text format. (The data file structure is described in more detail here.) Time series graphs show the Station's daily SST (along with the SST range of the Station's selected pixels), DHW, and Bleaching Alert Area heat stress levels since January 1, 1985. We provide two-year and multi-year graphs as well as long-term mean conditions: the MM SST climatology, the MMM SST climatology, and the bleaching threshold SST. The graphs are explained in more detail here.
In addition to the time series data (including the two-year and multi-year time series graphs), the daily 5km Regional Virtual Stations product includes Regional Bleaching Heat Stress Gauges, maps with data overlays in a Google Maps interface and in a Google Earth (kmz) file, and a free, automated, subscription-based SBA Email System (described in the next section).
The Regional Virtual Stations product also includes three maps showing the prediction of bleaching heat stress for up to eight weeks into the future, based on CRW's Four-Month Coral Bleaching Outlook product.
Data and images are available for free on the CRW website at https://coralreefwatch.noaa.gov/product/vs/data.php and are updated daily.
11. Satellite Bleaching Alert (SBA) Email System
SUMMARY: CRW's Satellite Bleaching Alert (SBA) Email System is a free, automated system that alerts subscribers when coral reefs within their jurisdiction/region/sub-region(s) of interest are at risk for bleaching. Users can subscribe to any or all of 214 different Regional Virtual Stations around the world. The system automatically delivers up-to-date information on changes in the bleaching alert status, as detected by CRW's daily global 5km satellite coral bleaching heat stress monitoring products. The SBA is a convenient data delivery system that allows critical information about coral bleaching heat stress to reach a user's e-mail account immediately, without the user having to manually check the CRW website.
CRW's SBA Email System is a free, automated system that alerts subscribers to heat stress conducive to coral bleaching at select reef locations around the globe. The system automatically delivers up-to-date information on changes in the bleaching alert level of the coral reef environment, as detected by CRW's daily global 5km satellite coral bleaching heat stress monitoring products. The SBA is a convenient data delivery system that allows critical information about coral bleaching heat stress to reach a user's email account immediately, without the user having to manually check the CRW website. The SBA has become an essential tool for coral reef managers, scientists, and other users. Originally offered for the heritage 50km Virtual Stations, the SBA was upgraded in October 2016 to provide 5km satellite observational data across the 214 Regional Virtual Stations.
Twice a week, on Monday and Thursday afternoons (U.S. Eastern Time), the system examines the Bleaching Alert Area heat stress level at each Regional Virtual Station for any change from the previous examination date. The automated system sends an email to relevant subscribers only for those Stations that experienced changes. Each email incorporates information found on the daily 5km Regional Virtual Stations page on the CRW website, including links to time series graphs, regional images, and a history of previous bleaching alerts issued.
To receive automated e-mail alerts for any or all of the 214 Regional Virtual Stations, click here. Once a subscription is added to the SBA system, a user can view and alter Station selection(s) or unsubscribe from the email list through the same portal. If at any time you would like to unsubscribe from the automated SBA system, please visit the unsubscription page.
12. Accessing 5km Product Data
CRW's daily global 5km coral bleaching heat stress monitoring product data are available on our website for free download and use at https://coralreefwatch.noaa.gov/product/5km/index.php. Data are presently available in NetCDF4 format via FTP, HTTP, and THREDDS and ERDDAP servers. We also provide preview images (graphic displays) of the data.
Additionally, CRW's daily global 5km coral bleaching heat stress monitoring products can be viewed using Google Earth. Available products include: SST, SSTA, Coral Bleaching HotSpot, DHW, Bleaching Alert Area, SST Trend, and the Regional Virtual Stations
. Click here to access the 5km data products in Google Earth format.Furthermore, a NOAA CoastWatch Utilities Tool can be used for visualizing the daily global 5km product data, viewing data information and values, calculating certain statistics, creating graphic output, etc. Click here to access the CoastWatch Utilities software tool. The software is easy to install and use, and is customized for CRW's NetCDF4 data files. This software is not required to visualize and manipulate the data. Many commonly used computer programming languages and software packages can read and process NetCDF4 files.
On September 14, 2020, CRW released a new tutorial for the next-generation daily global and regional 5km coral bleaching heat stress monitoring products discussed on this methodology page. The tutorial, which is content rich and presented in easy-to-understand language, is instructive for the public, especially students and teachers, who want to learn more about coral reefs, coral bleaching, satellite remote sensing of the marine environment, and CRW's near real-time 5km satellite-based decision support products for coral reef management that presently serve the U.S. and international coral communities.
Berkelmans, R. and B.L. Willis, 1999. Seasonal and local spatial patterns in the upper thermal limits of corals on the inshore Central Great Barrier Reef, Coral Reefs, 18, 219-228.
Coffroth, M.A., H.R. Lasker, and J.K. Oliver, 1990. Coral mortality outside of the eastern Pacific during 1982-1983: Relationship to El Niño. Elsevier Oceanography Series, P. W. Glynn, Ed., Elsevier, 141-182, http://doi.org /10.1016/S0422-9894(08)70035-7.
Costanza, R., de Groot, R., Sutton, P., van der Ploeg, S., Anderson, S.J., Kubiszewski, I., Farber, S., Turner, R.K., 2014: Changes in the global value of ecosystem services, Global Environmental Change, 26, 152-158, ISSN 0959-3780, https://doi.org/10.1016/j.gloenvcha.2014.04.002.
Eakin, C.M., G. Liu, A.M. Gomez, J.L. De La Cour, S.F. Heron, W.J. Skirving, E.F. Geiger, B.L. Marsh, K.V. Tirak, A.E. Strong, 2018: Unprecedented three years of global coral bleaching 2014-17 [in "State of the Climate in 2017"]. Bull. Amer. Meteor. Soc., 99 (8), S74-S75, doi:10.1175/2018BAMSStateoftheClimate.1.
Eakin CM, Morgan JA, Heron SF, Smith TB, Liu G, et al., 2010. Caribbean Corals in Crisis: Record Thermal Stress, Bleaching, and Mortality in 2005. PLoS ONE 5(11): e13969.
Gleeson, M.W. and A.E. Strong, 1995. Applying MCSST to coral reef bleaching. Adv. Space Res., 16(10), 10,151-10,154.
Glynn, P.W. (1990). Coral mortality and disturbances to coral reefs in the tropical eastern Pacific. In P.W. Glynn (Ed.), Global Ecological Consequences of the 1982-83 El Niño-Southern Oscillation (pp. 55-126). Elsevier; Oceanography Series, 52. http://doi.org /10.1016/S0422-9894(08)70033-3.
Glynn, P.W., D'Croz, L. Experimental evidence for high temperature stress as the cause of El Niño coincident coral mortality. Coral Reefs 8, 181-191 (1990). https://doi.org/10.1007/BF00265009.
Goreau, T.J., T. McClanahan, R. Hayes, and A. Strong, 2000. Conservation of coral reefs after the 1998 global bleaching event, Conservation Biology, 14(1), 5-15.
Goreau, T.J. and R. Hayes, 1994. Coral Bleaching and Ocean "Hot Spots". Ambio 23:176-180.
Heron, S.F., Liu G., Eakin C.M., Skirving W.J., Muller-Karger F.E., Vega-Rodriguez M., De La Cour J.L., Burgess T.F.R., Strong A.E., Geiger E.F., Guild L.S., Lynds S. (2015). Climatology Development for NOAA Coral Reef Watch's 5-km Product Suite. Technical Report NESDIS 145. National Oceanic and Atmospheric Administration's National Environmental Satellite, Data, and Information Service, Coral Reef Watch, College Park, MD. 21 p. doi:10.7289/V59C6VBS.
Liu, G., Heron, S.F., Eakin, C.M., Muller-Karger, F.E., Vega-Rodriguez, M., Guild, L.S., De La Cour, J.L., Geiger, E.F., Skirving, W.J., Burgess, T.F.R., Strong, A.E., Harris, A., Maturi, E., Ignatov, A., Sapper, J., Li, J. and Lynds, S., 2014. Reef-Scale Thermal Stress Monitoring of Coral Ecosystems: New 5-km Global Products from NOAA Coral Reef Watch. Remote Sens., 6, 11579-11606.
Liu G, Strong A, Skirving W, Arzayus F. (2005). Overview of NOAA Coral Reef Watch program's near real-time satellite global coral bleaching monitoring activities. Proc 10th Int Coral Reef Symp, Okinawa, Japan. 1. 1783-1793.
Liu, G., A.E. Strong, and W. Skirving. 2003. Remote sensing of sea surface temperature during 2002 Barrier Reef coral bleaching. EOS, 84 (15), 137-144.
Maturi E., Harris A., Mittaz J., Sapper J., Wick G., Zhu X., Dash P., Koner P. A new high-resolution sea surface temperature blended analysis. Bull. Amer. Meteor. Soc. (2017) 98(5):1015-1026. doi:10.1175/BAMS-D-15-00002.1h
McClain, E.P., W.G. Pichel, C.C. Walton. 1985. Comparative performance of AVHRR-based multi-channel sea surface temperatures; J. Geophys. Res. 90, 11587-11601.
Montgomery, R.S. and A.E. Strong (1994). Coral bleaching threatens oceans, life. EOS, 75(13), 145-147. doi:10.1029/94EO00837.
Reaser, J., Pomerance, R., & Thomas, P. (2000). Coral Bleaching and Global Climate Change: Scientific Findings and Policy Recommendations. Conservation Biology, 14(5), 1500-1511.
Roberts-Jones J., Fiedler E.K., Martin M.J., 2012: Daily, global, high-resolution SST and sea ice reanalysis for 1985-2007 using the OSTIA system. J. Climate, 25, 6215-6232, doi:10.1175/JCLI-D-11-00648.1
Skirving W.J., Heron S.F., Marsh B.L., Liu G., De La Cour J.L., Geiger E.F., Eakin C.M. The relentless march of mass coral bleaching: a global perspective of changing heat stress. Coral Reefs 38, 547-557 (2019). https://doi.org/10.1007/s00338-019-01799-4.
Skirving, W., Liu G., Strong A., Liu C., Sapper J., Arzayus F. (2006) Extreme events and perturbations of coastal ecosystems. In: Richardson L., LeDrew E. (eds) Remote sensing of aquatic coastal ecosystem processes. Remote Sensing and Digital Image Processing, vol 9. Springer, Dordrecht.
Strong, A.E., G. Liu, J. Meyer, J.C. Hendee, and D. Sasko, 2004: Coral Reef Watch 2002. Bull. Mar. Sci., 75(2): 259-268.
Strong, A.E., G. Liu and R. Brainard, 2003. NOAA Satellites Give Early Warning for Coral Bleaching in the Northwestern Hawaii Archipelago. Coastlines. 13 (3), 8-11.
Strong, A.E., G. Liu, T. Kimura, H. Yamano, M. Tsuchiya, S. Kakuma, and R. van Woesik, "Detecting and monitoring 2001 coral reef bleaching events in Ryukyu Islands, Japan using satellite bleaching HotSpot remote sensing technique", IEEE International Geoscience and Remote Sensing Symposium, Toronto, Ontario, Canada, 2002, pp. 237-239 vol.1, doi: 10.1109/IGARSS.2002.1024998.
Strong, A.E., E. Kearns and K.K. Gjovig, 2000. Sea Surface Temperature Signals from Satellites - An Update. Geophys. Res. Lett, 27(11): 1667-1670.
Strong, A.E., C.S. Barrientos, C. Duda, and J. Sapper, 1997. Improved satellite techniques for monitoring coral reef bleaching, Proc 8th Int'l Coral Reef Sym, 2, 1495-1498.
Strong, A.E., 1991. Sea surface temperature signals from space. In Encyclopedia of Earth System Science, Ed. W.A. Nierenberg, Vol 4, Academic Press, San Diego, CA, pp 69-80.
Wellington, G.M., P.W. Glynn, A.E. Strong, S.A. Navarrete, E. Wieters, and D. Hubbard, 2001. Crisis on Coral Reefs Linked to Climate Change, EOS, 82, 1-5.
Wilkinson, C. (2008). Status of coral reefs of the world: 2008. Global Coral Reef Monitoring Network and Reef and Rainforest Research Centre, Townsville, Australia, 296 p.