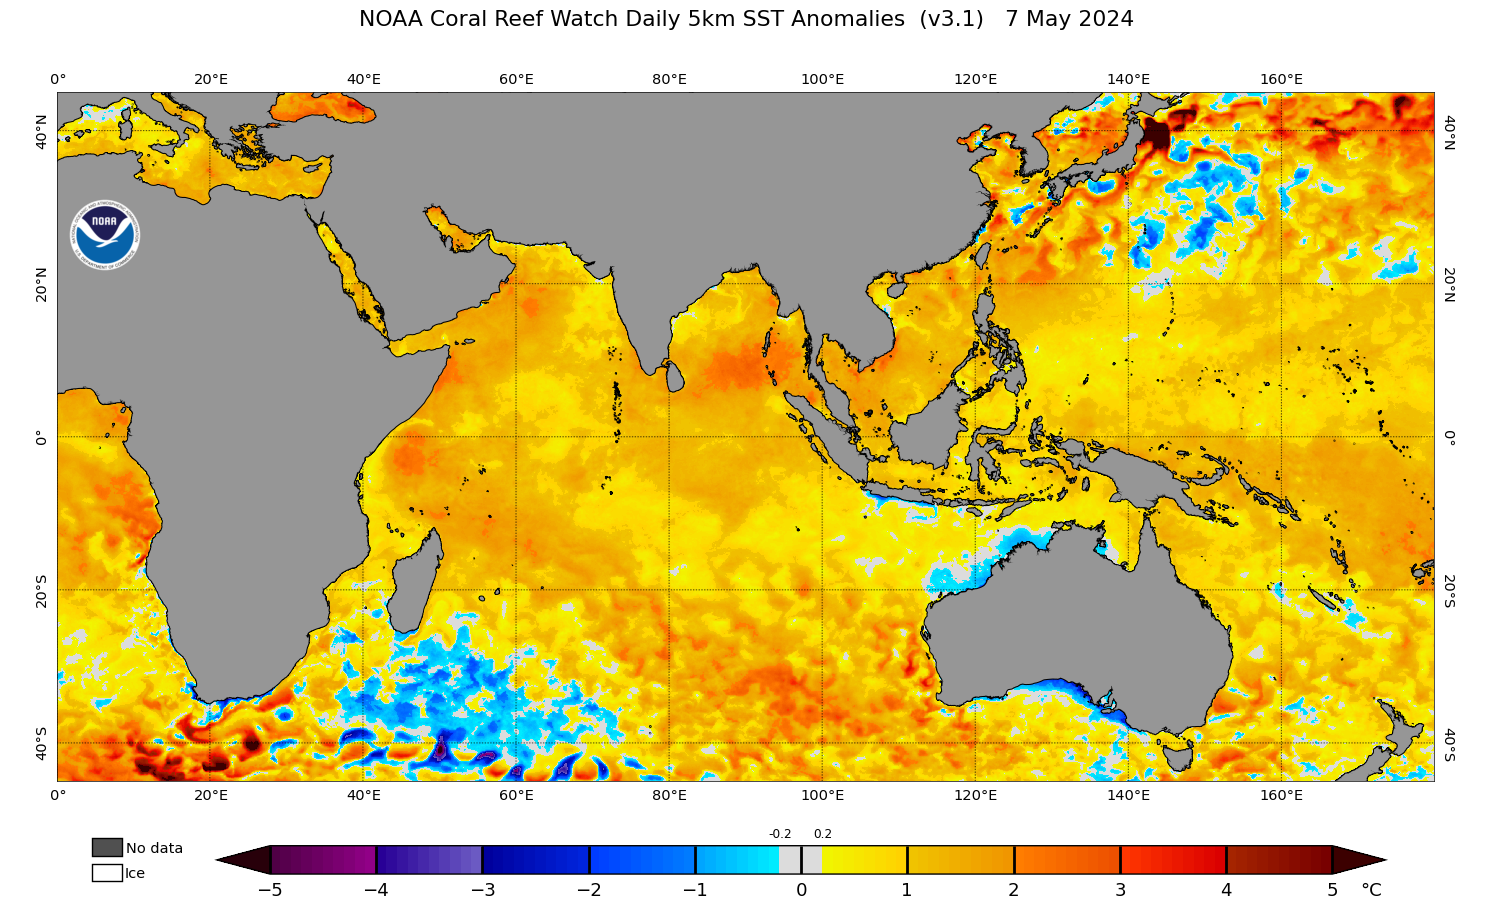
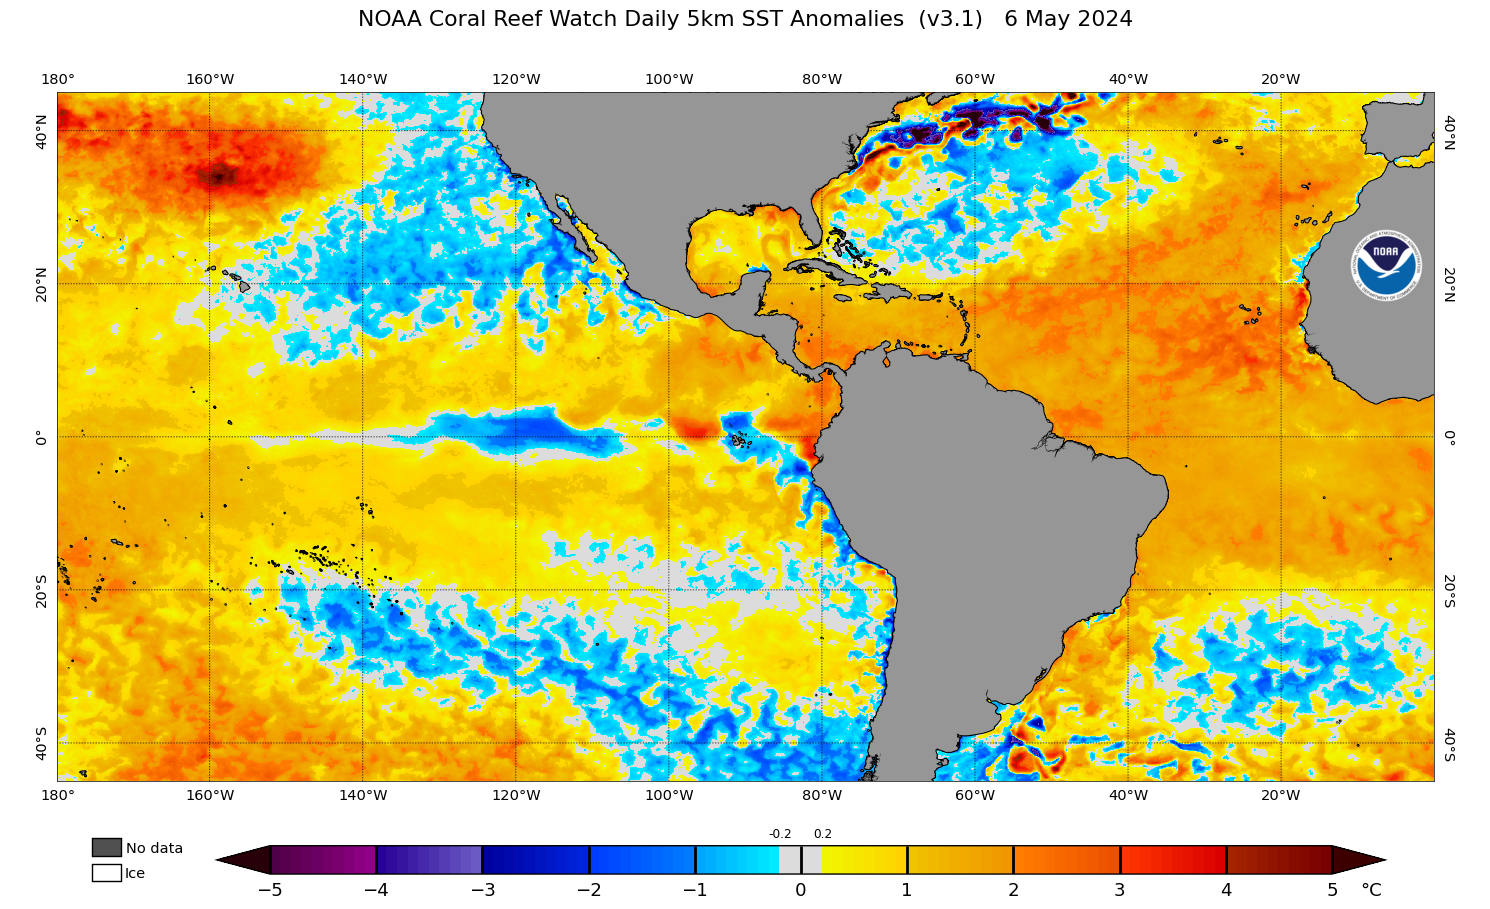
Click on map above to zoom to small 60 x 40-degree tiles; use drop-down menu below to view larger 60 x 40-degree tiles.
Right-click outside clickable map area to save the image.
60 x 40-degree tiles (by east/west hemispheres and low/high latitudes, updated daily)
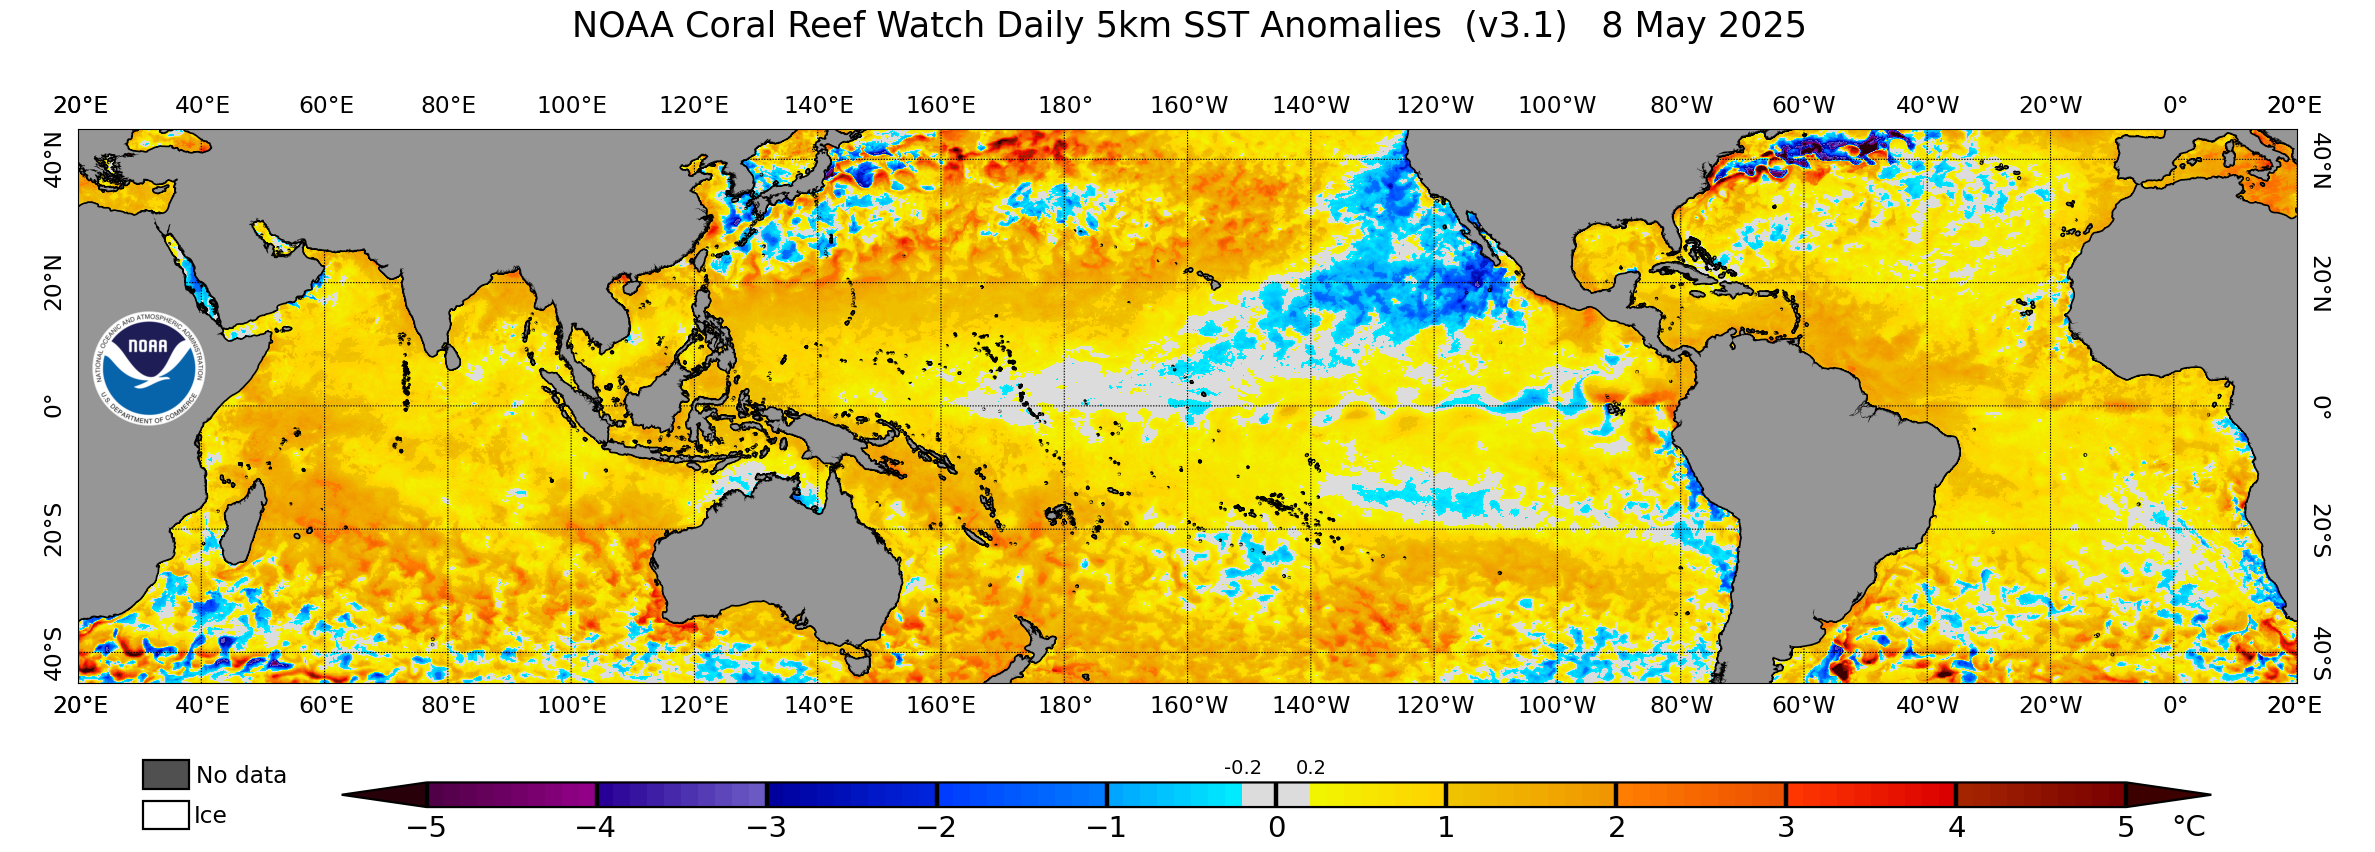
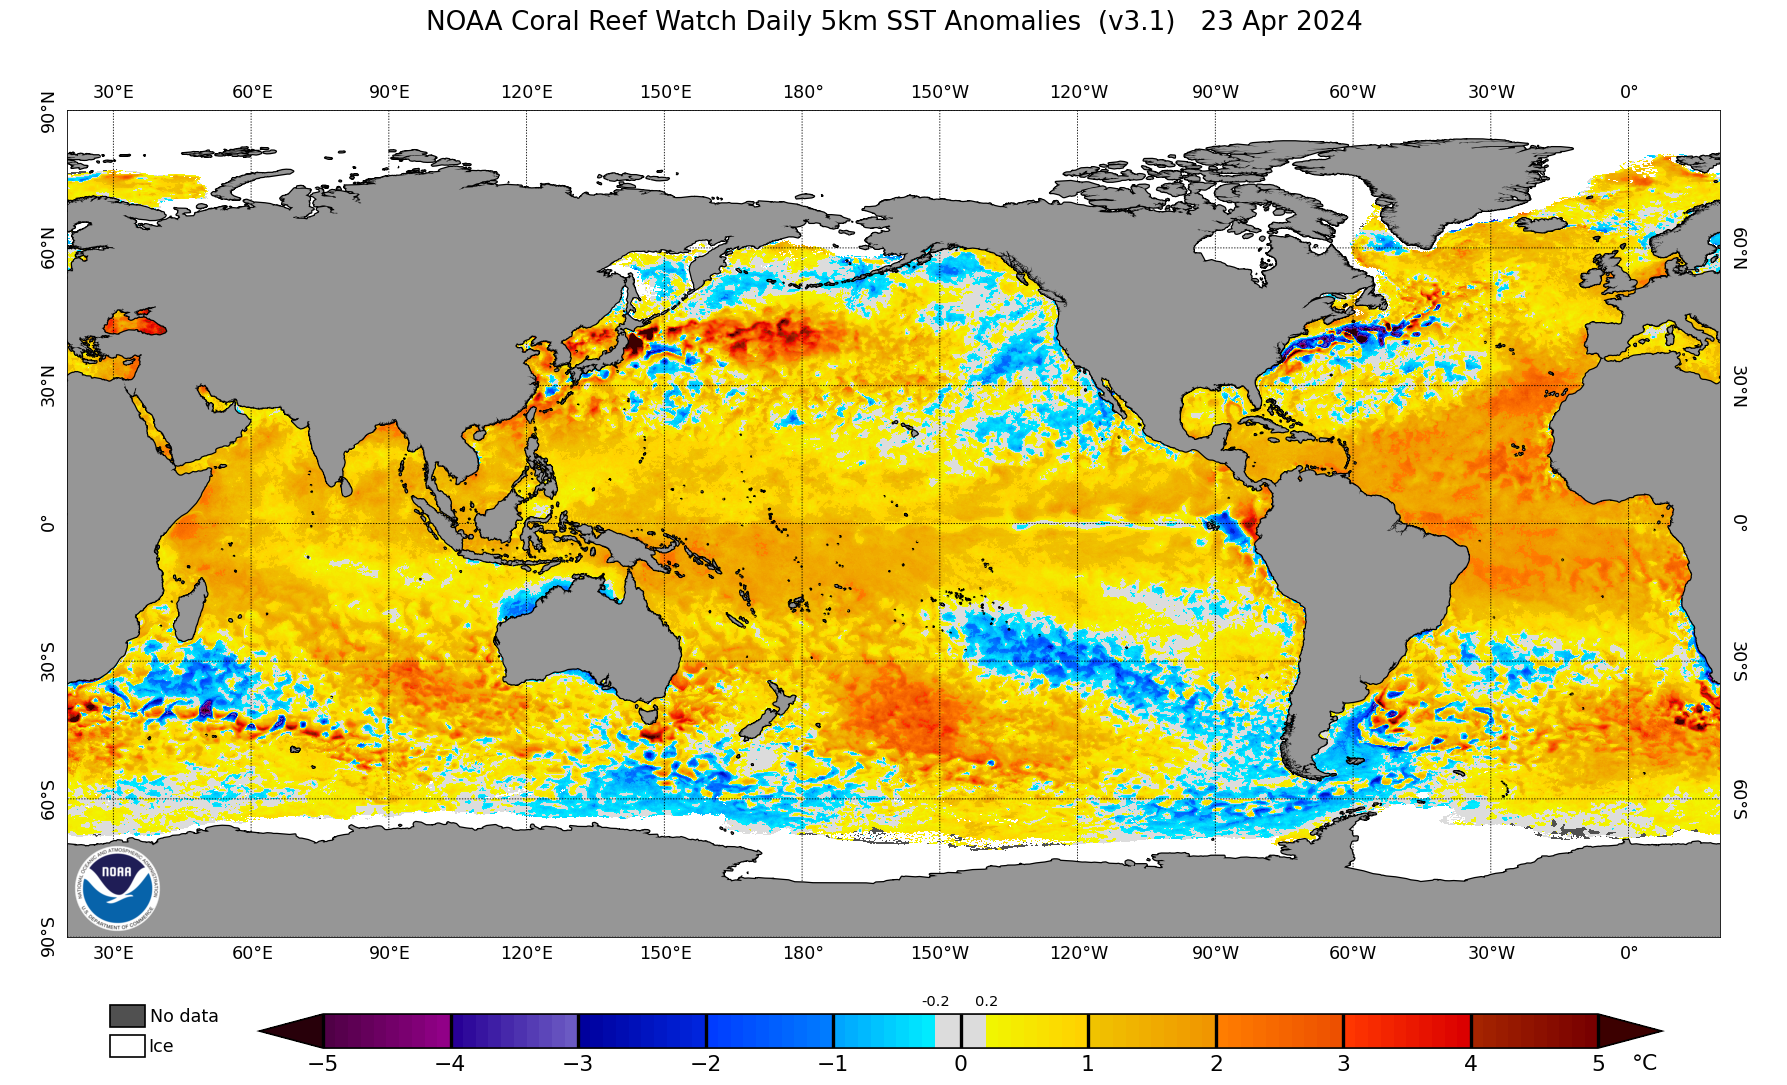
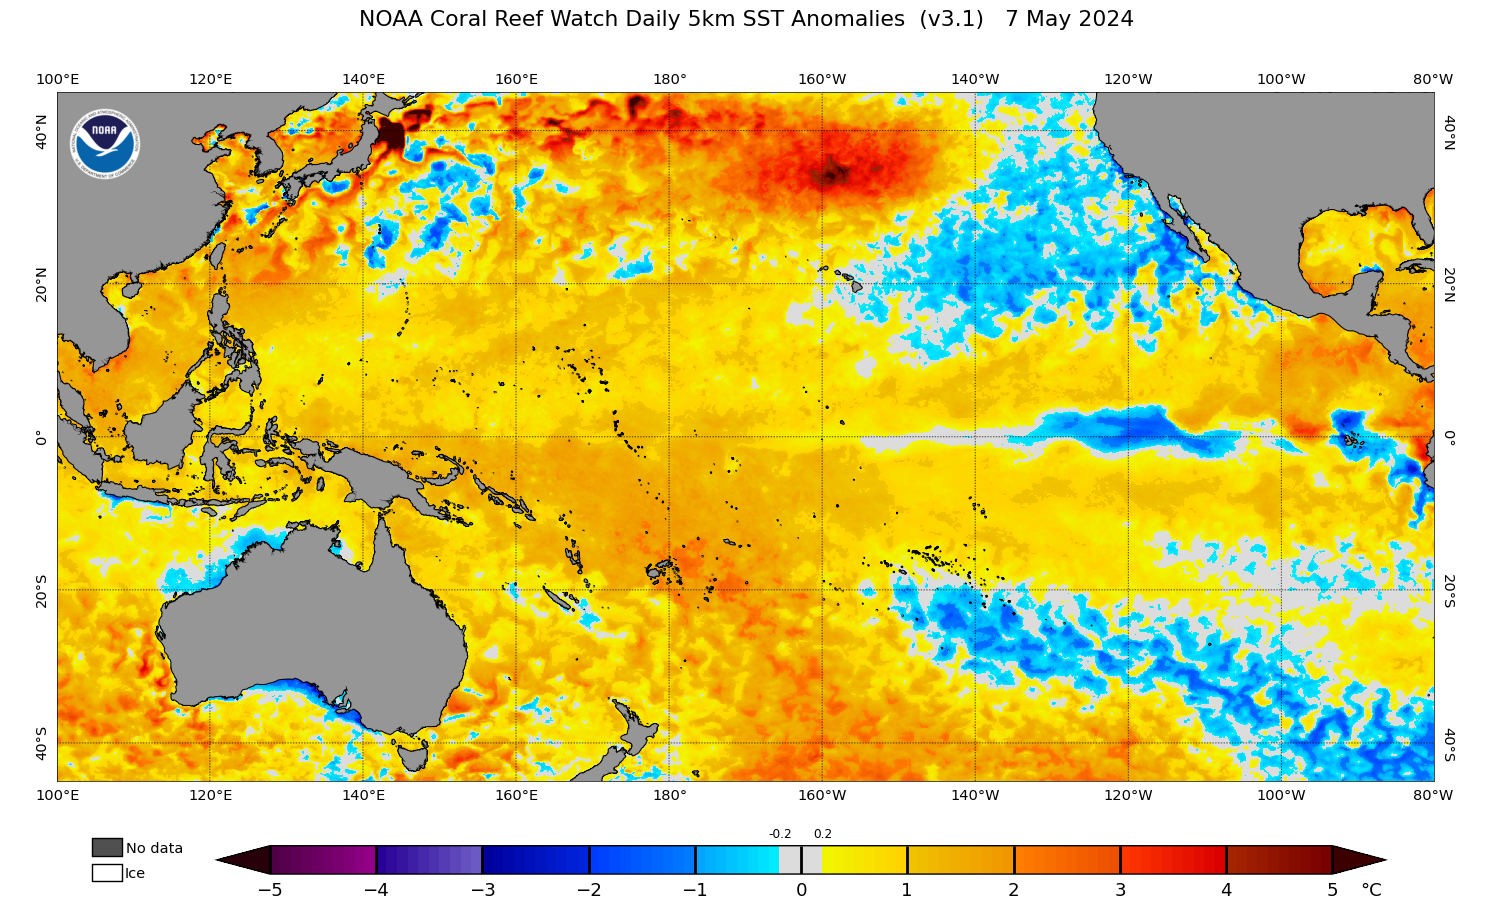
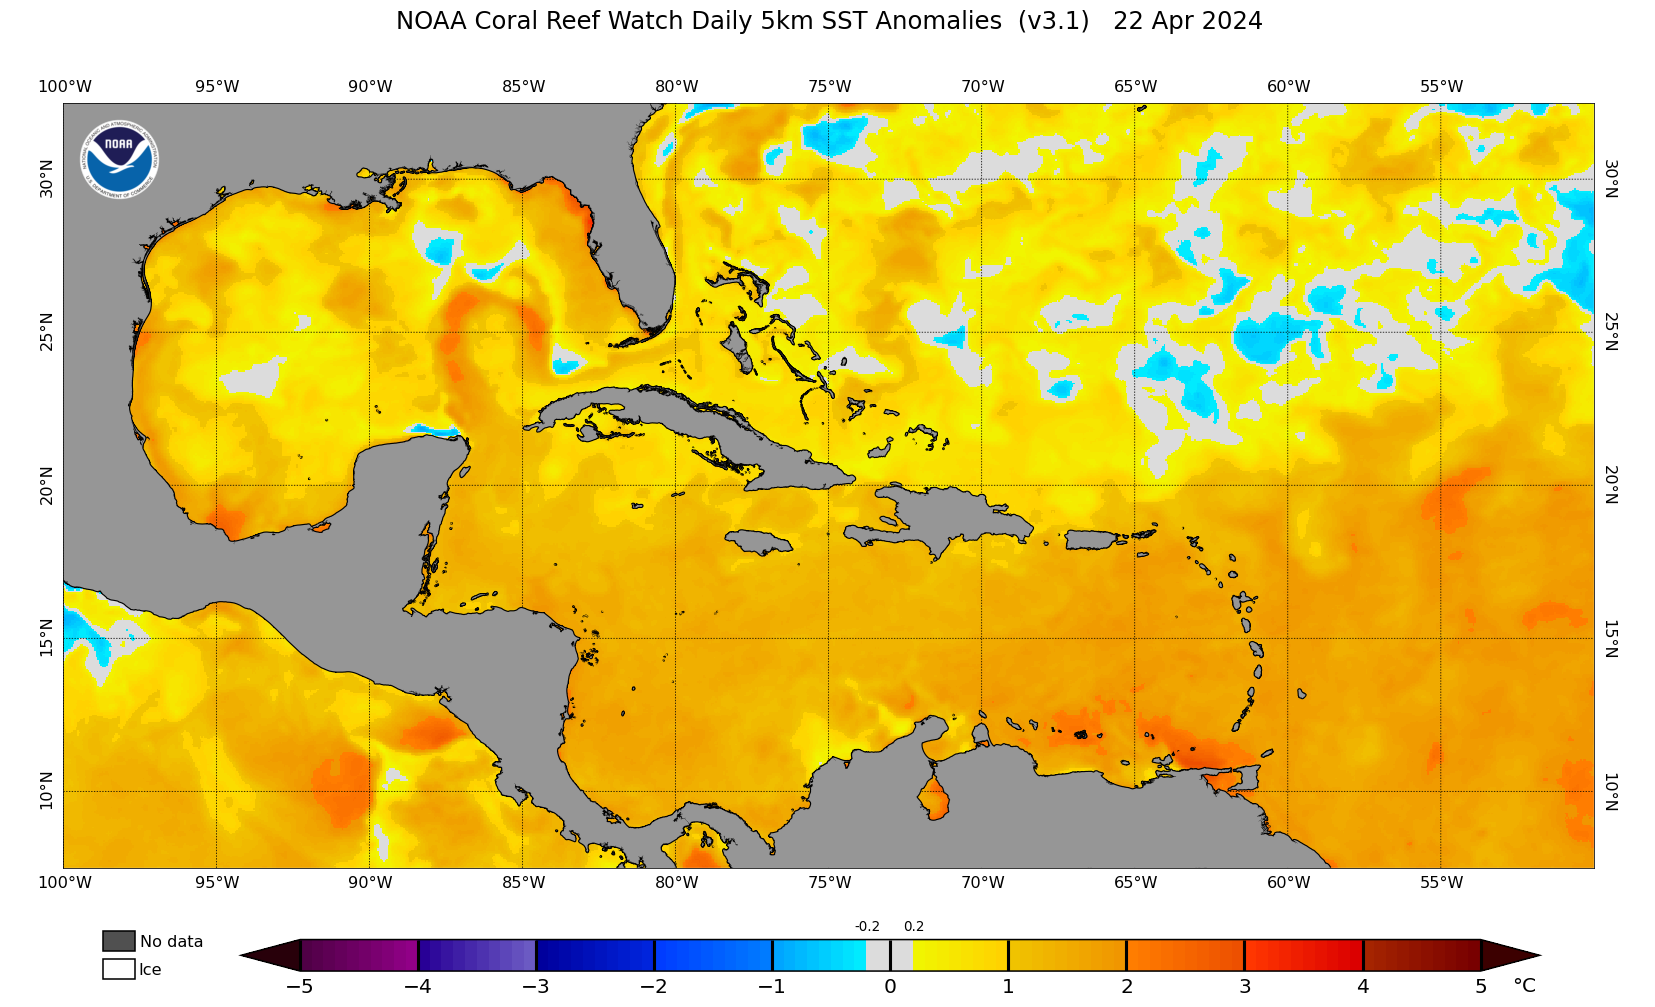
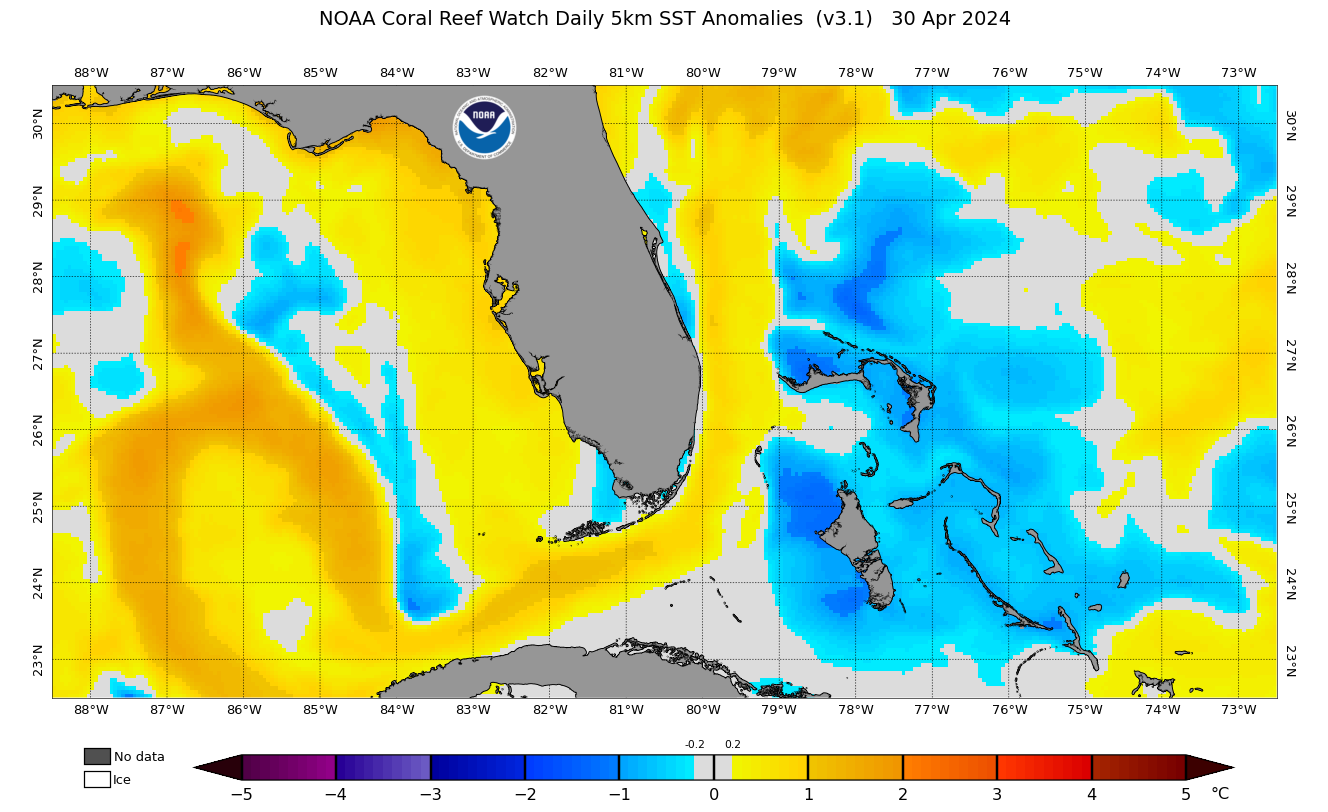
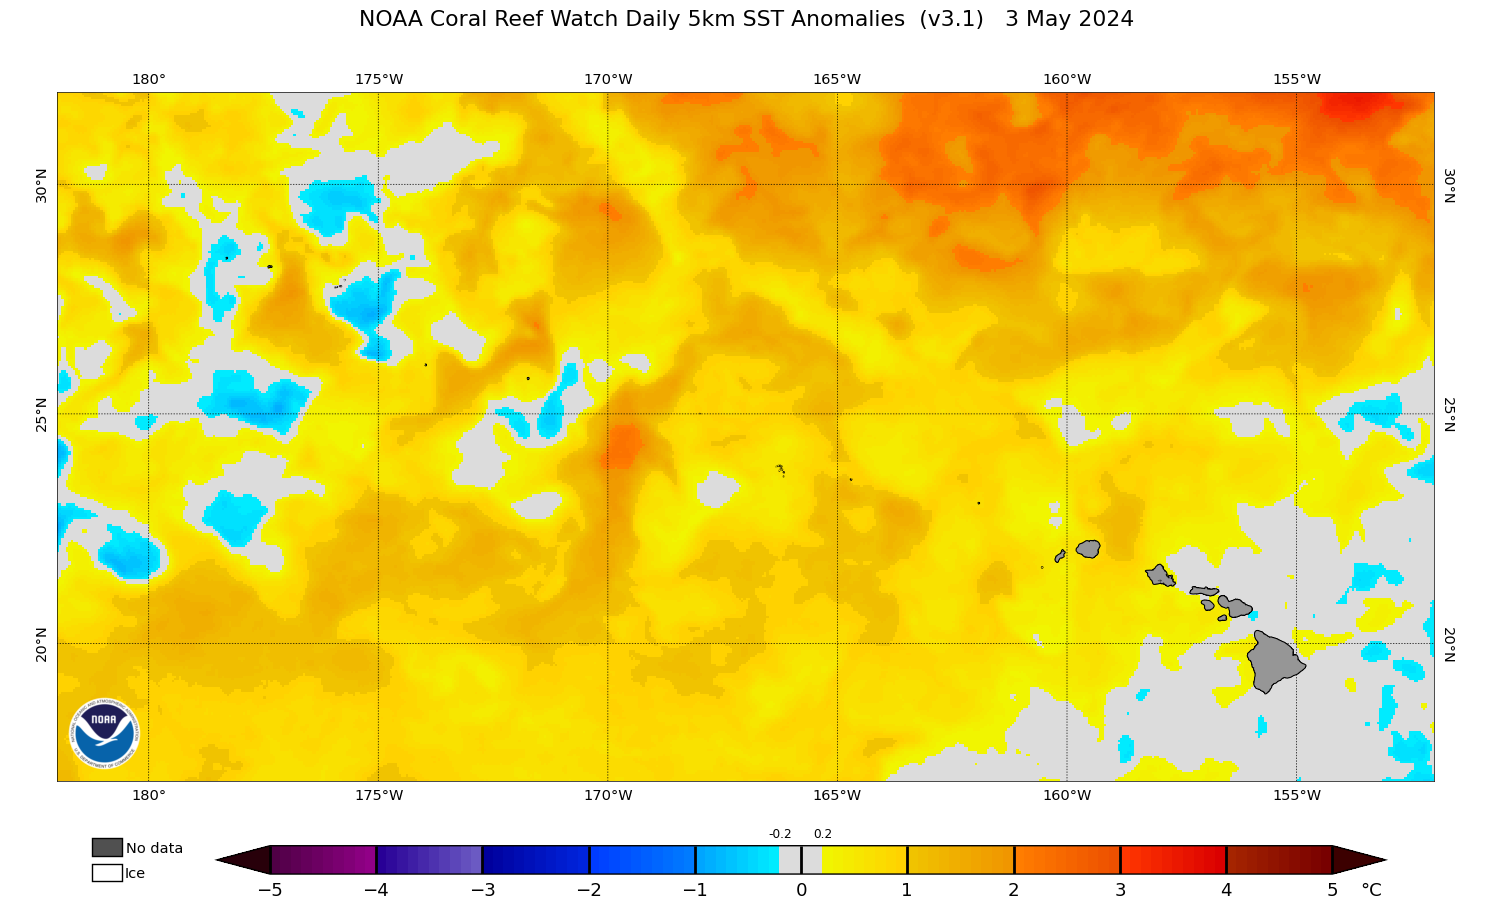
The NOAA Coral Reef Watch (CRW) daily global 5km Sea Surface Temperature
(SST) Anomaly product displays the difference between today's SST and the
long-term average. The scale ranges from -5 to +5 °C. Positive values
mean the temperature measured is warmer than average; negative values mean
cooler than average.
This product is updated each afternoon at about 13:30 U.S. Eastern Time.