
|

|
|
Per NWS Public Information Statement 26-05, effectively February 1, 2026, the Relative Oceanic Niño index (RONI) is used for official monitoring and prediction of the El Niño-Southern Oscillation (ENSO) phenomenon. See more details here.
Journal Article: A Relative Sea Surface Temperature Index for Classifying ENSO Events![]()
NOAA CPC's El Niño - Southern Oscillation (ENSO) resources webpage
The World Meteorological Organization (WMO)
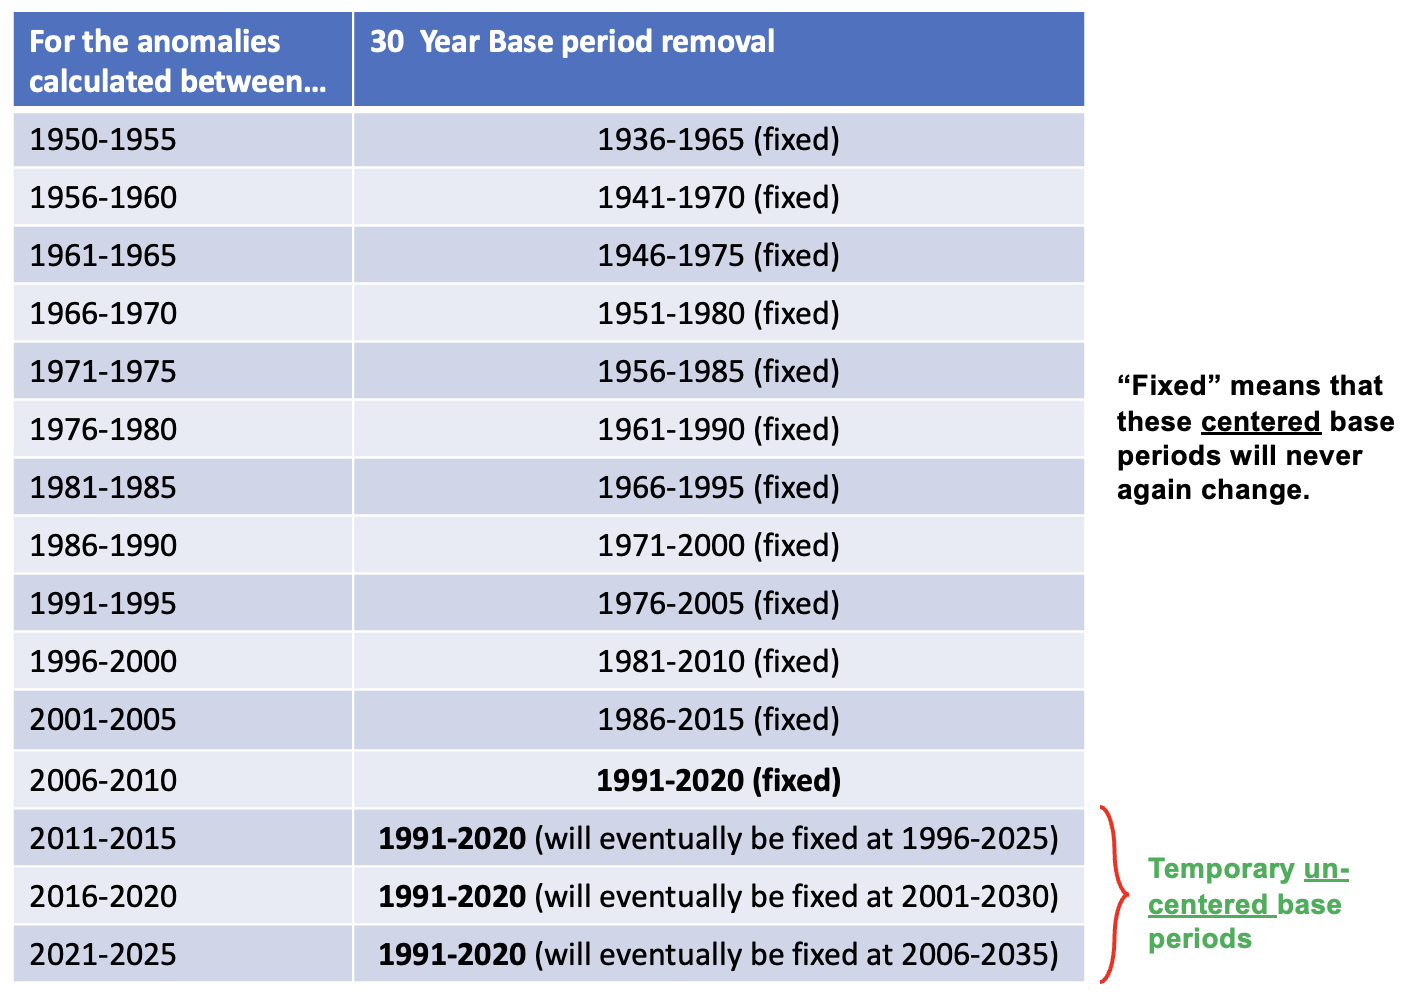
Climate Normals![]()
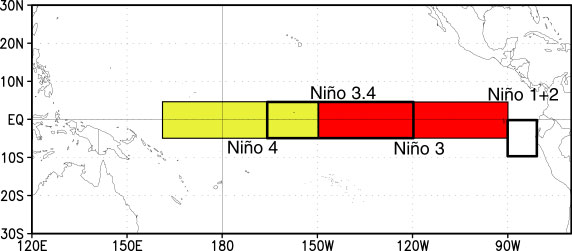
El Niño Regions:
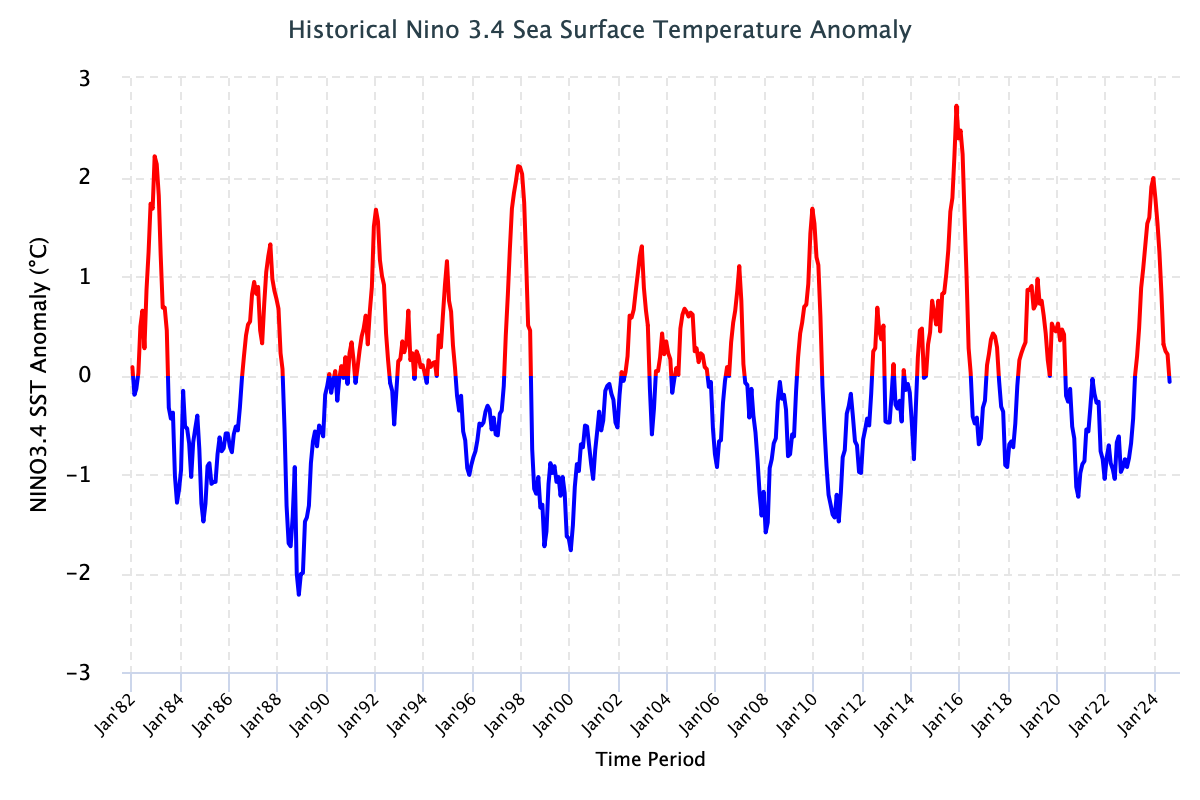
El Niño and La Niña events tend to develop during the period Apr-Jun and they
The spring predictability barrier: Forecasts made at some times of the year generally have higher skill than forecasts made at other times of the year -- namely, they are better when made between June and December than when they are made between February and May. This is a well-known challenge for forecaster and it can impact statistical models more than dynamical models.
The content posted on this web page solely represents the opinions of the authors and does not constitute a statement of policy, decision, or position on behalf of NOAA or the US Government.
The appearance of external links on this World Wide Web site does not constitute endorsement by the Department of Commerce/National Oceanic and Atmospheric Administration of external Web sites or the information, products or services contained therein. For other than authorized activities, the Department of Commerce/NOAA does not exercise any editorial control over the information you may find at these locations. These links are provided consistent with the stated purpose of this Department of Commerce/NOAA Web site.