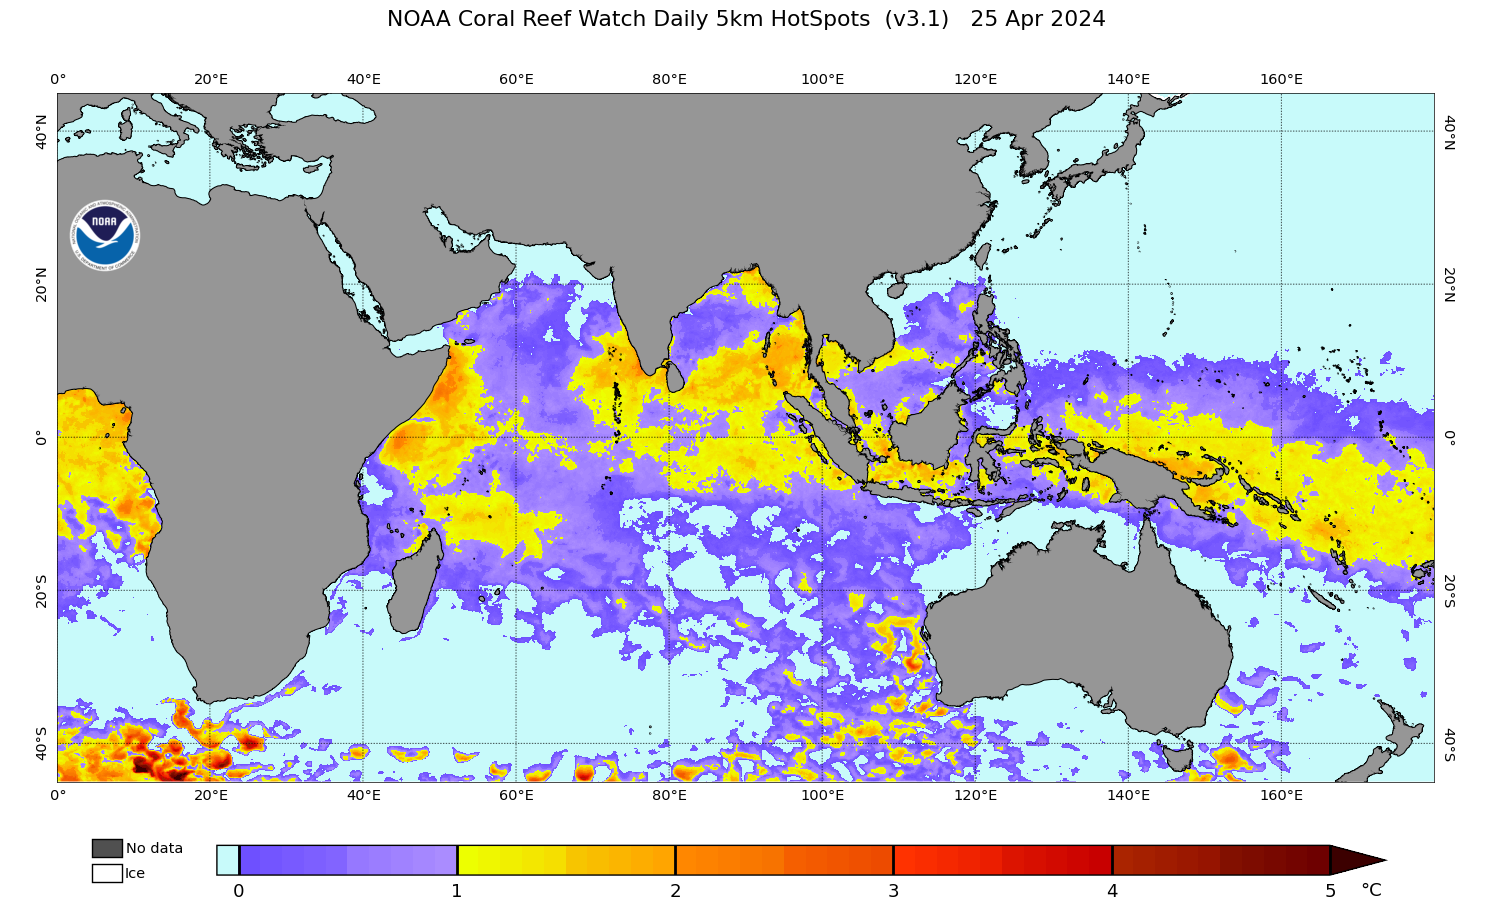
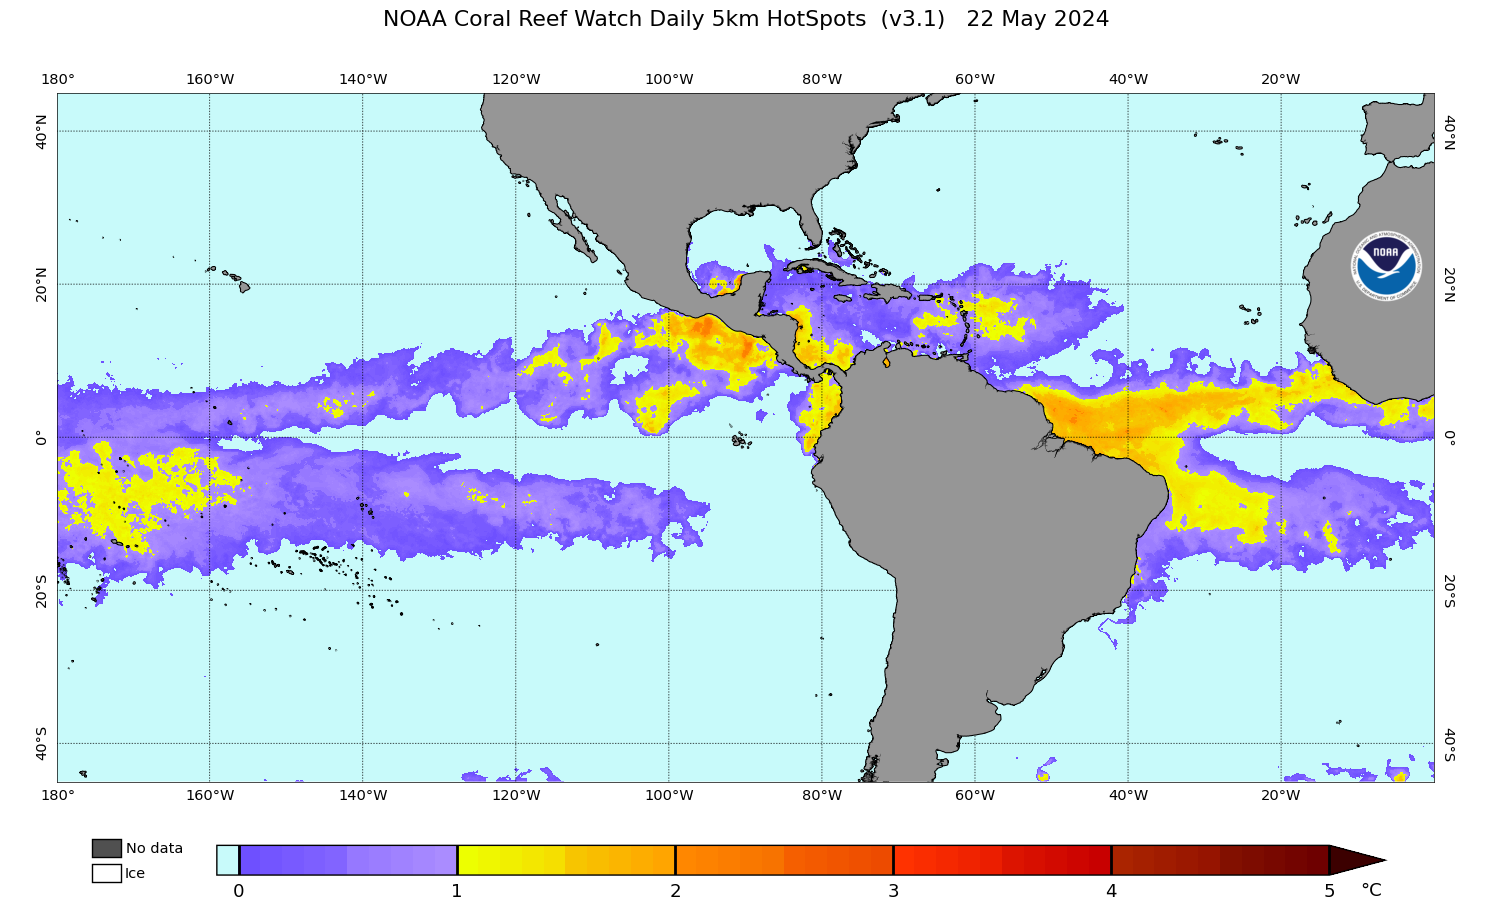
Click on map above to zoom to small 60 x 40-degree tiles; use drop-down menu below to view larger 60 x 40-degree tiles.
Right-click outside clickable map area to save the image.
60 x 40-degree tiles (by east/west hemispheres and low/high latitudes, updated daily)
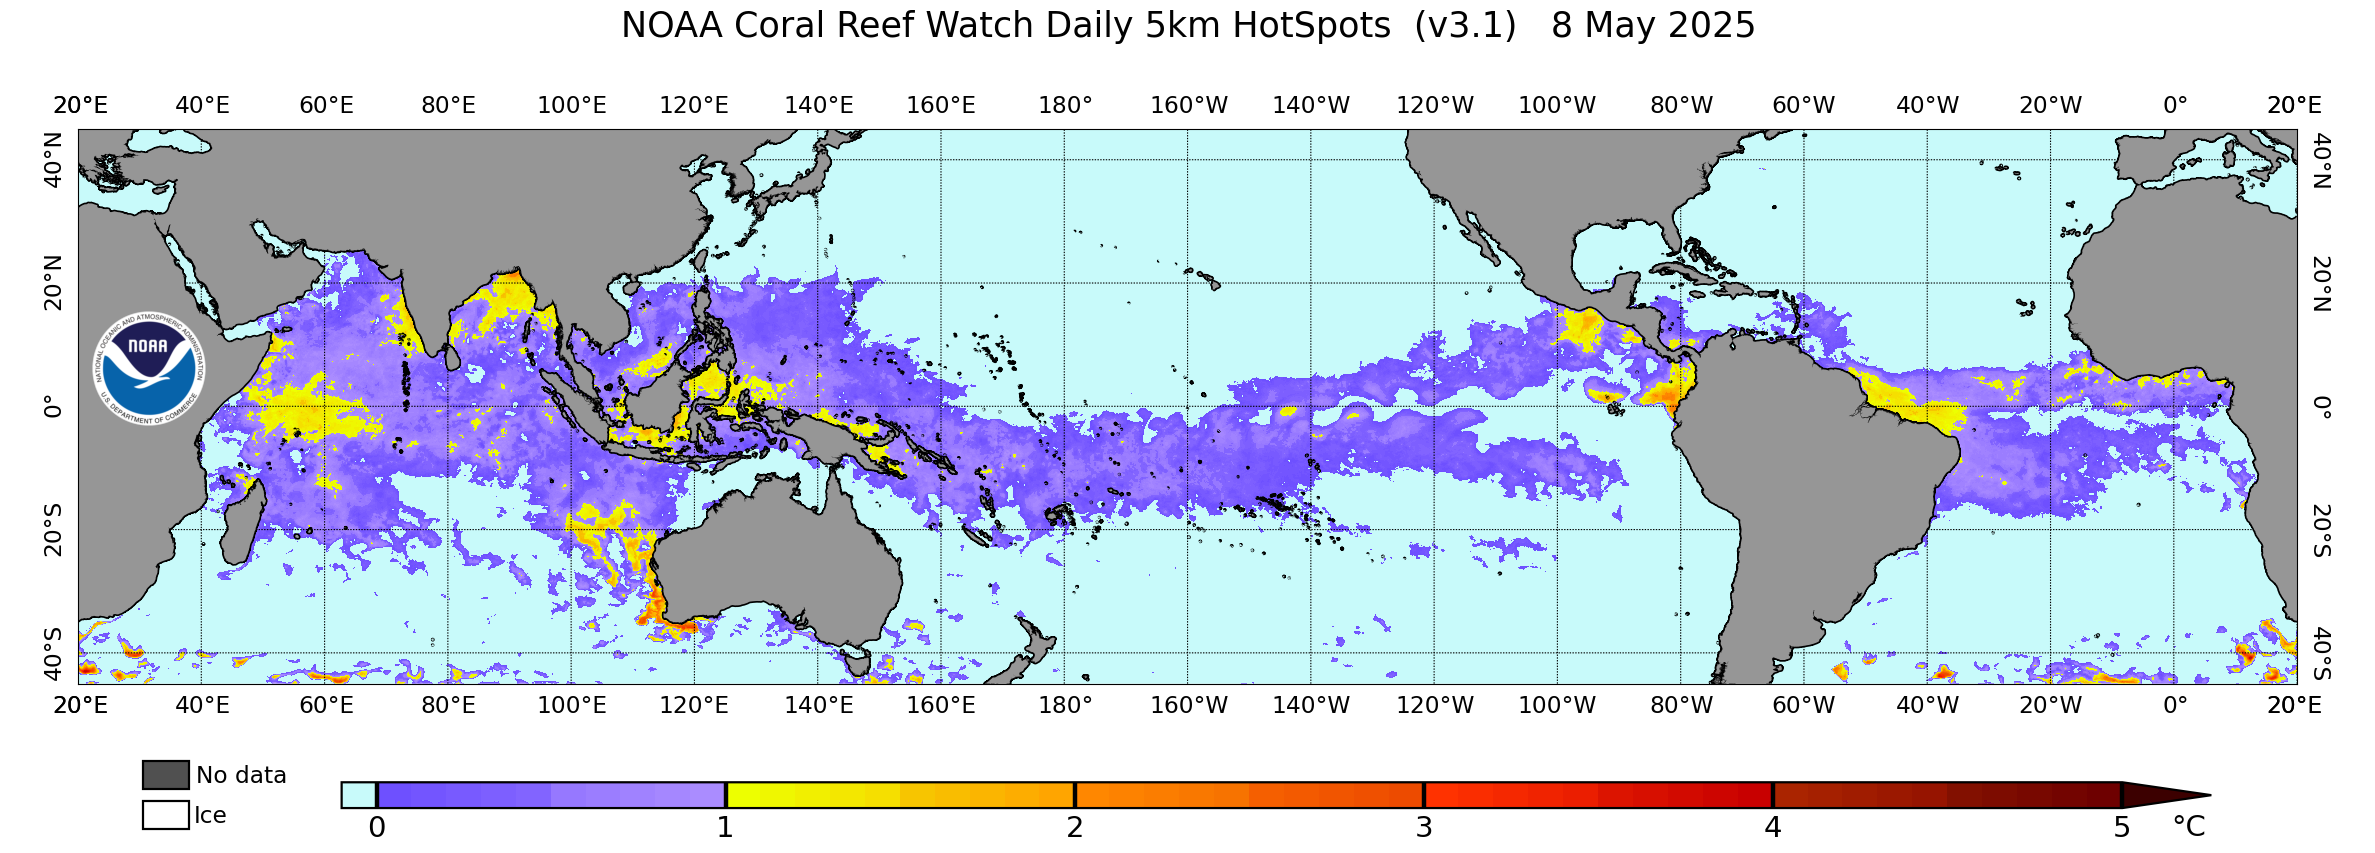
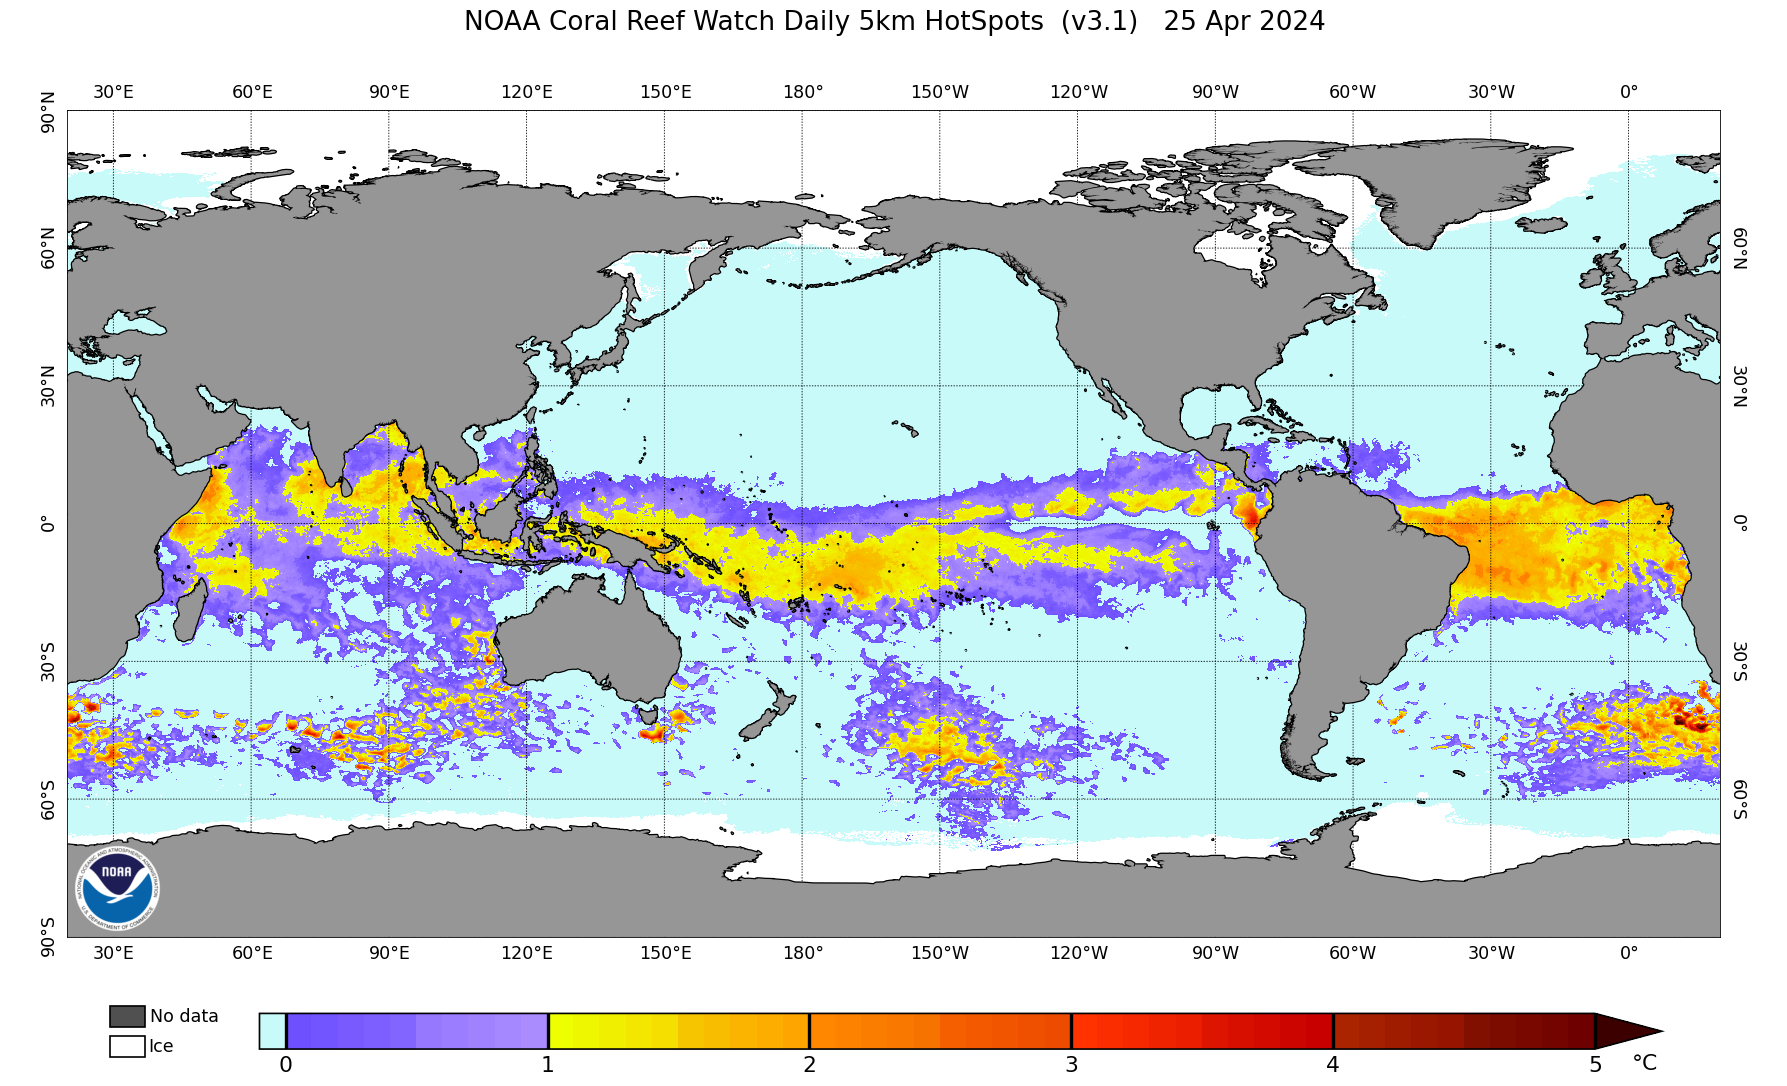
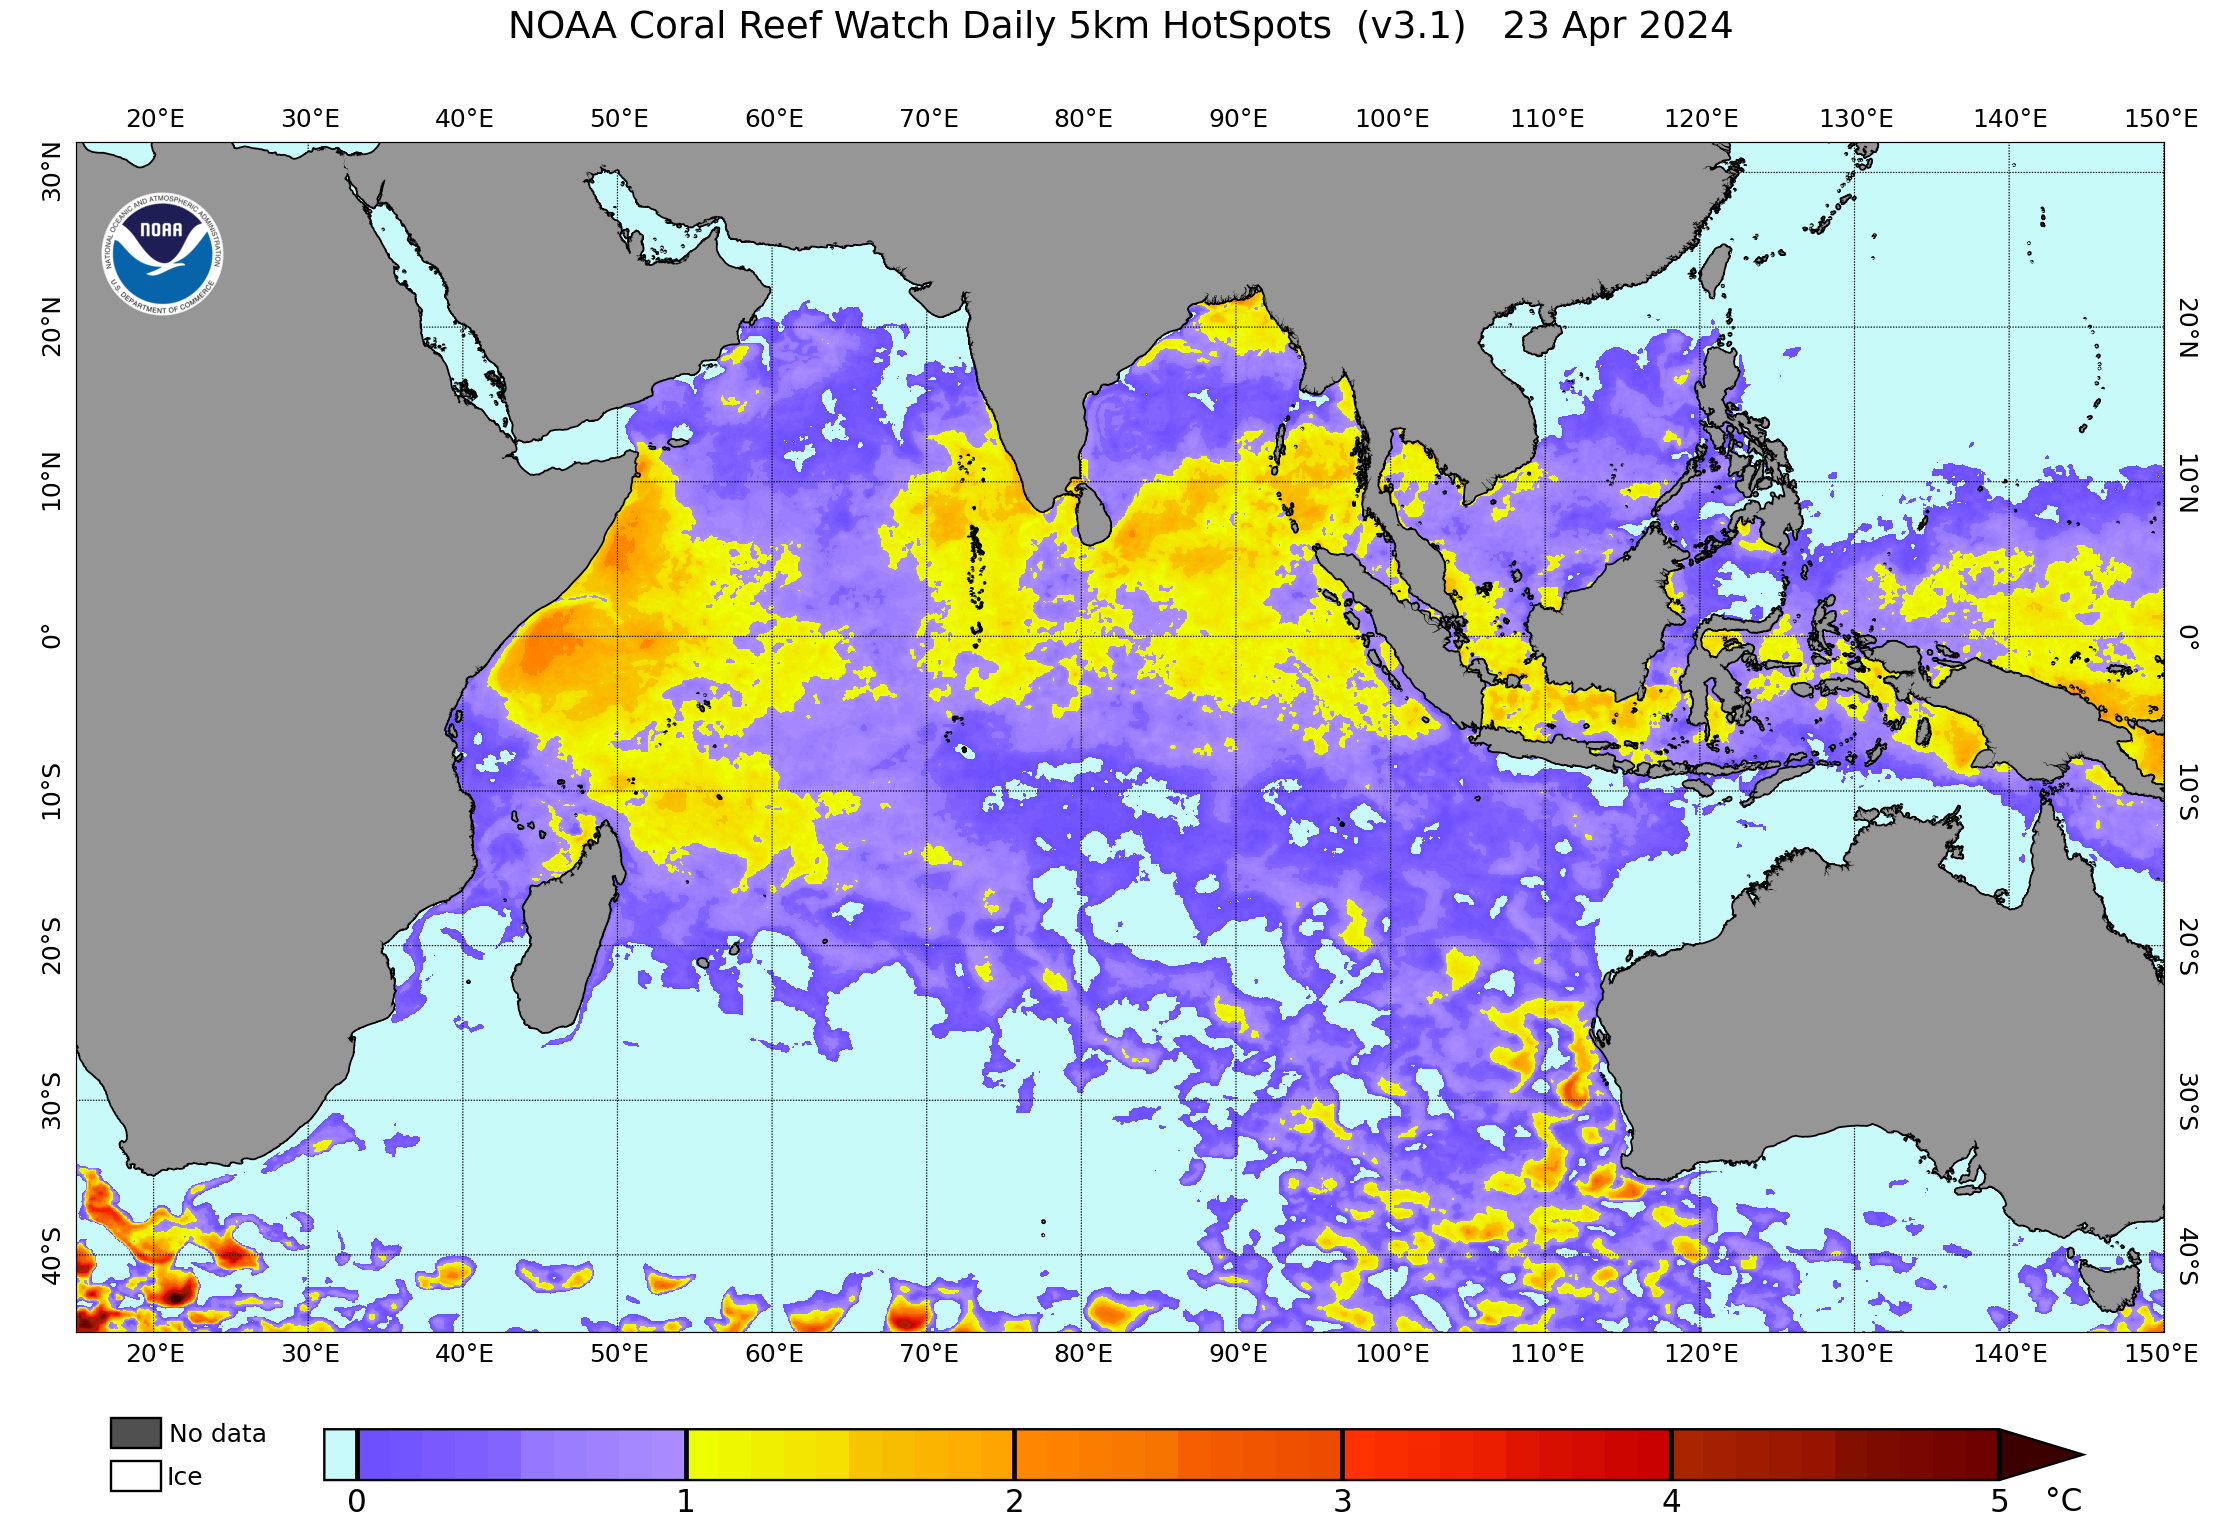
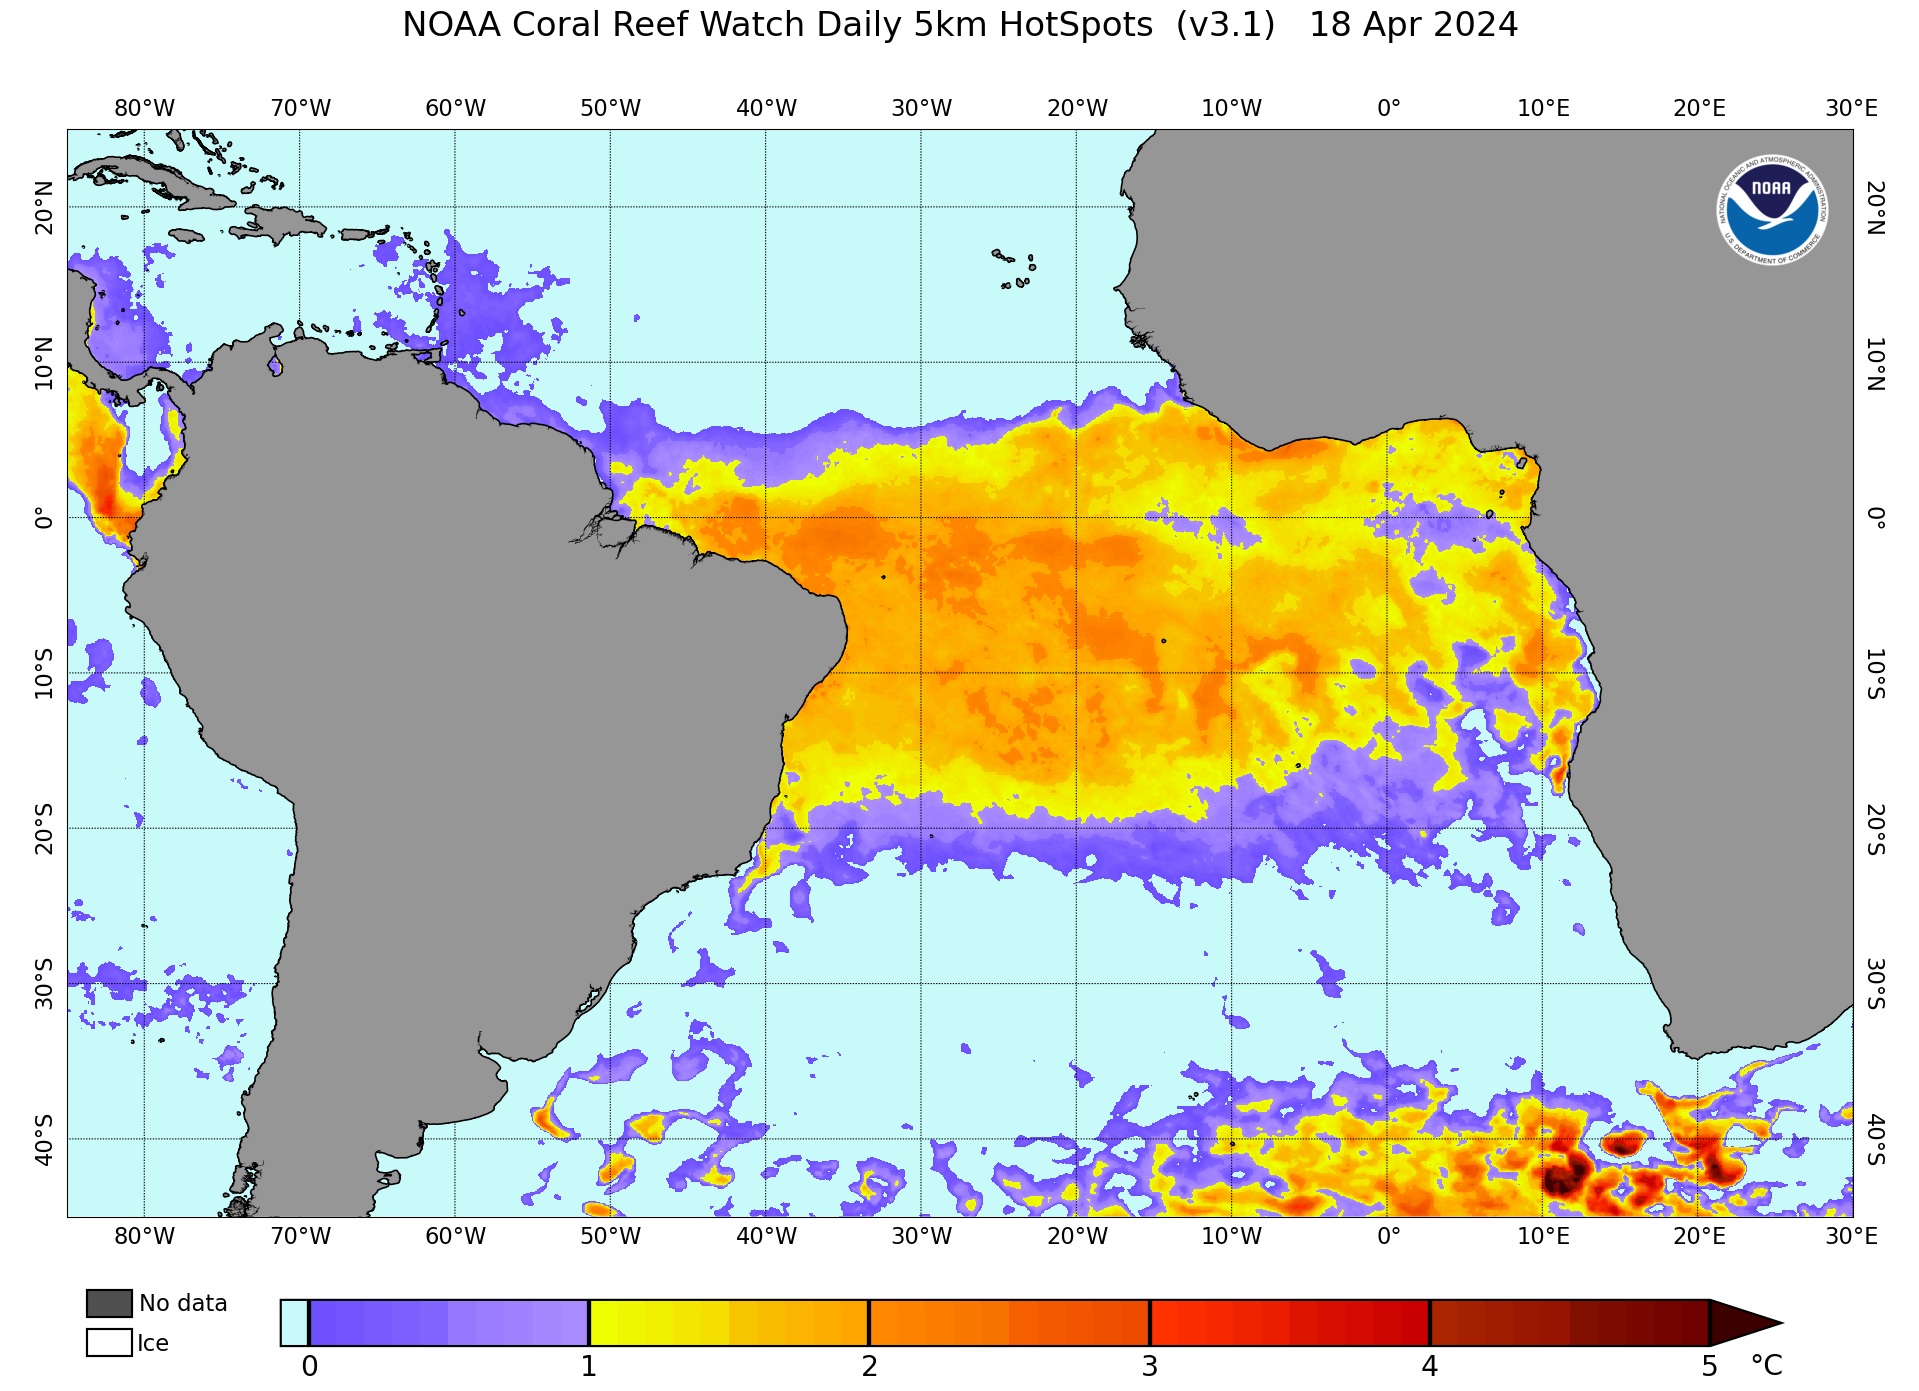
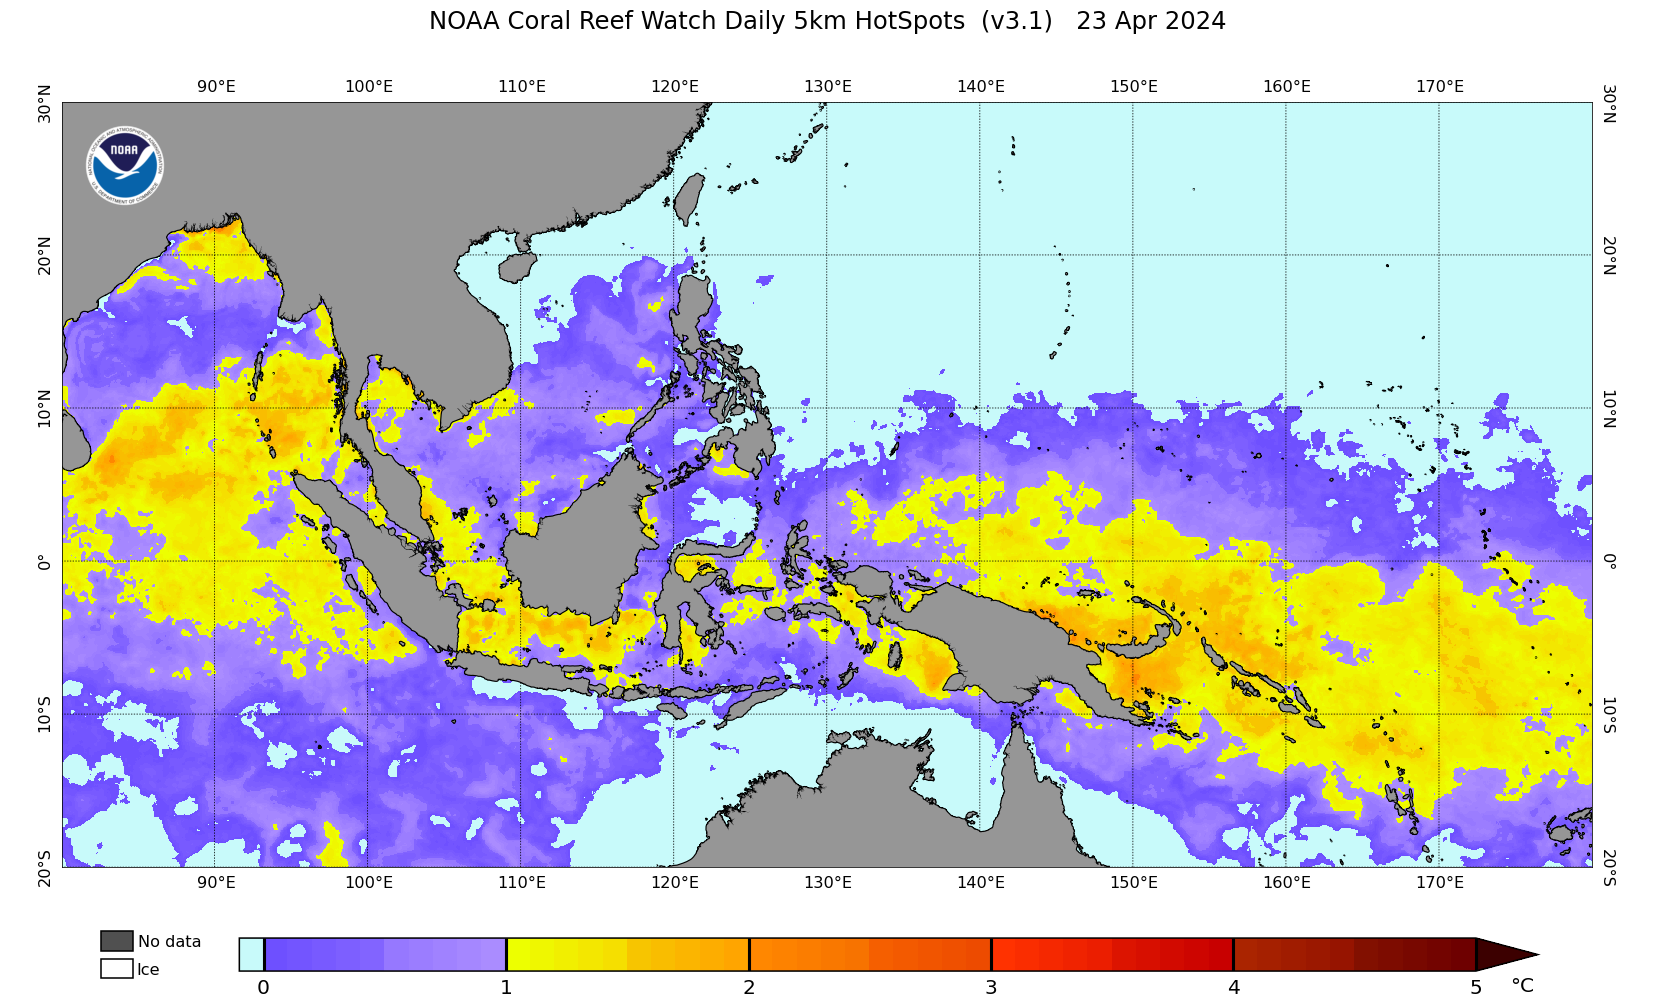
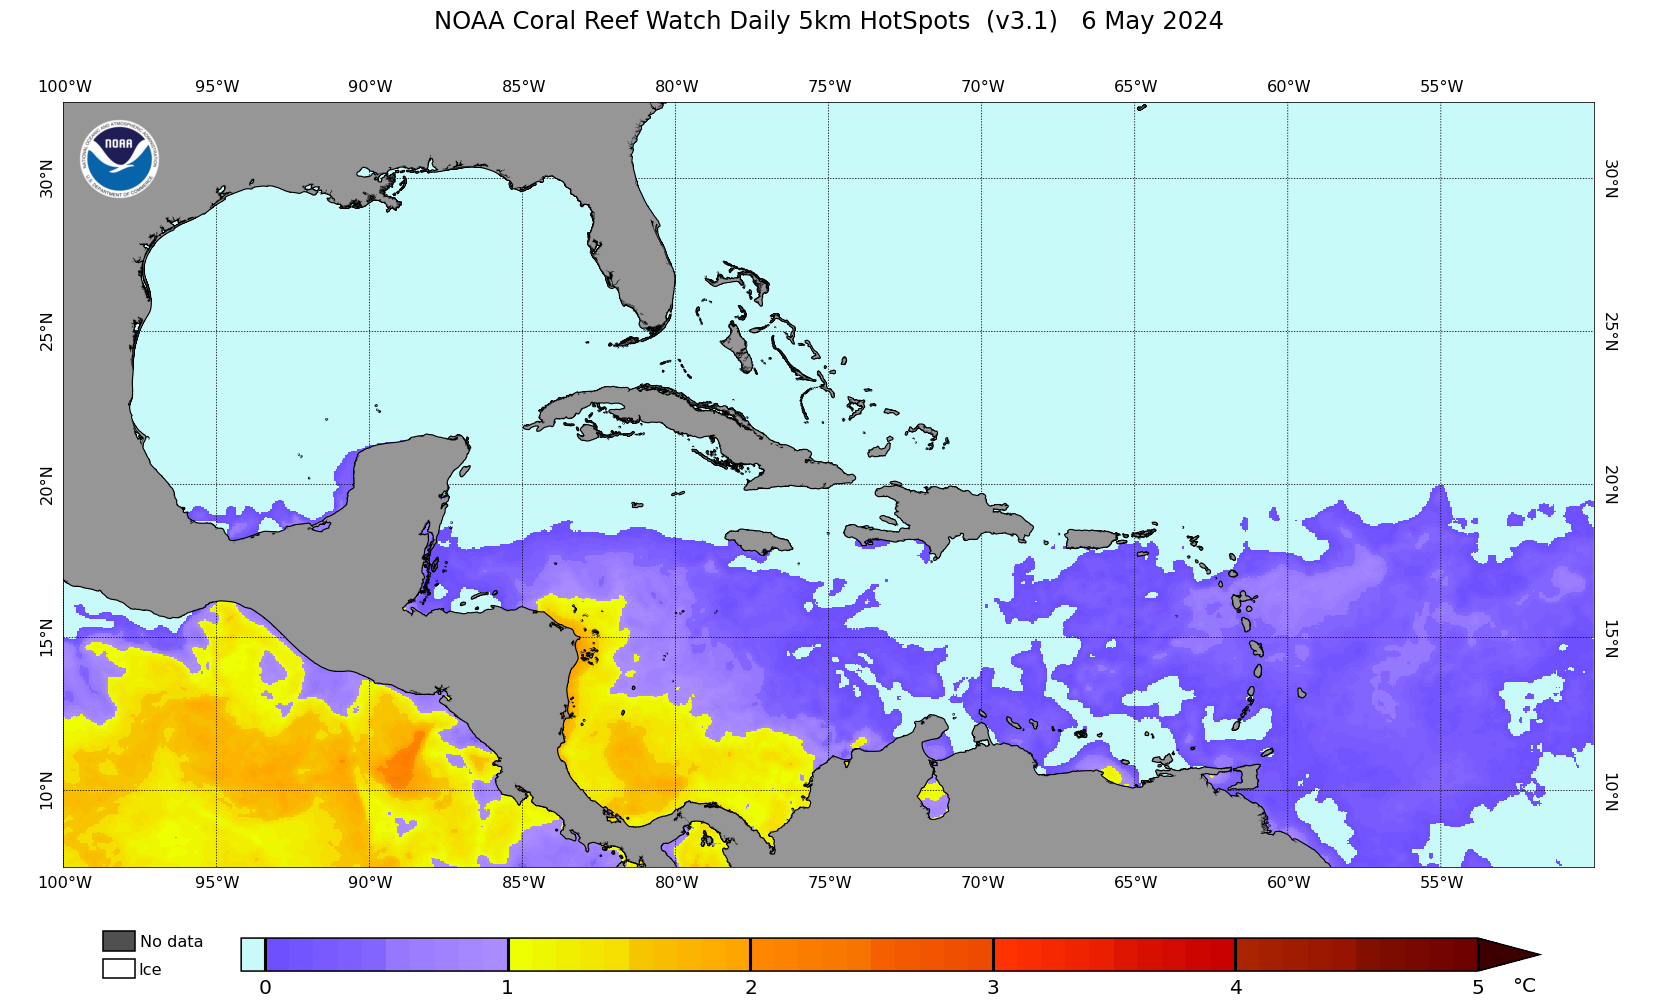
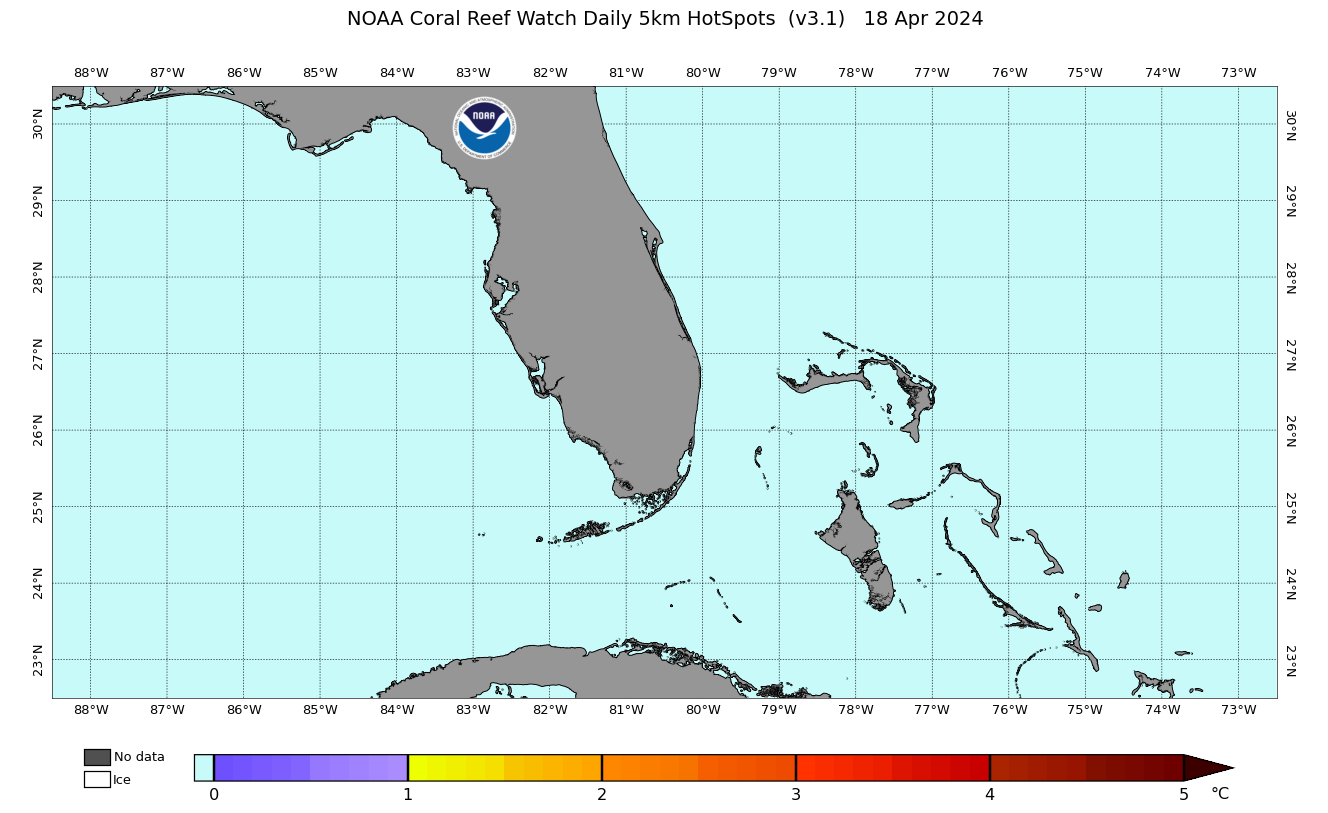
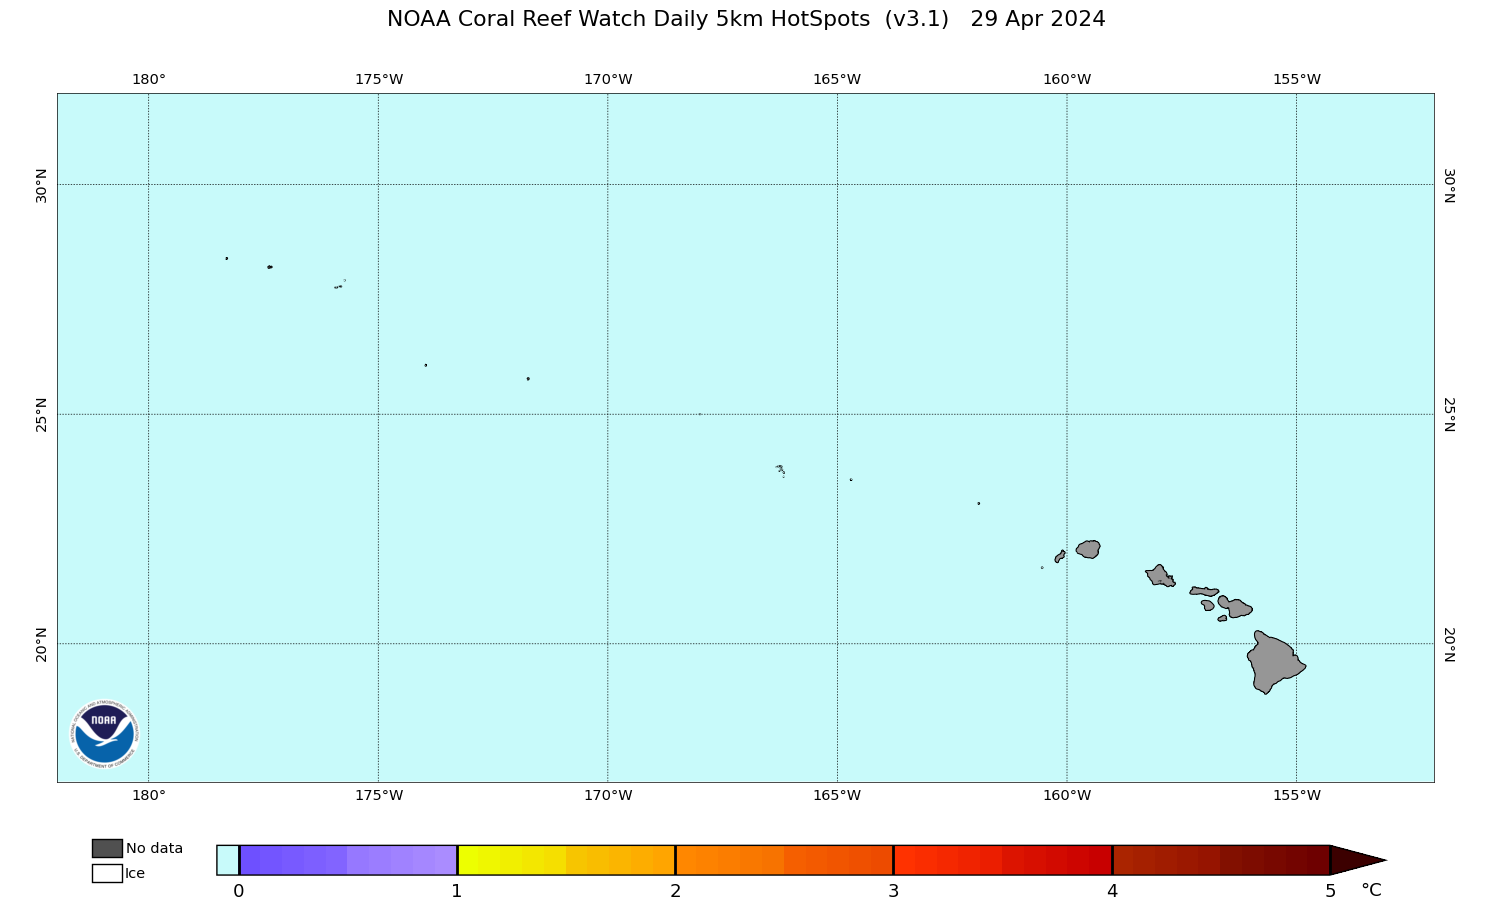
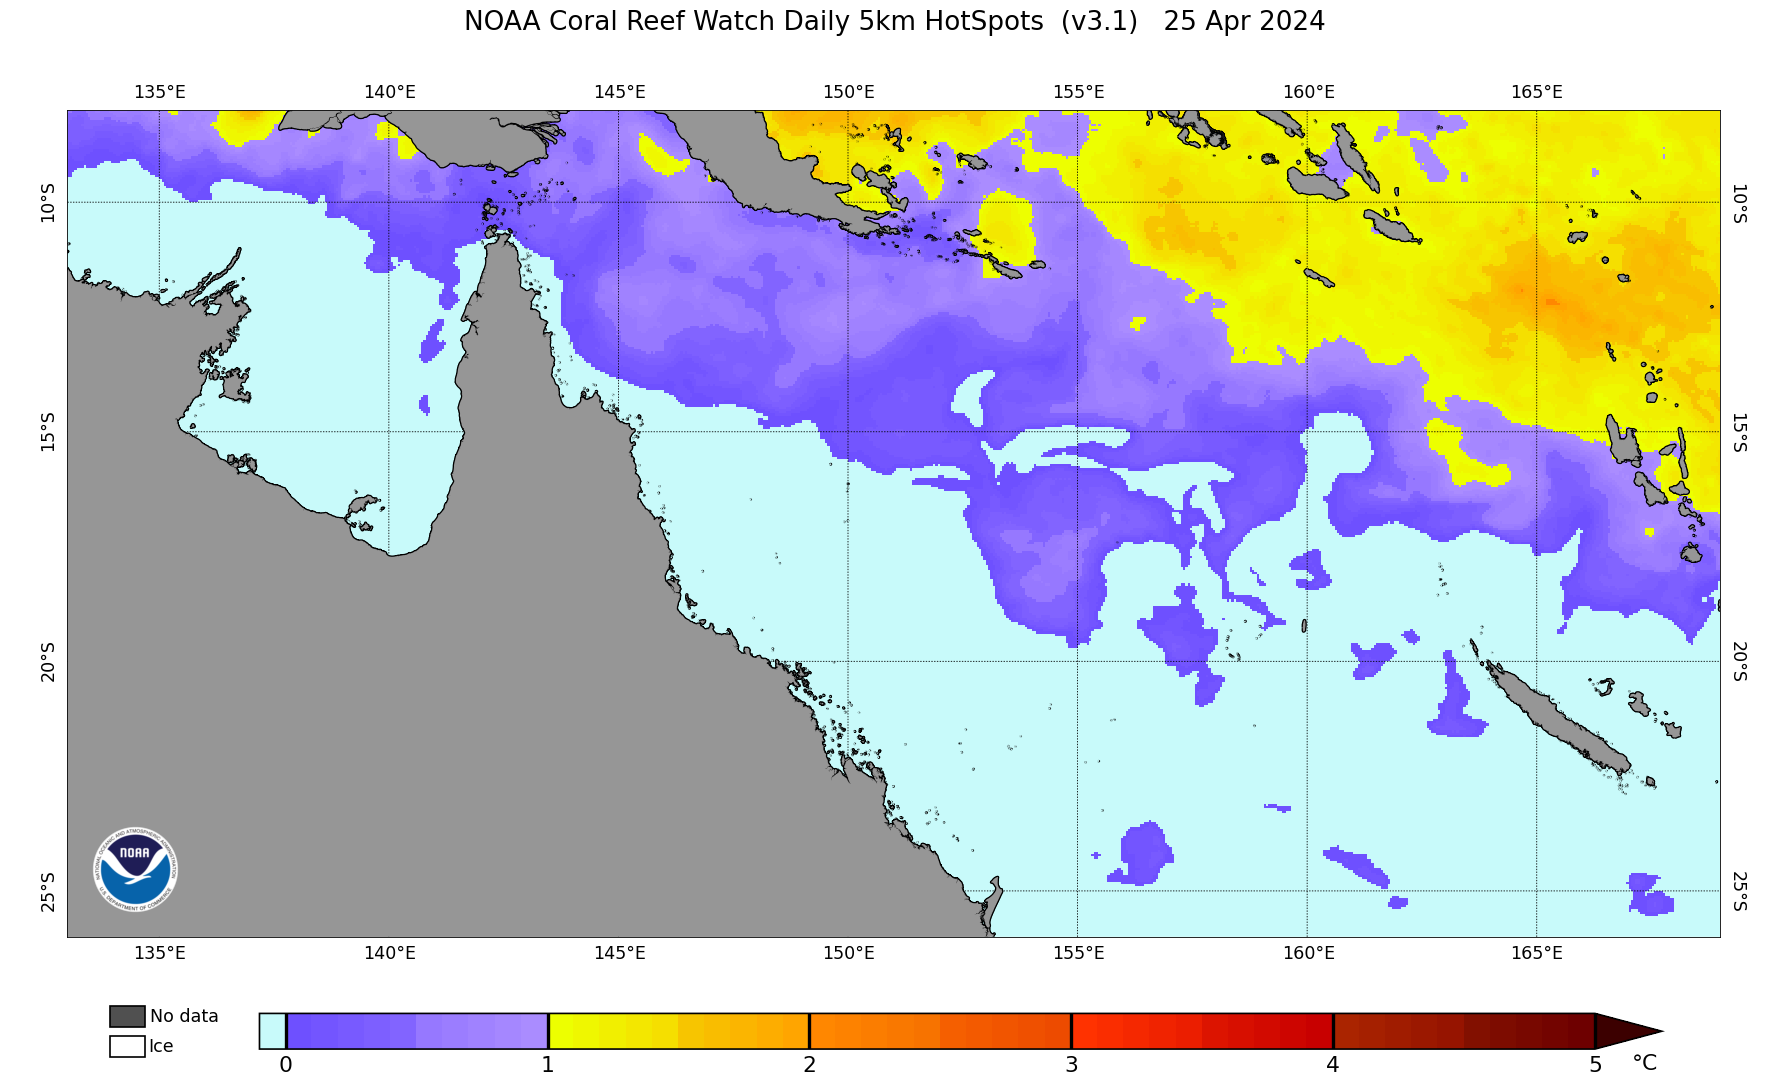
The NOAA Coral Reef Watch (CRW) daily global 5km Coral Bleaching HotSpot
product presented here measures the occurrence and magnitude of instantaneous heat stress,
potentially resulting in coral bleaching. The scale ranges from 0 to 5 °C. HotSpot values
of 1 °C or more indicate heat stress leading to coral bleaching and are highlighted in
yellow to dark red/brown colors.
This product is updated each afternoon at about 13:30 U.S. Eastern Time.