


(Version 3.1, released July 31, 2019, experimental product)
|
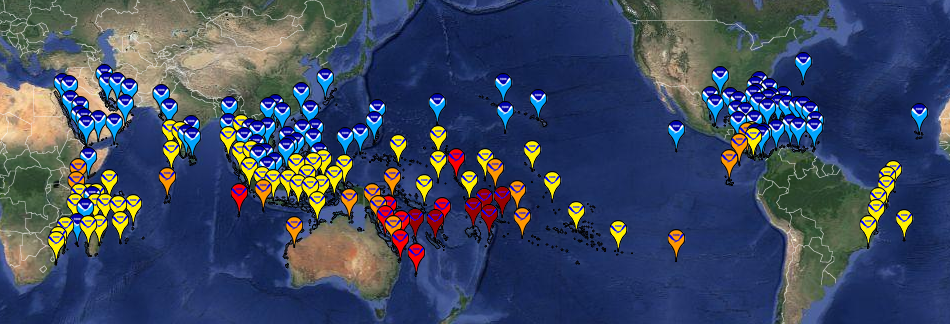
| Click on map or select a region to zoom in: |
|
|


NOAA Coral Reef Watch (CRW) has developed a set of experimental daily 5km Regional Virtual Stations (219 total). The Regional Virtual Stations represent a change in the way we have looked at Virtual Station data in the past. They have been designed to take advantage of higher-resolution data while simultaneously providing comprehensive and collective information on all reefs in a jurisdiction or predetermined sub-region. We realized early on that data from a single 5km pixel (satellite data grid point) provide much higher spatial detail but are less representative of a region's thermal conditions. Also, many coral reef ecosystem managers wanted to know what was happening across their entire jurisdiction. Rather than constructing Virtual Stations based on single 5km pixels as we did in our heritage 50km Virtual Stations, we created Regional Virtual Stations based on data from all of the 5km grids within each individual jurisdiction (e.g., Main Hawaiian Islands). An alert for a region is meant to inform users that they should look at the map products for more detail. These Regional Virtual Stations will be used in a series of our products including:
- Regional Bleaching Heat Stress Gauges
- Two-year time series graphics
- Multi-year time series graphics
- Virtual Stations map with data overlays in a Google Maps interface
- Virtual Stations map with data overlays in a Google Earth file
- Email Bleaching Alerts (one alert per region, sent out twice-weekly, free to subscribers)
As CRW's daily 5km Regional Virtual Stations product provides regional statistical analyses of heat stress, not information for individual satellite data grids, the daily global 5km Coral Bleaching Alert Area (7-day maximum), Degree Heating Week, and Coral Bleaching HotSpot values for a Regional Virtual Station, on a single date, may not match the definitions provided in 5km Bleaching Alert Area coral bleaching heat stress levels table. These definitions do hold, however, for each individual data grid within a Regional Virtual Station on a single date.
Data for these will use the warmest 10% of the pixels in the predetermined region to determine thermal conditions (No
Stress, Bleaching Watch, Bleaching Warning, Alert Level 1, and Alert Level 2) and the values presented in the time series.
For example, if 5% of the pixels for Vanuatu have reached Alert Level 2 and 8% have reached Alert Level 1, the status
for Vanuatu will be Alert Level 1. This methodology also prevents a few stray warm pixels from exaggerating bleaching risk.
However, we realize our approach has its costs as well. Some of the pros and cons we have identified in the switch to 5km
Regional Virtual Stations are:
Pros of Regional Virtual Stations:
- Utilization of higher resolution data
- Quick guidance for an entire jurisdiction or sub-region
- Better sense of regional impacts
Cons of Regional Virtual Stations:
- Lower geographic specificity for individual islands and reefs
- Less information on patterns within jurisdictions or sub-regions
However, as the alerts are meant to draw users to the maps, we think this will still provide the spatial pattern
of the heat stress - now at 5km resolution.
NOAA CRW also expanded the geographic network of the daily 5km Regional Virtual Stations to include all coral reefs around the world, based on
available references. These included the Millennium Coral Reef project maps,
the IUCN Coral Reefs of the World three-volume set, the UNEP/WCMC World Atlas of Coral Reefs,
several country scale atlas publications, and a few other resources. These references also were used to develop the outline
(in black) for each new 5km Regional Virtual Station. Each Station outline is based on a global 5km reef pixel mask
developed by NOAA CRW, with the addition of a 20km buffer around each 5km reef mask. If we have missed a coral reef that
you know of, please let us know the name and coordinates of the missing reef.
We do plan to produce an extensive set of Virtual Stations to represent single reefs using one to a few 5km pixels. This is
a major undertaking that we are planning as a next phase of our implementation. However, this list of potentially more than a thousand
Virtual Stations will be rather unwieldy for many users. We also may provide products that allow users to better query individual or
groups of pixels. For now, that is best done using the netCDF files we have released for our 5km products.
These will be fully compatible with the NOAA CoastWatch Data Analysis Tool (CDAT) available from our website, ArcGIS, and many other tools.
We encourage you to look over these daily 5km Regional Virtual Stations and send us your comments at
coralreefwatch@noaa.gov.

