Click on map above to zoom to small 60 x 40-degree tiles; use drop-down menu below to view larger 60 x 40-degree tiles.
Right-click outside clickable map area to save the image.
60 x 40-degree tiles (by east/west hemispheres and low/high latitudes, updated daily)
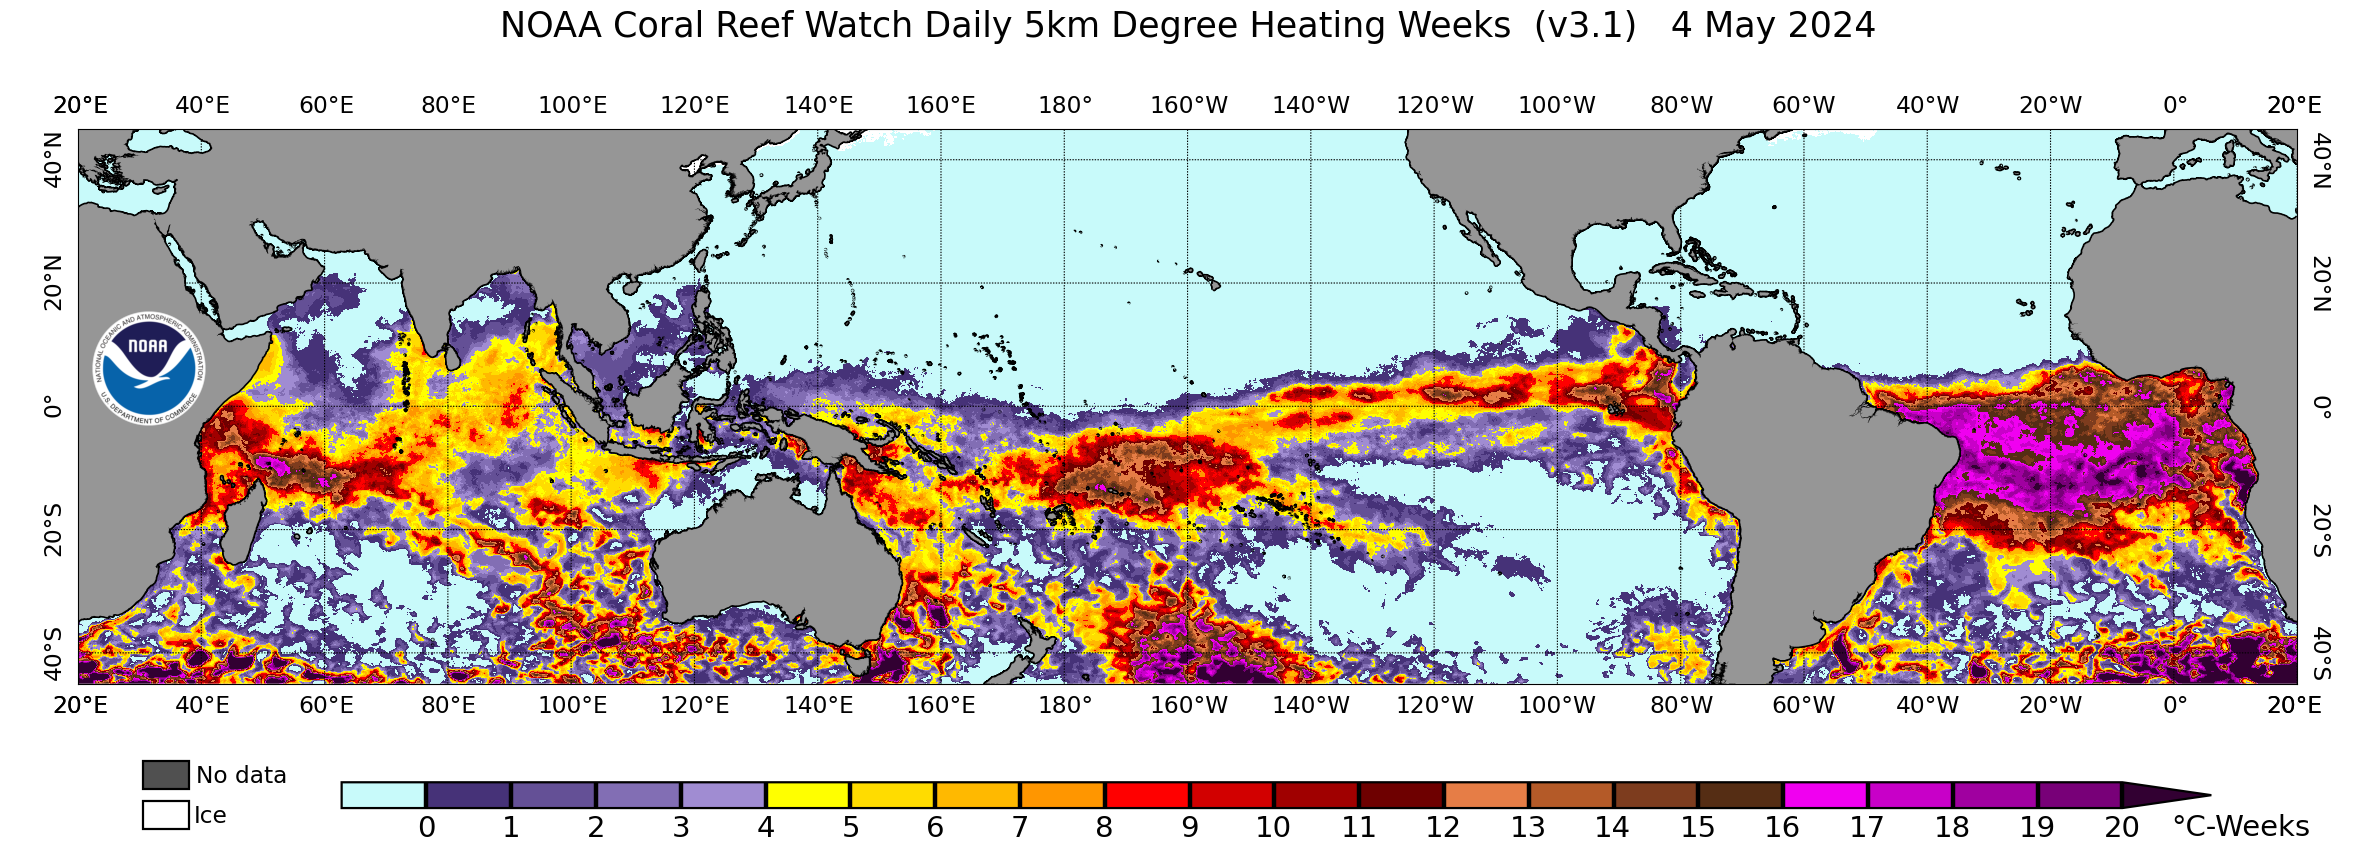
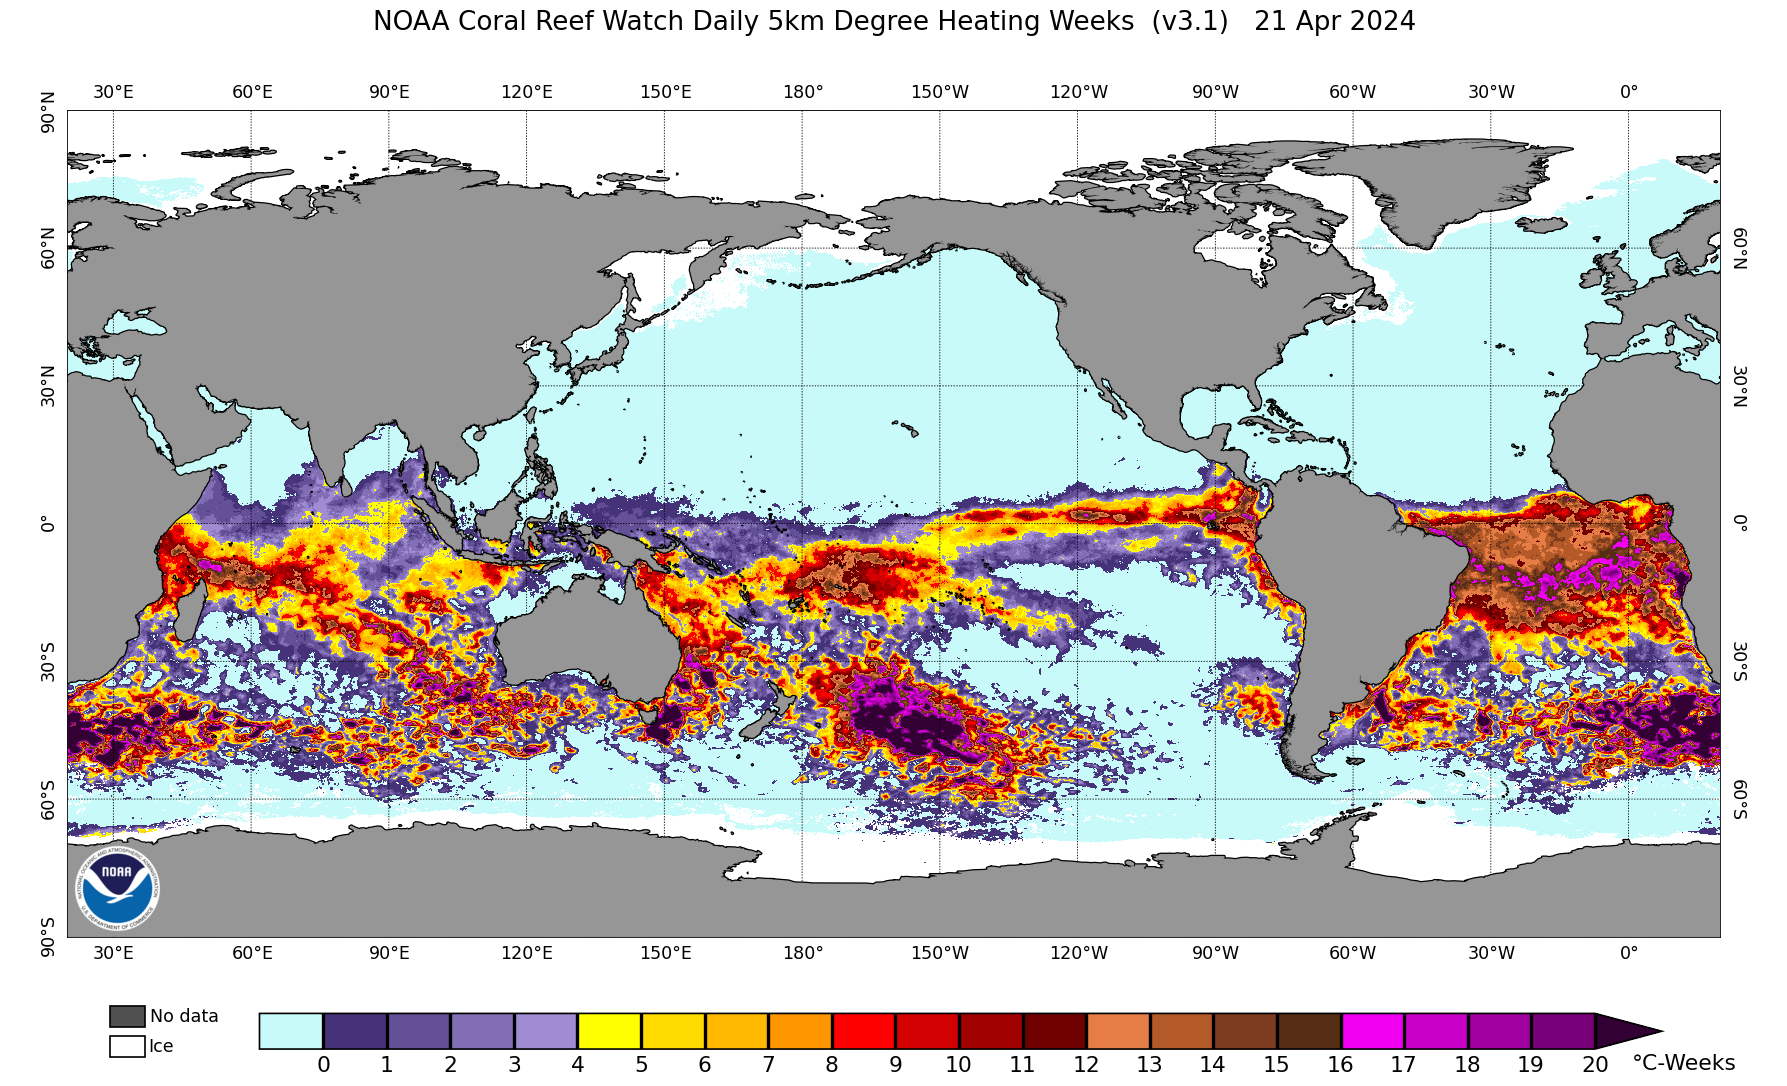
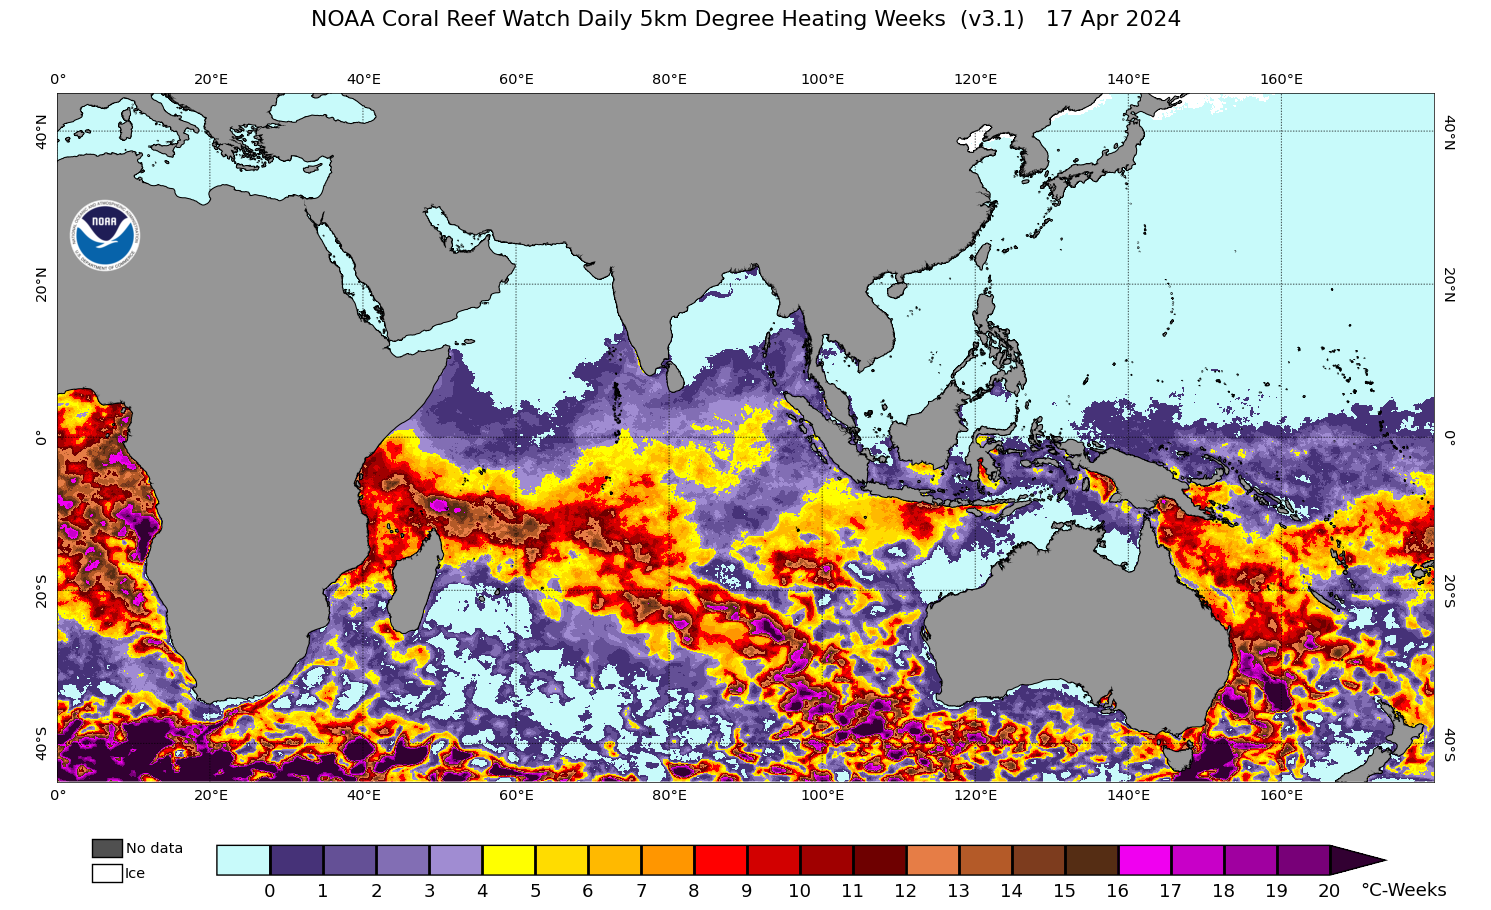
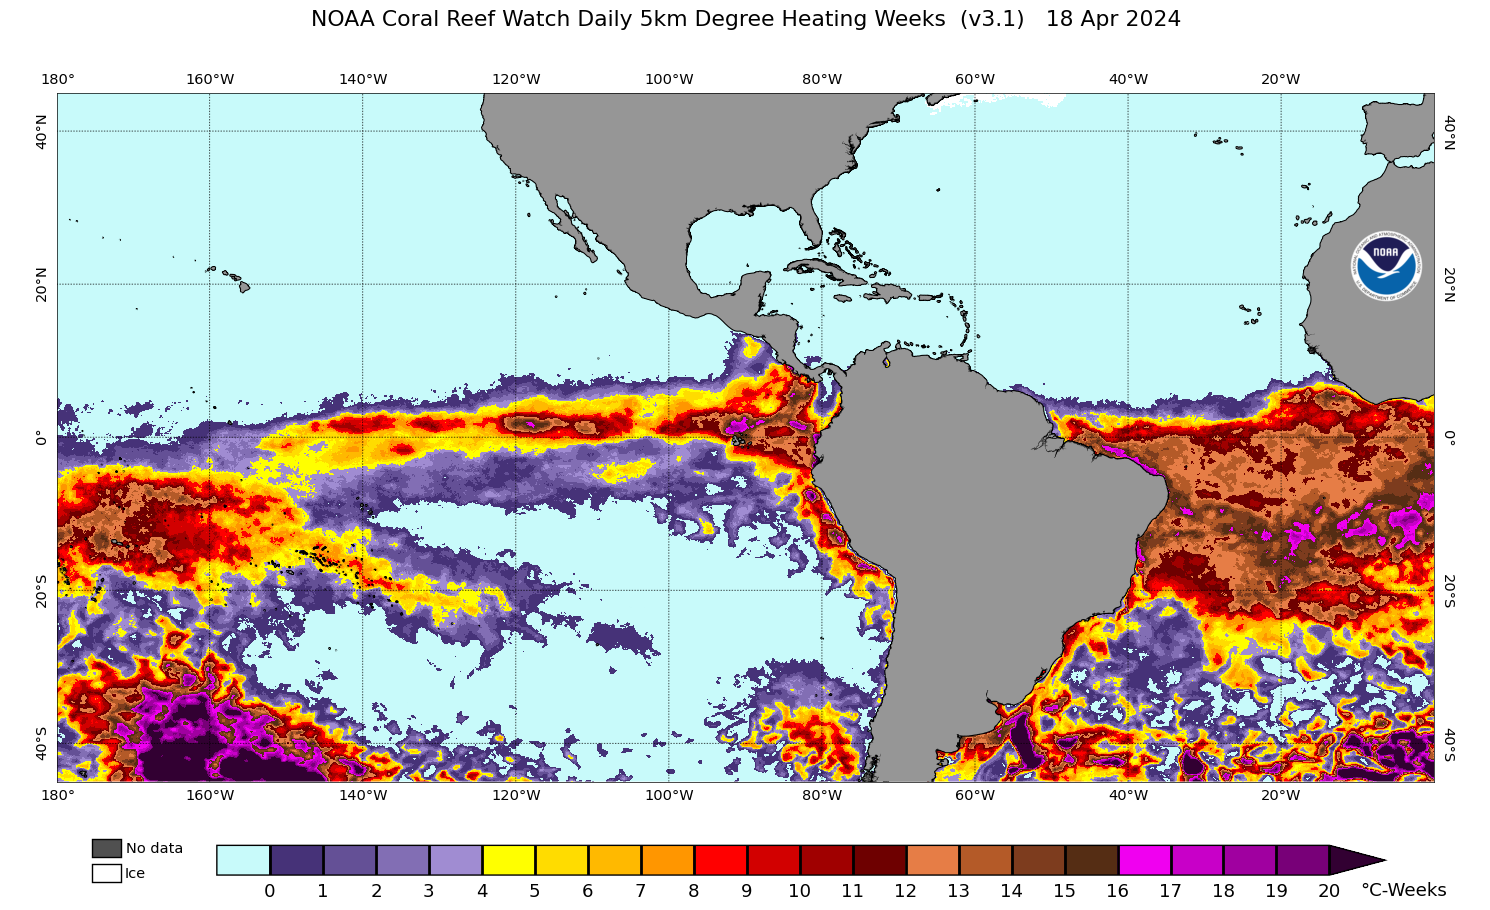
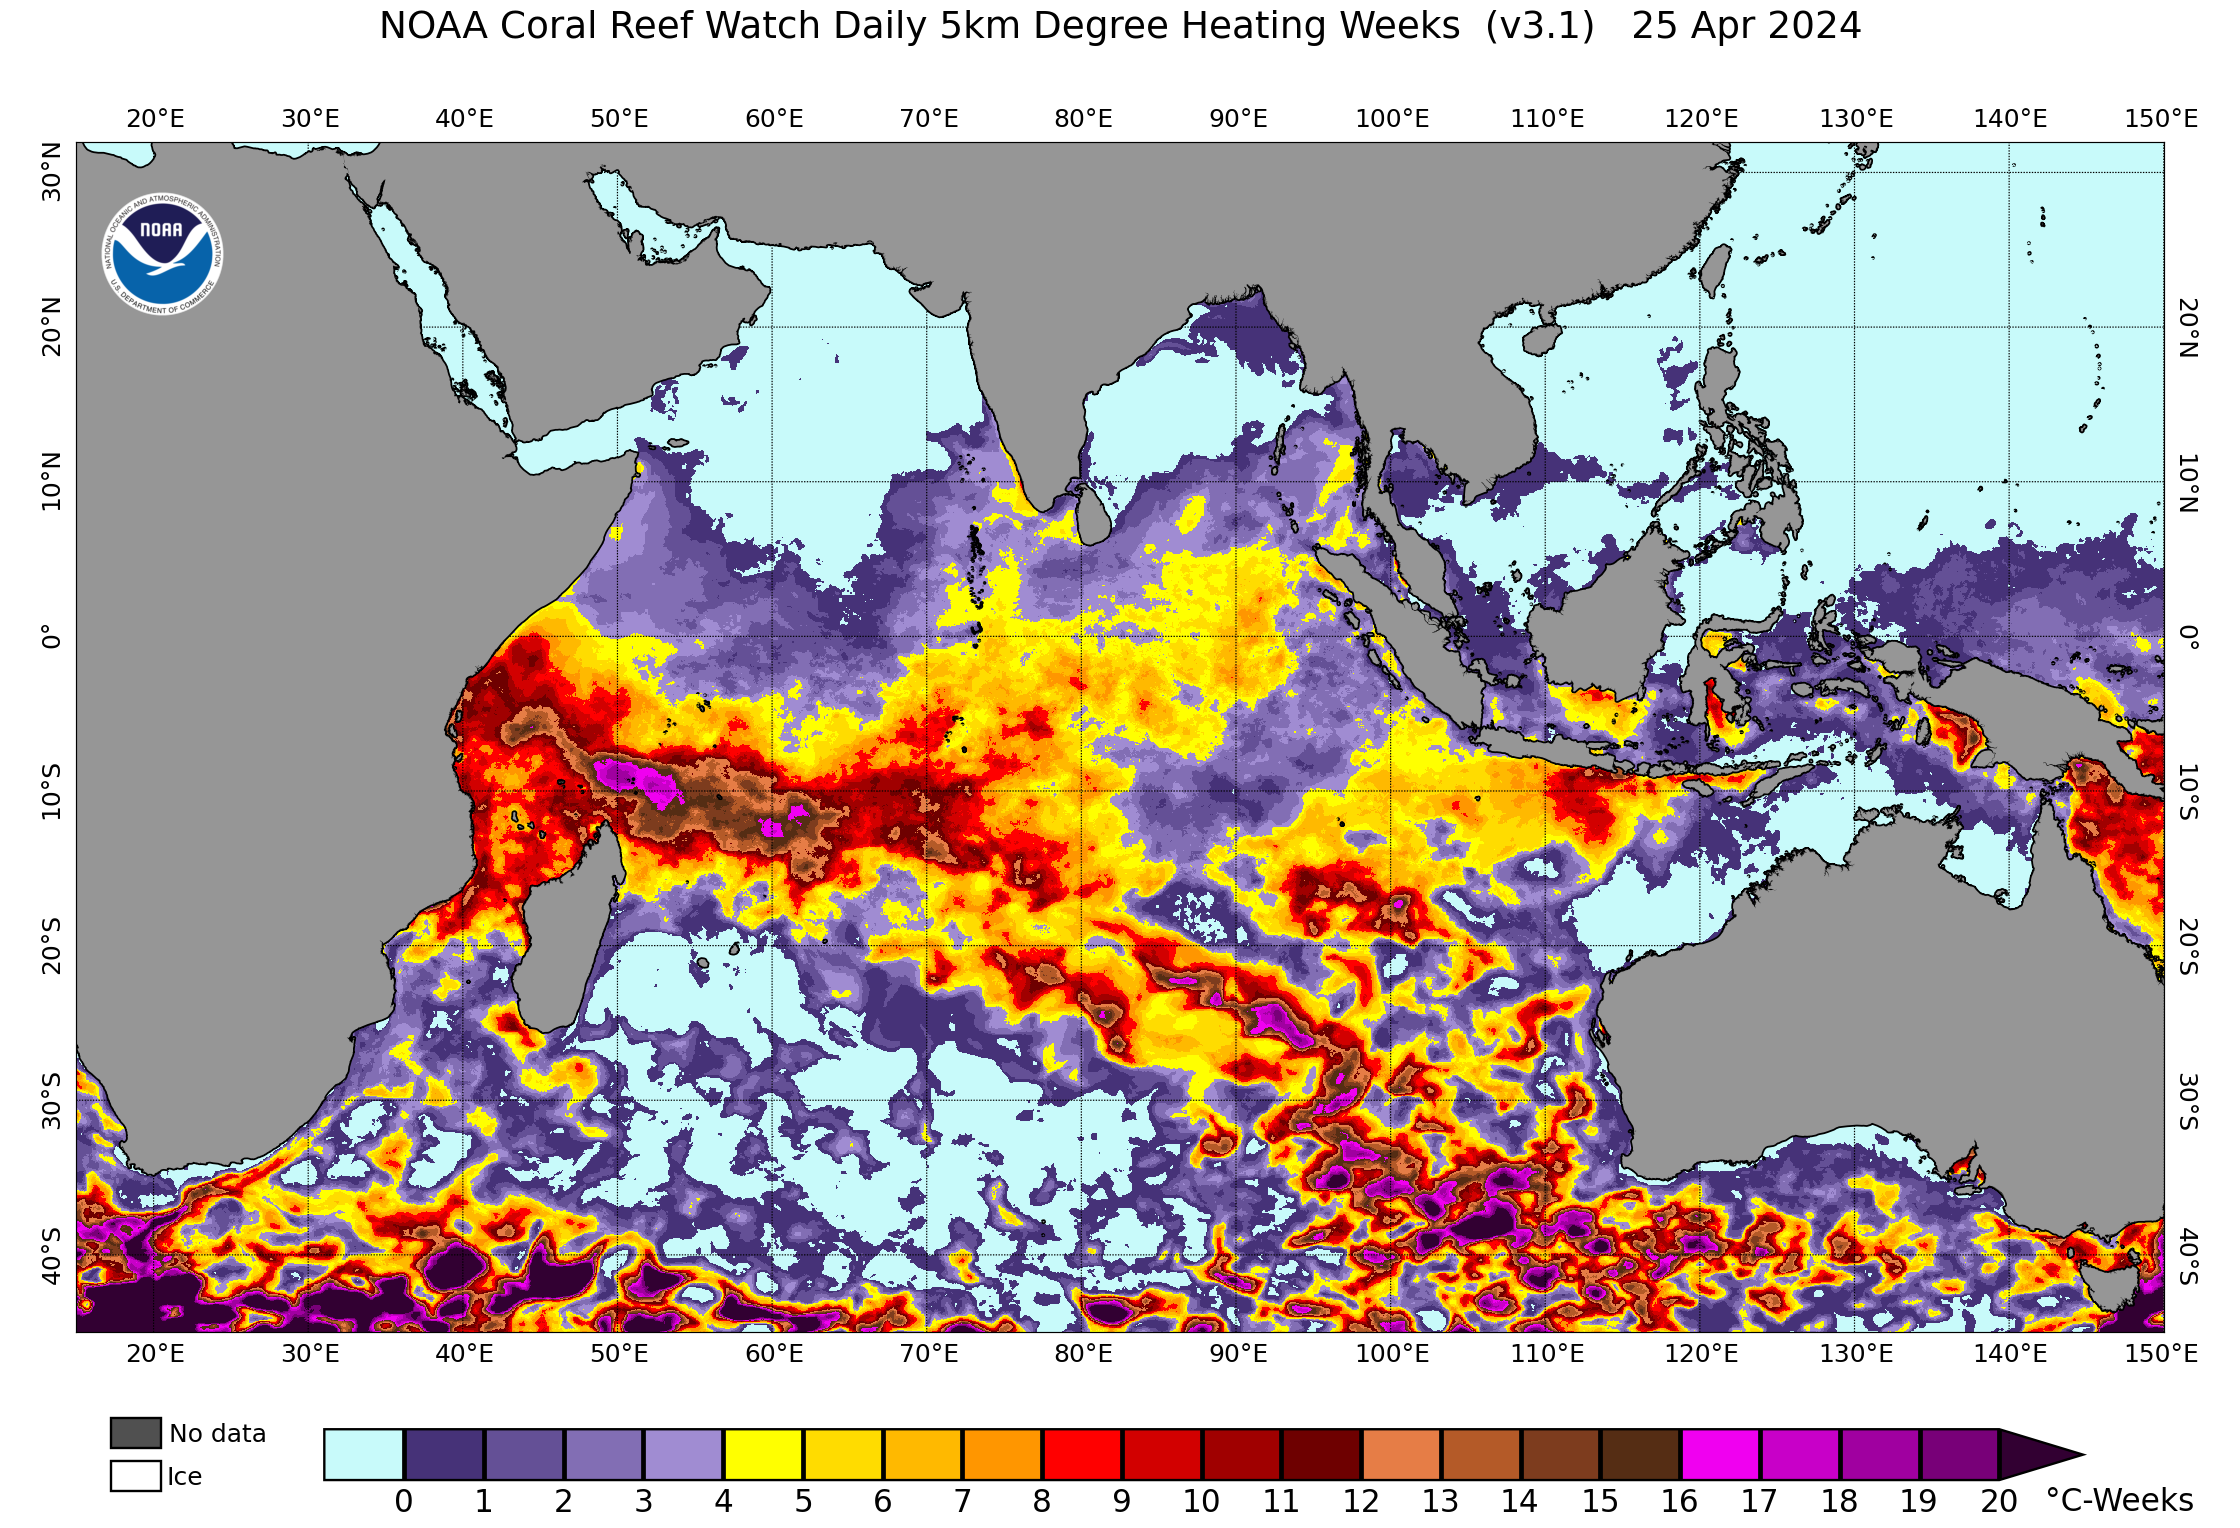
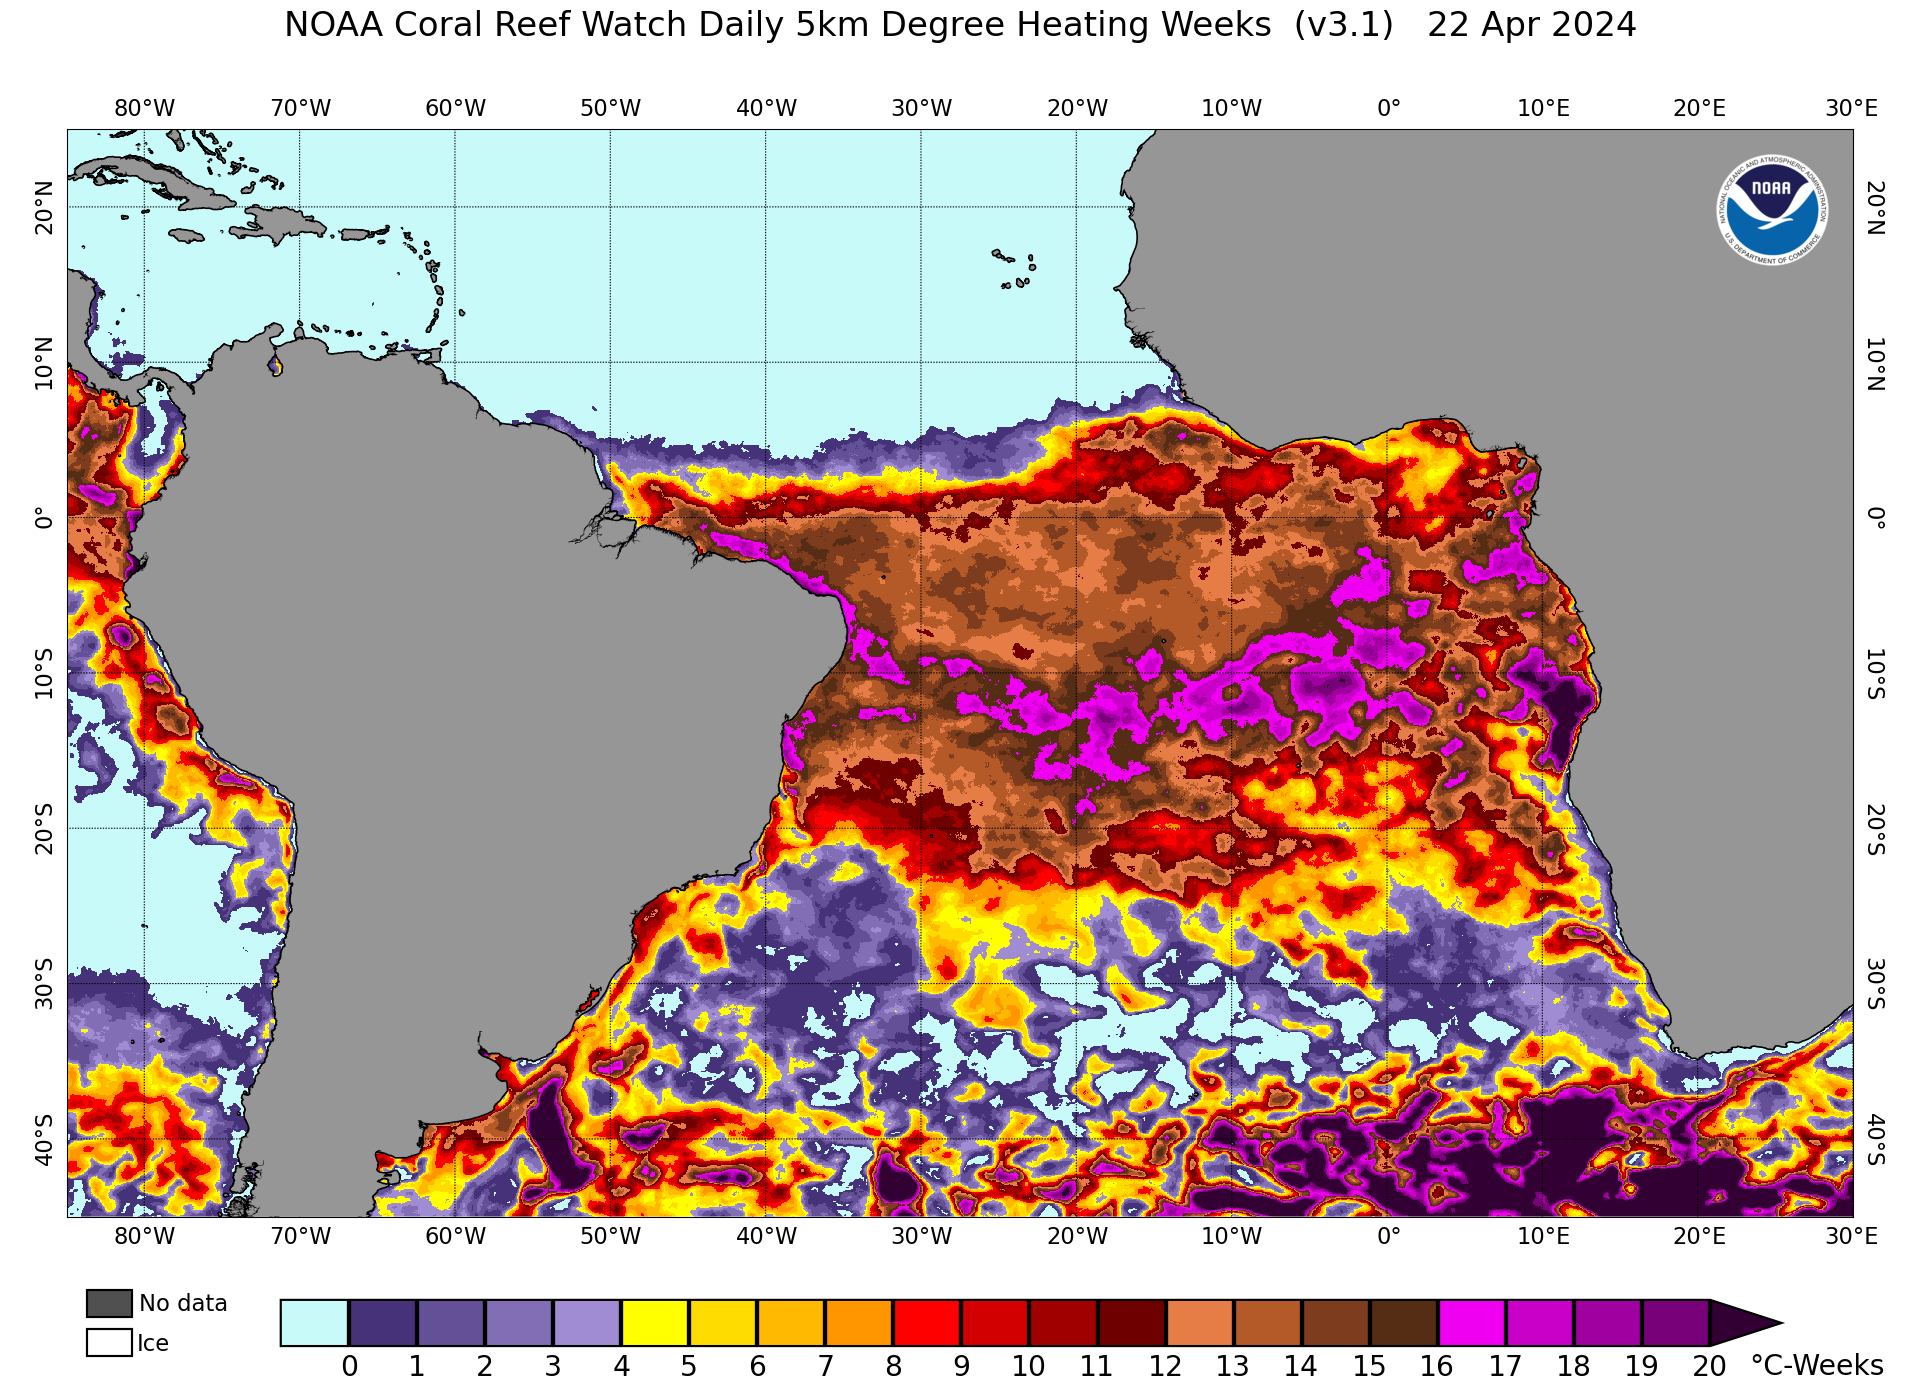
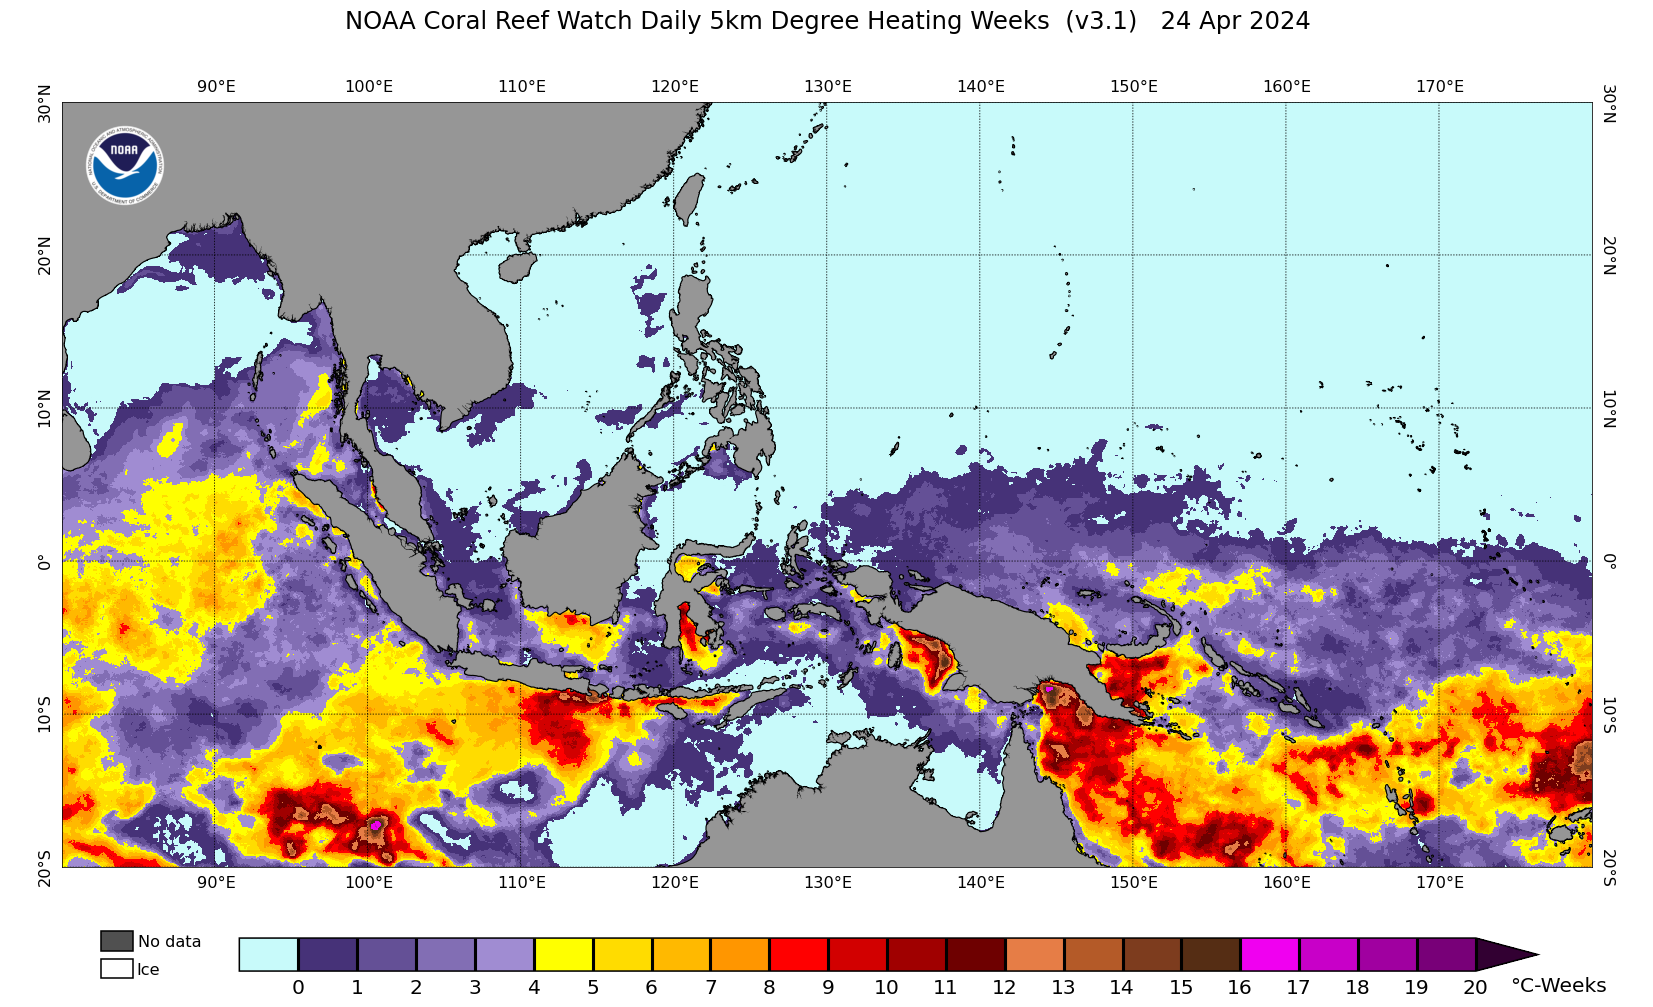
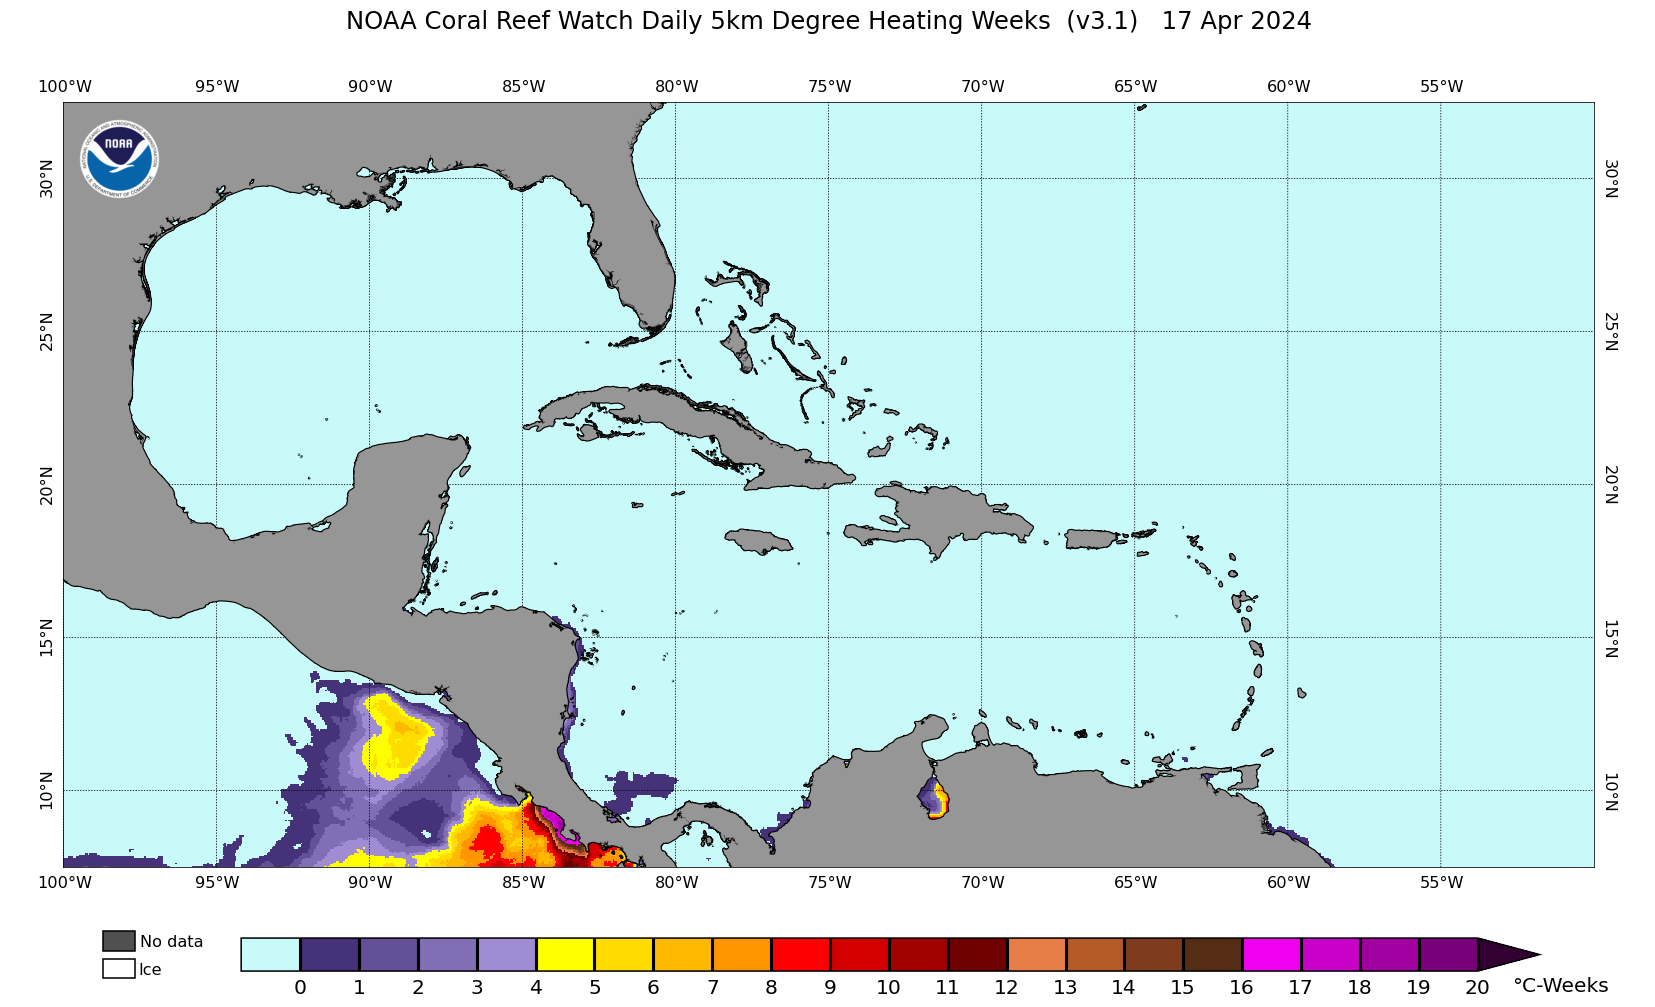
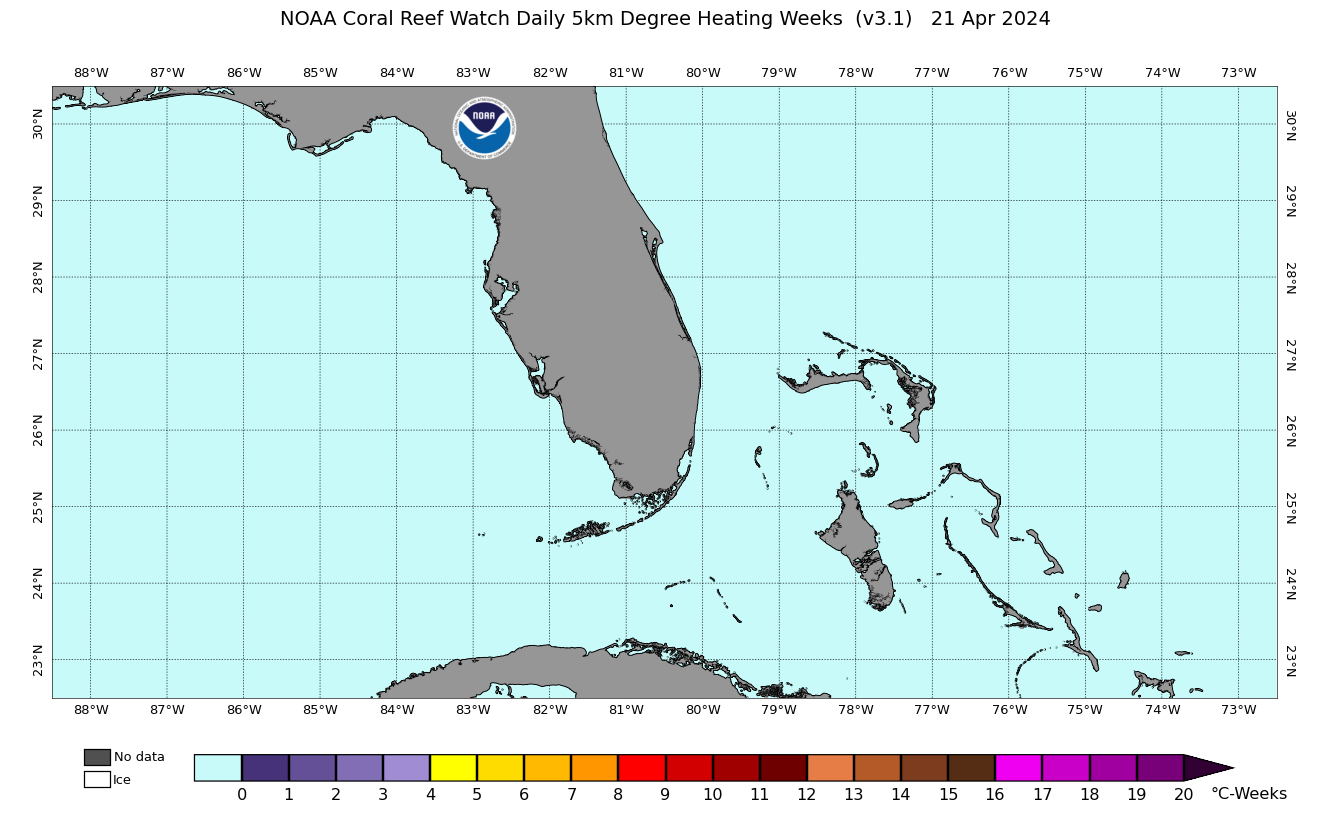
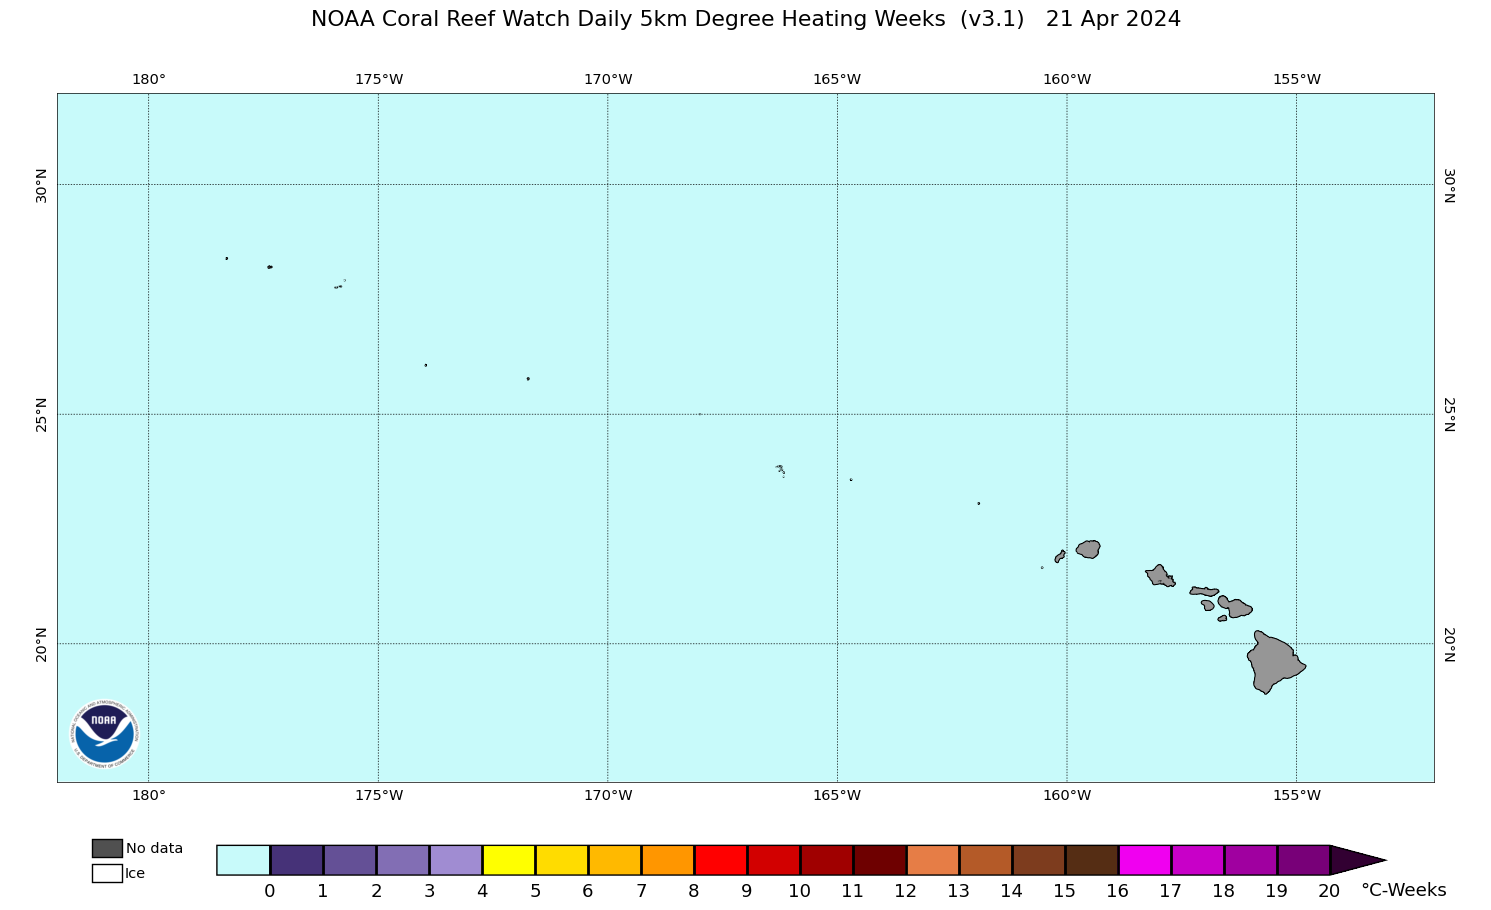
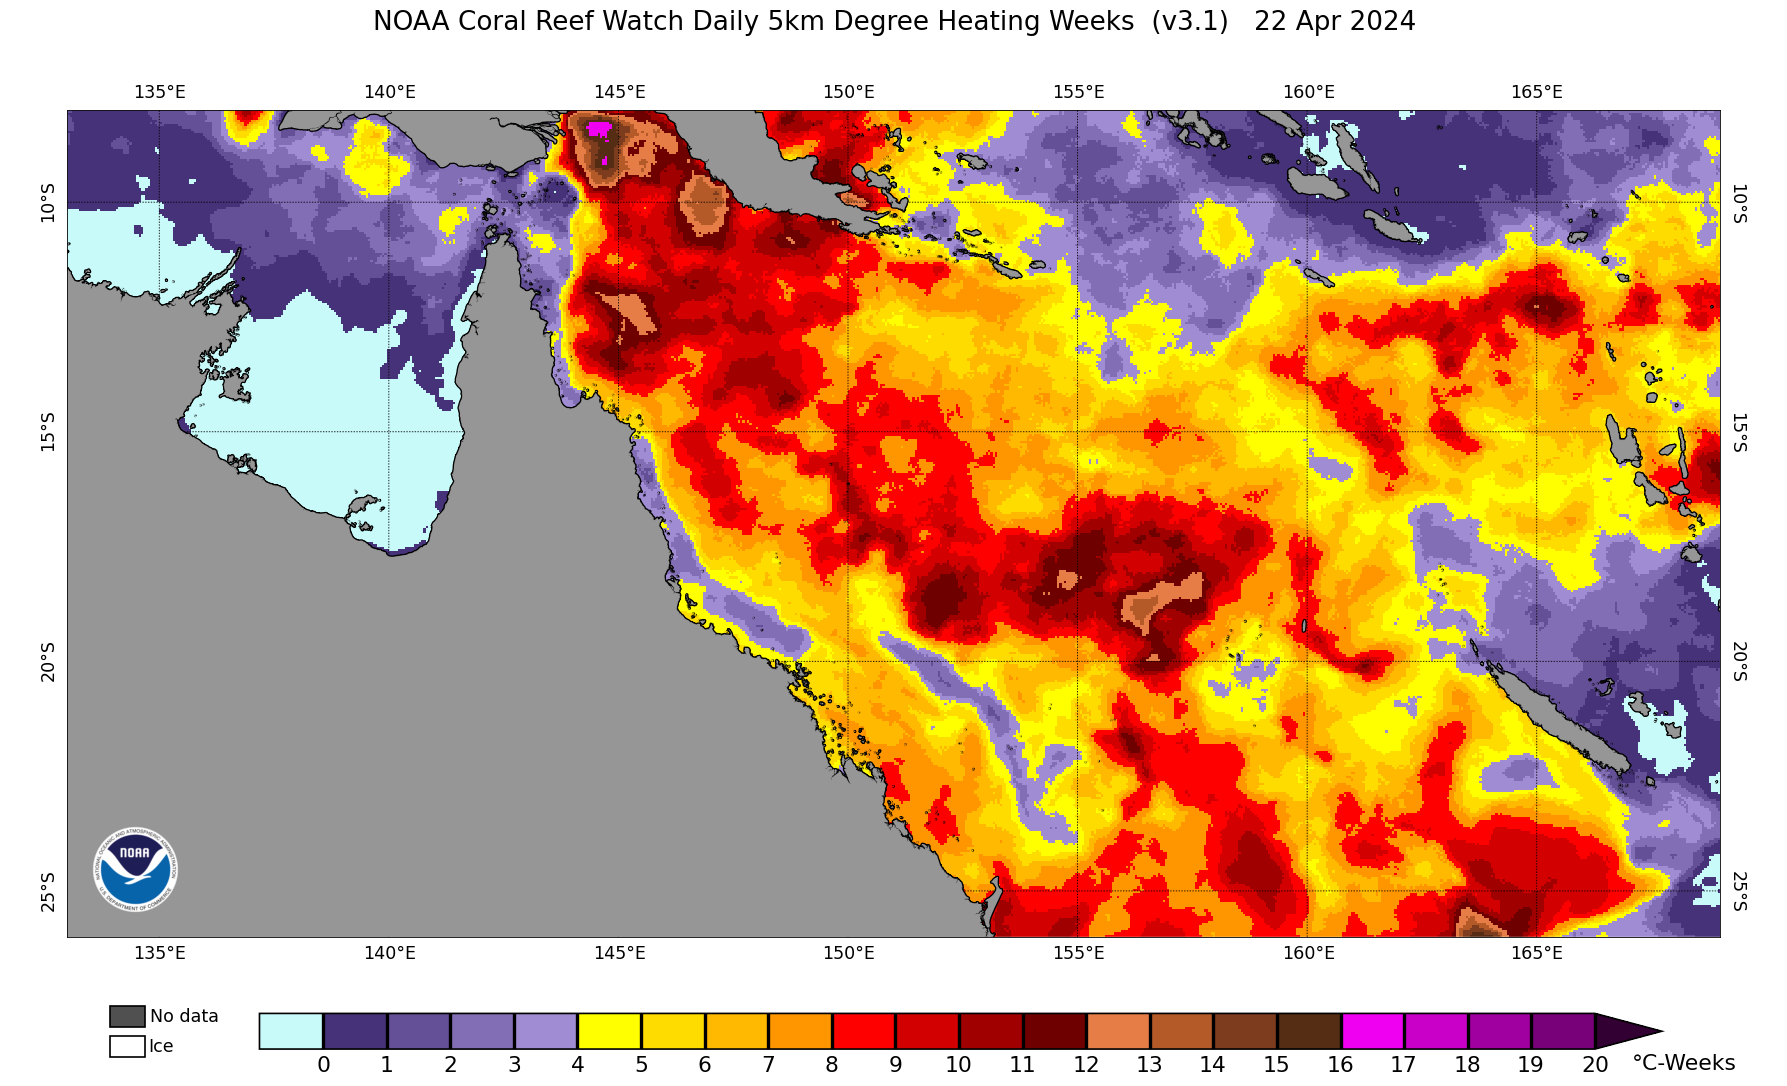
The NOAA Coral Reef Watch (CRW) daily global 5km satellite coral bleaching Degree
Heating Week (DHW) product presented here shows accumulated heat stress, which can lead to
coral bleaching and death. The scale ranges from 0 to 20 °C-weeks. The DHW product
accumulates the instantaneous bleaching heat stress, measured by CRW's
Coral Bleaching HotSpot, during the most recent
12-week period. It is directly related to the timing and intensity of coral bleaching.
There is a risk of coral bleaching when the DHW value reaches 4 °C-weeks. By the
time the DHW value reaches 8 °C-weeks, reef-wide coral bleaching with mortality of
heat-sensitive corals is likely. If the accumulated heat stress continues to build further and
exceeds a DHW value of 12 °C-weeks, multi-species mortality becomes likely. At a DHW greater than or
equal to 16 °C-weeks, there is a risk of severe, multi-species mortality (in >50% of corals), and at
a DHW greater than or equal to 20 °C-weeks, near complete mortality (in >80% of corals) is likely.
This product is updated each afternoon at about 13:30 U.S. Eastern Time.