


(Version 3.1, 1985-present, released August 1, 2018)
|
|
|
|
|
|
|
|
|
|
|
|
|
|
|
|
|
|
|
|
|
|
|
|
|
|
|
|
|
|
|
|
|
|
|
|
|
|
||
|
|
||
|
|
|
|
||
|
|
||
|
|
|
|
||
|
|
||
|
|
|
|
|
|
| + | CDAT software to view CRW NetCDF data files. |
| * | BAA: Bleaching Alert Area; DHW: Degree Heating Week; SSTA: SST Anomaly; SST: Sea Surface Temperature. |
| # | PacIOOS: Pacific Islands Ocean Observing System. |
** Contains 12 monthly mean SST climatologies for deriving CRW's daily global 5km SST Anomaly product. The maximum pixel-based values from among the 12 monthly mean SST climatologies form the Maximum Monthly Mean (MMM) SST climatology, which is then used to derive CRW's daily global 5km coral bleaching heat stress products.
| Product Metadata: | Web-format Metadata | XML Metadata | Plain Text Metadata |
| CDAT software: | A NOAA CoastWatch software package to view NetCDF data files. Access it here. |
|
Watch a tutorial video (YouTube) |
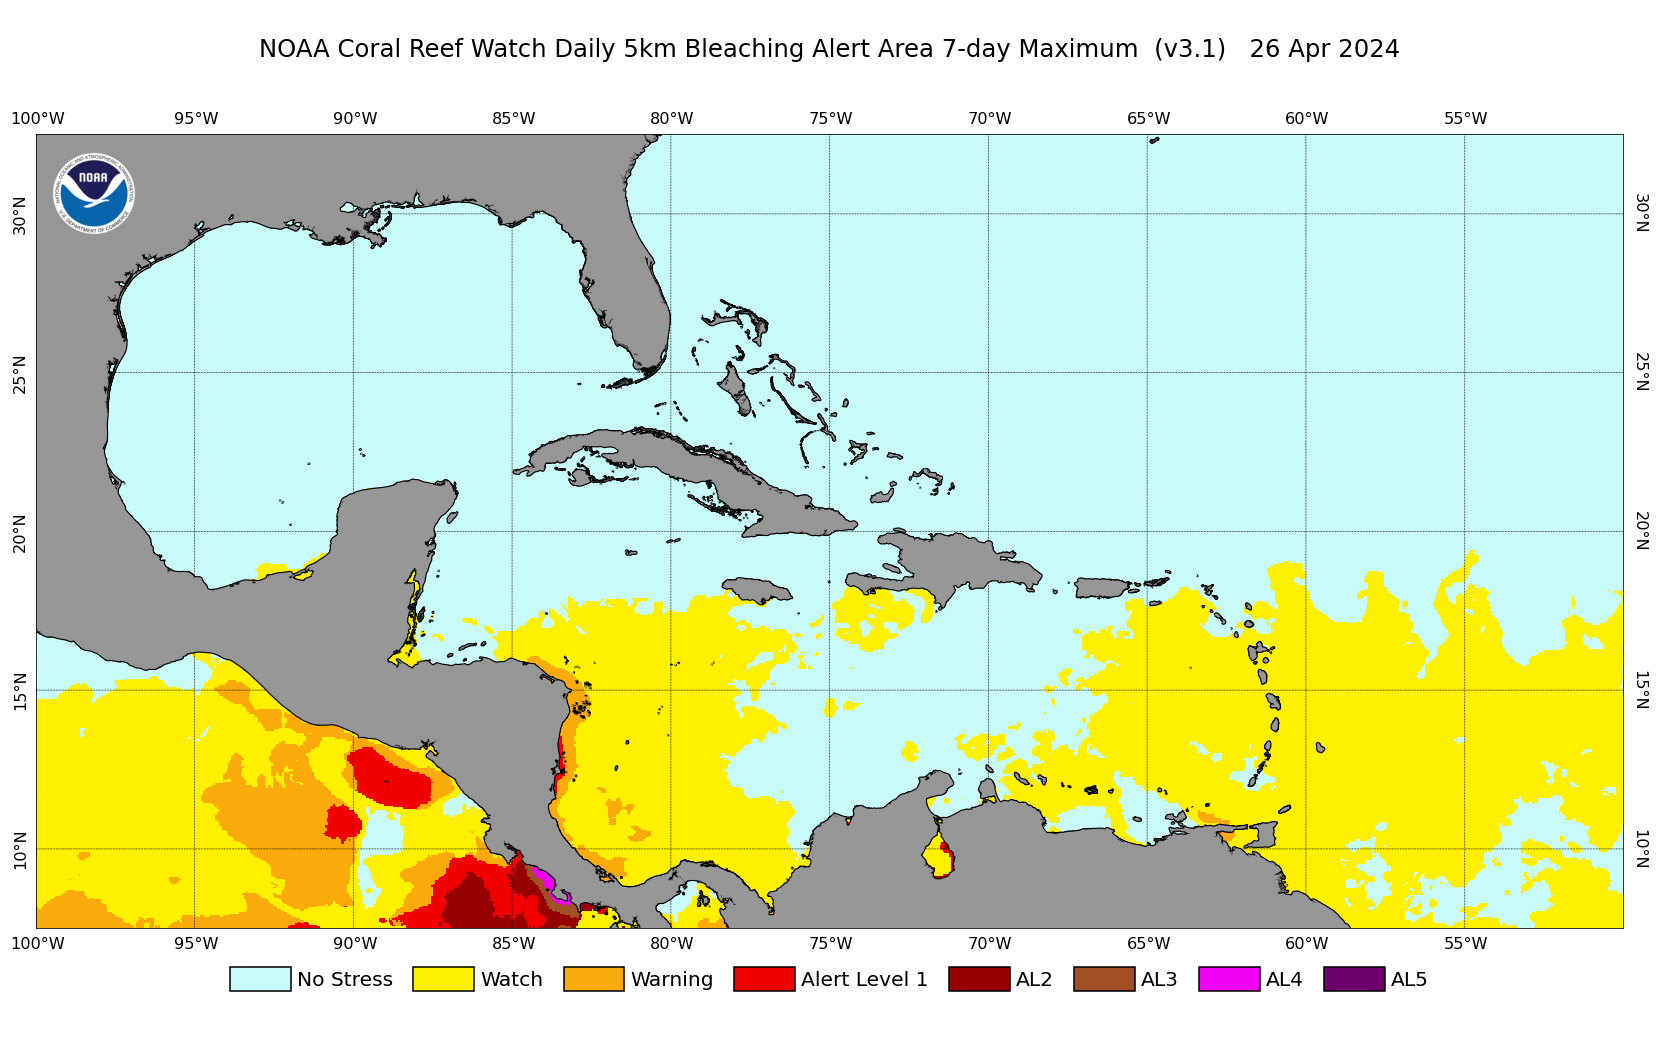
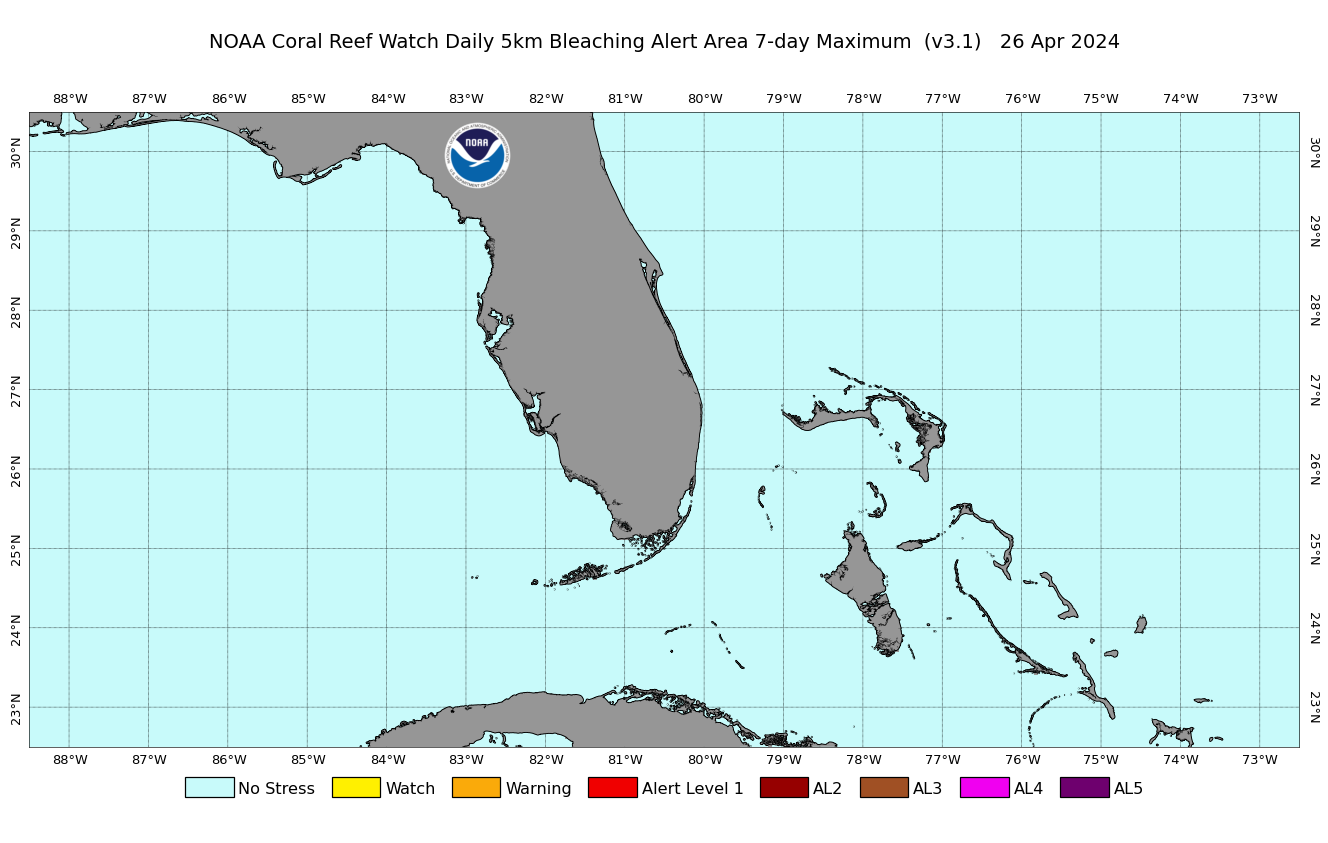
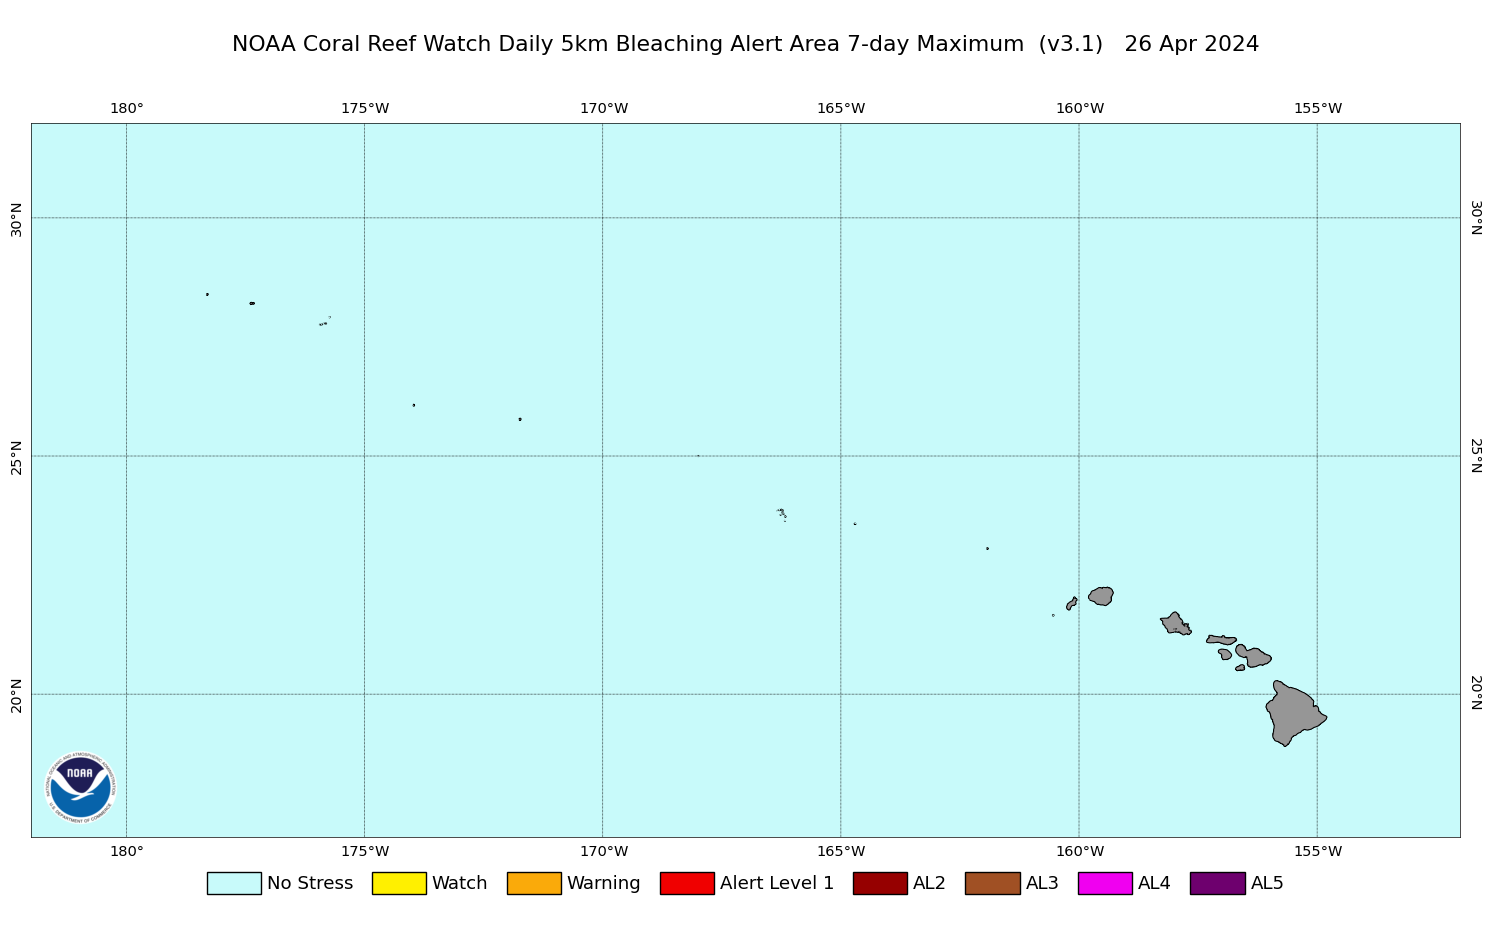
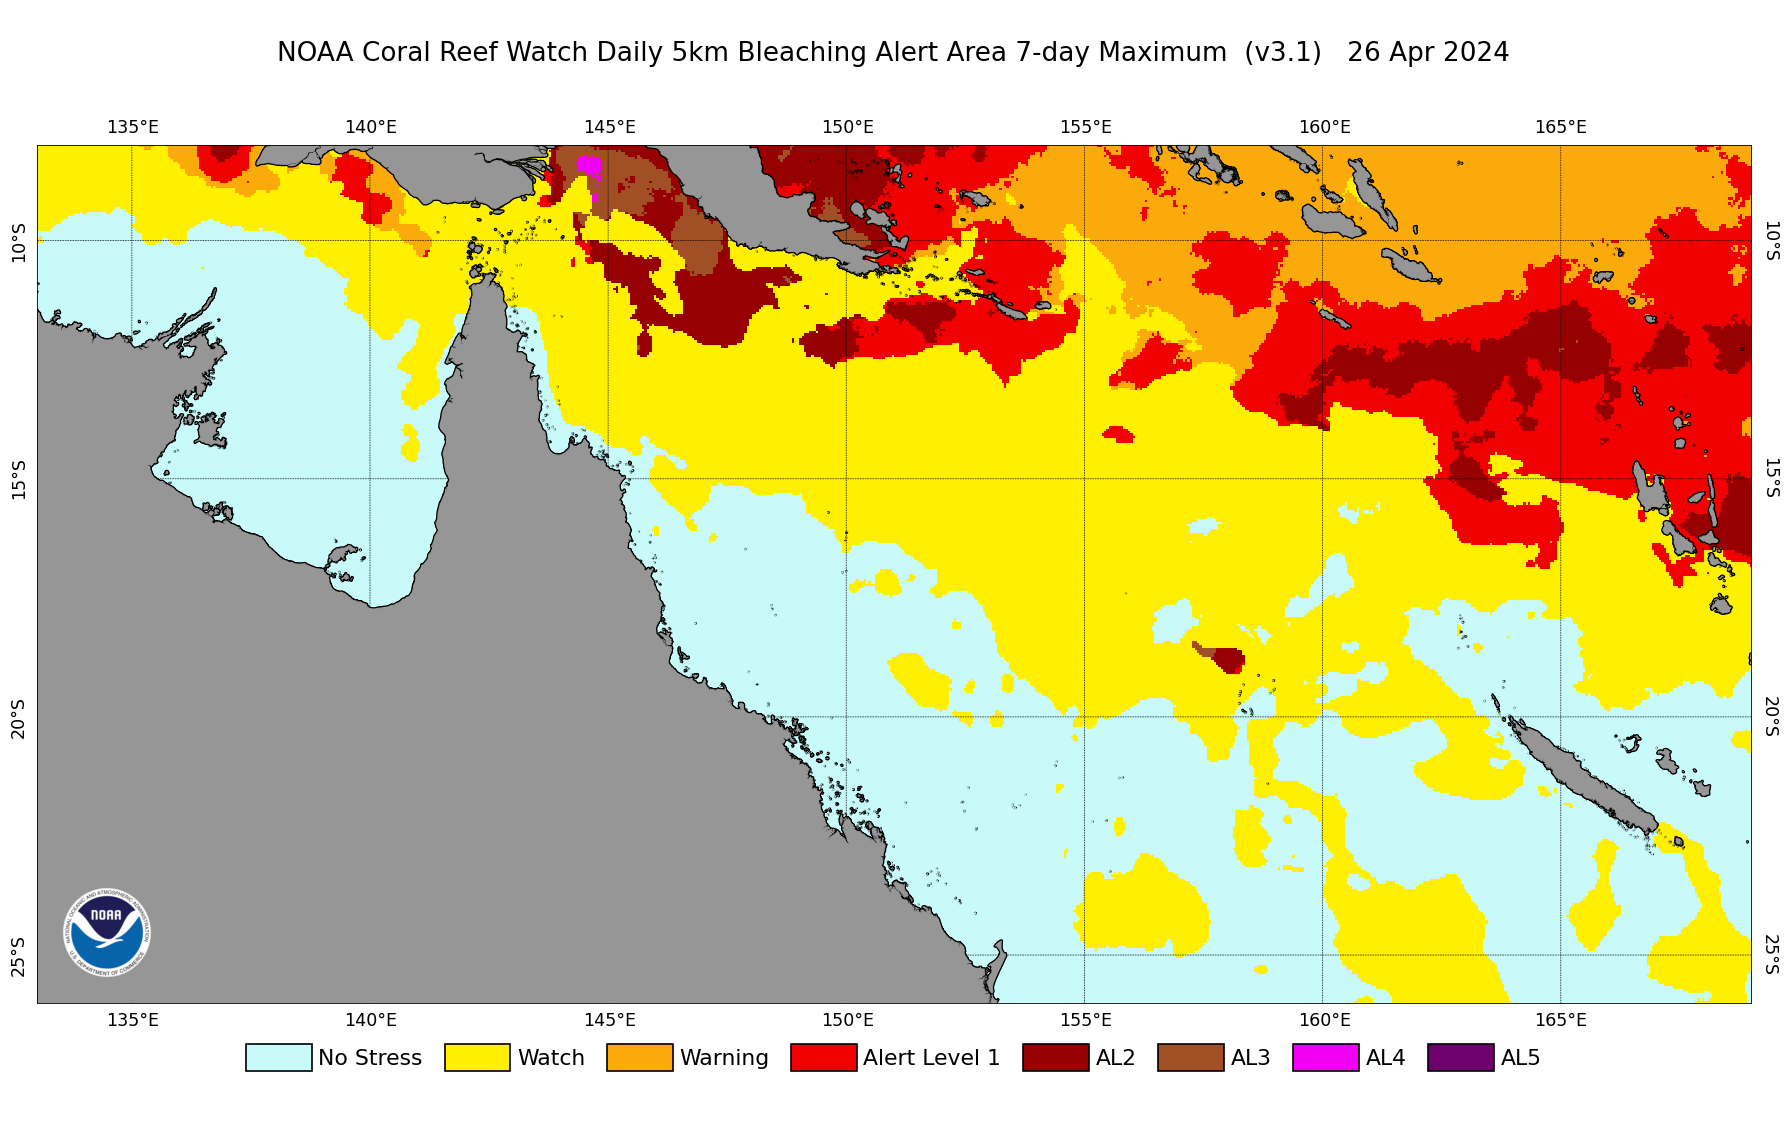
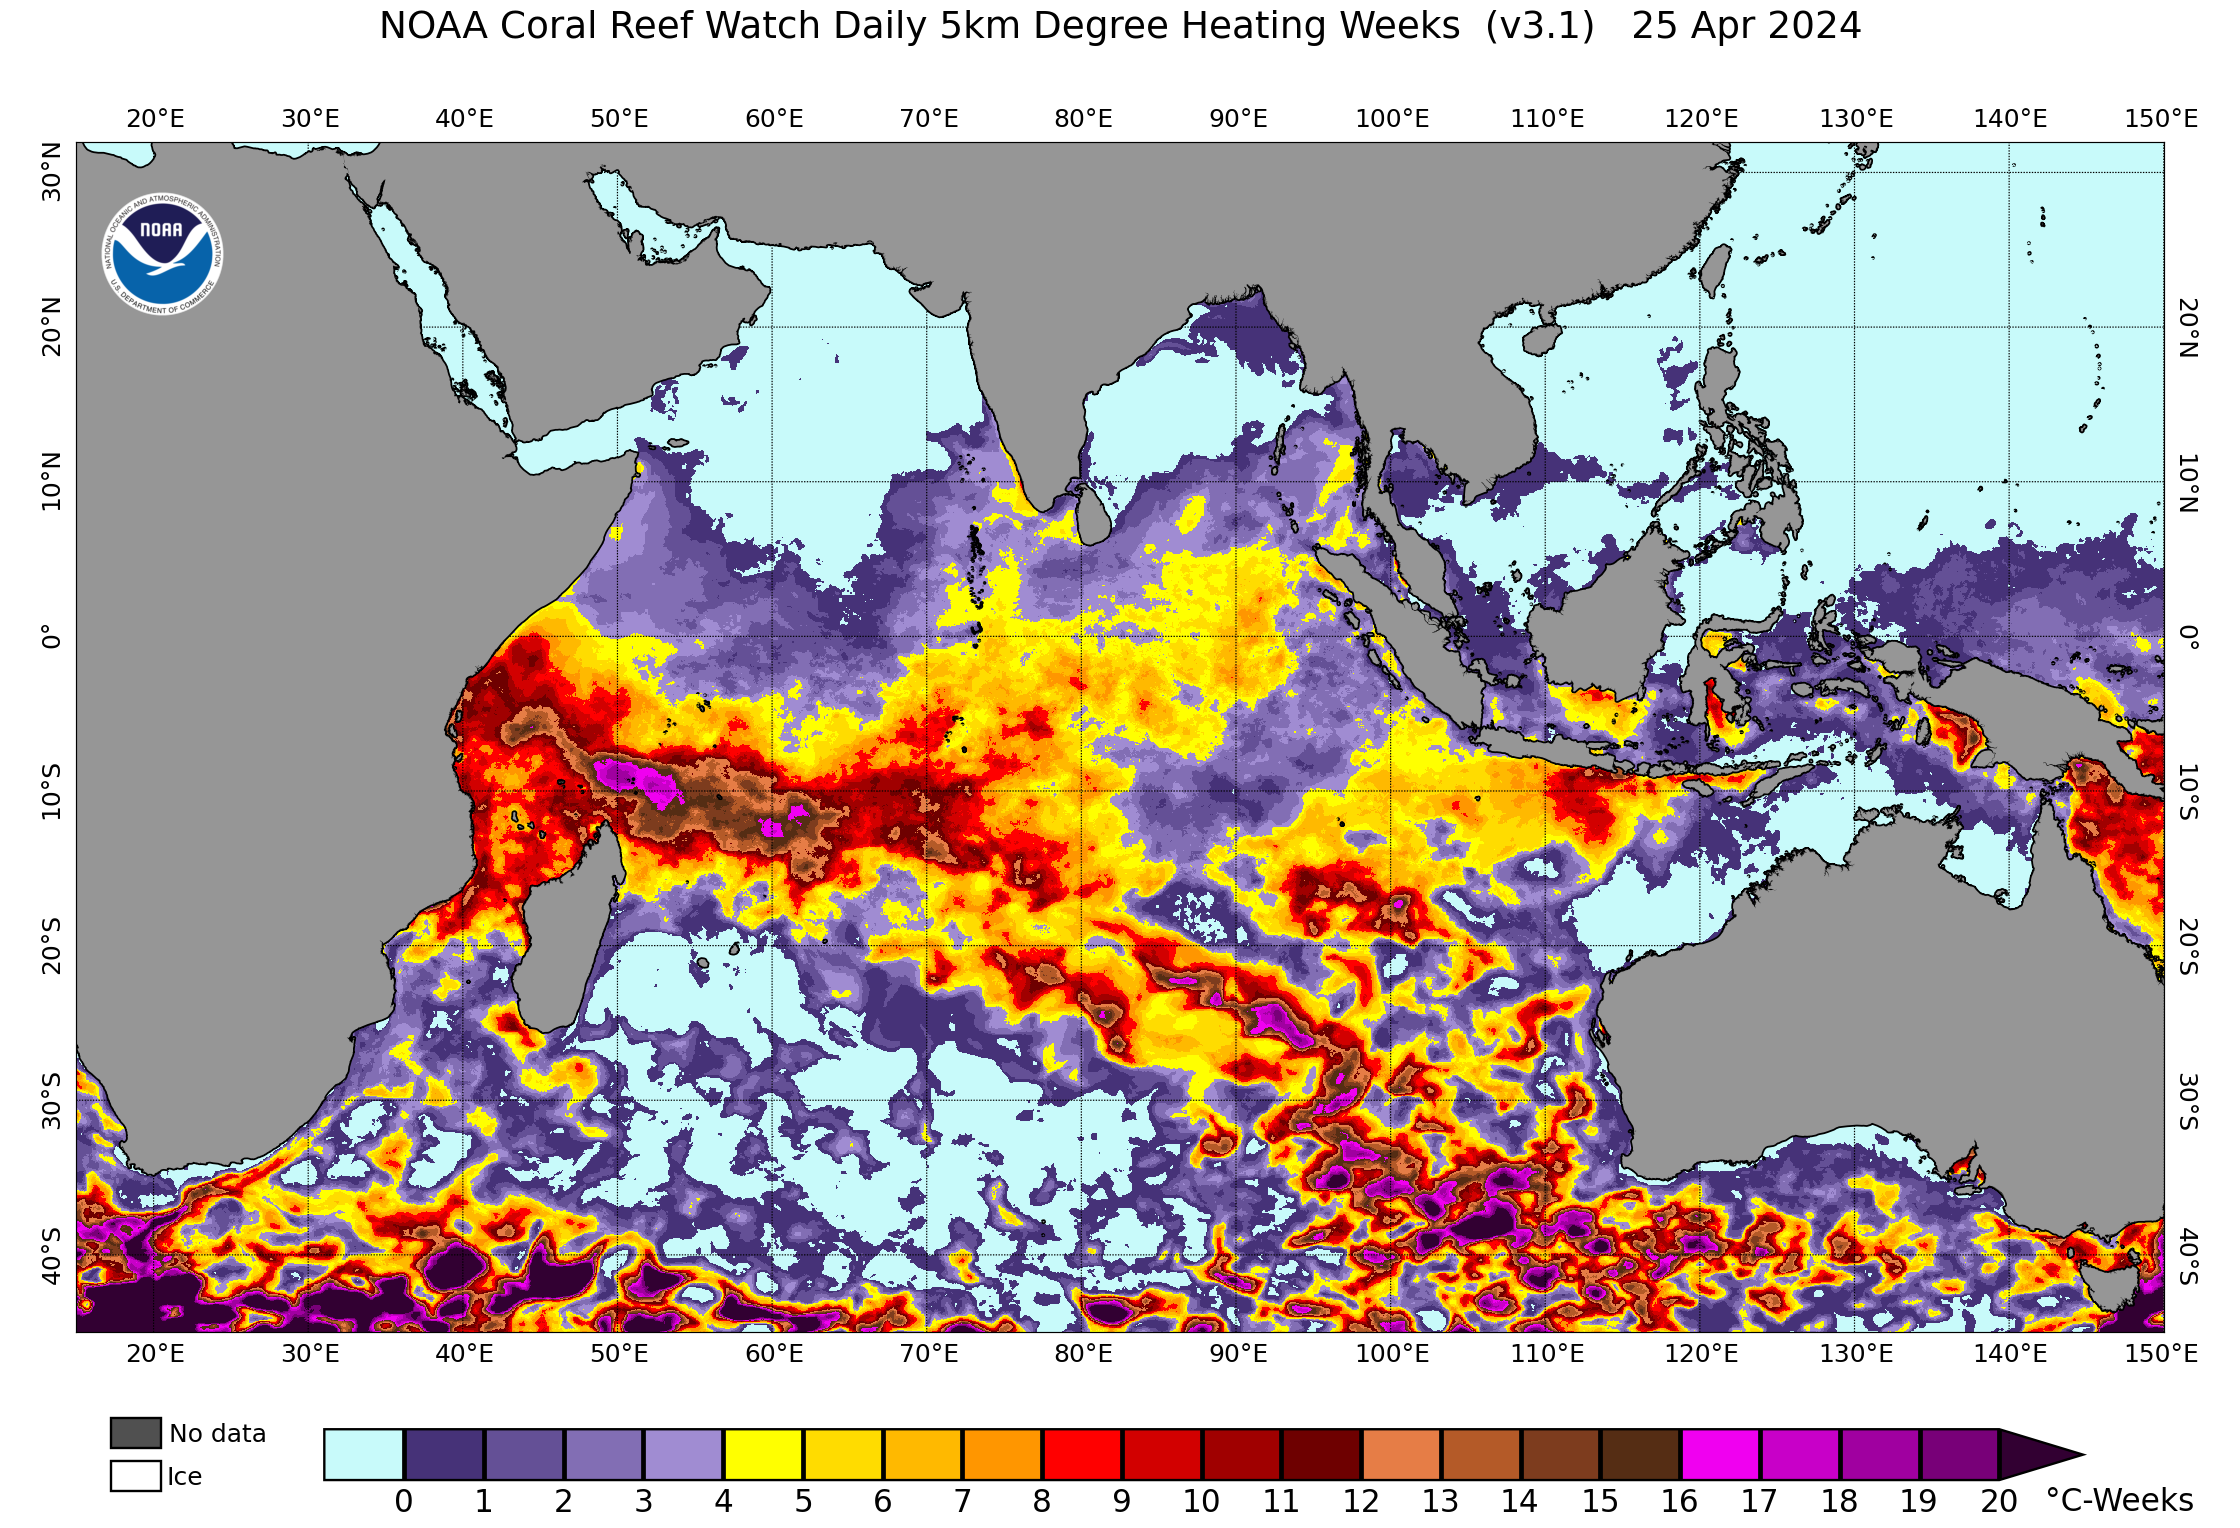
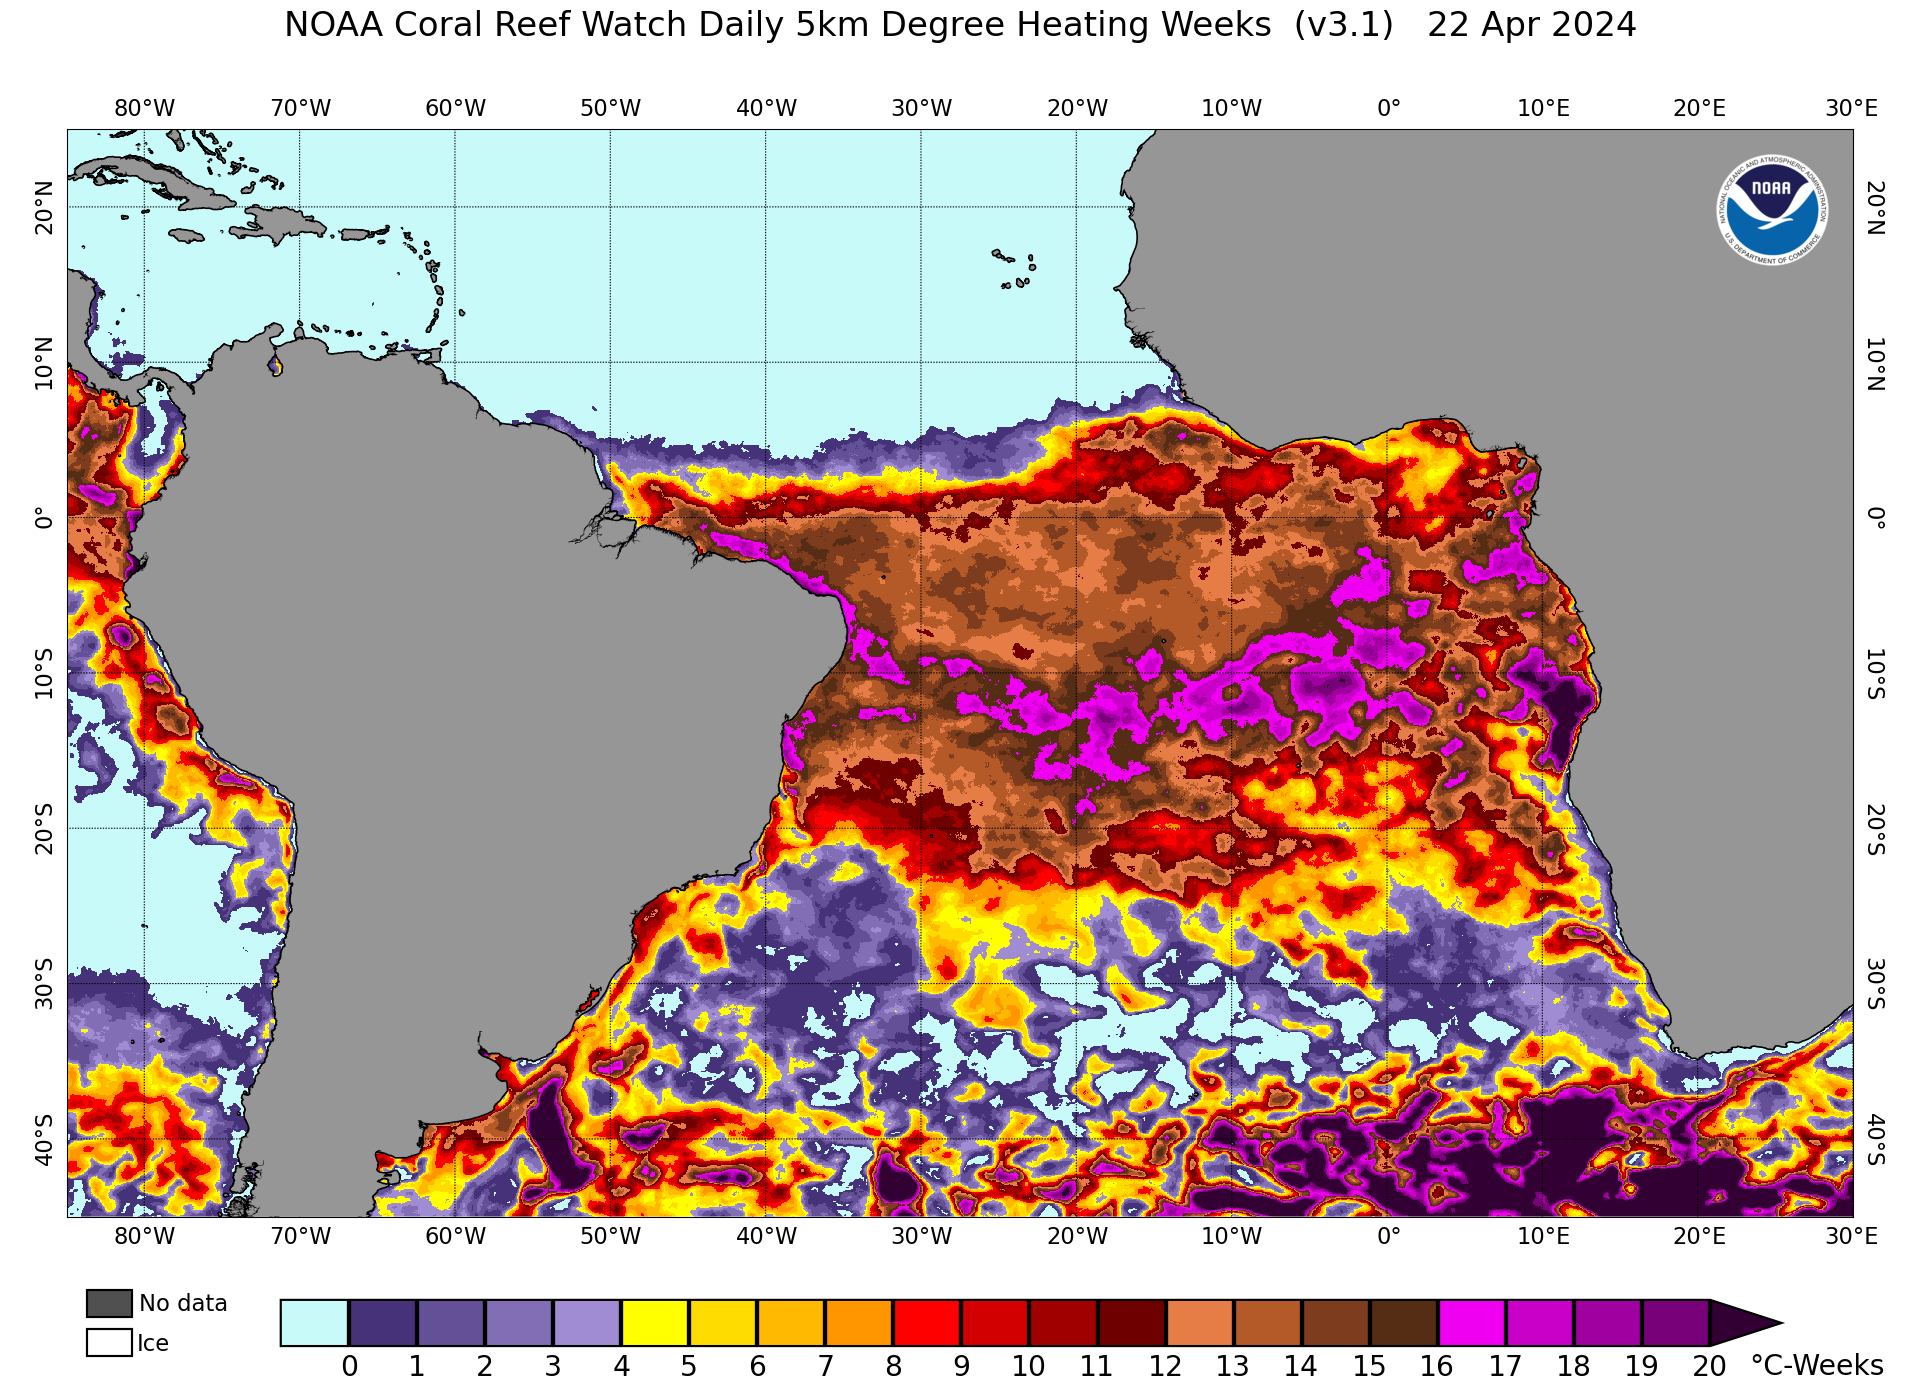
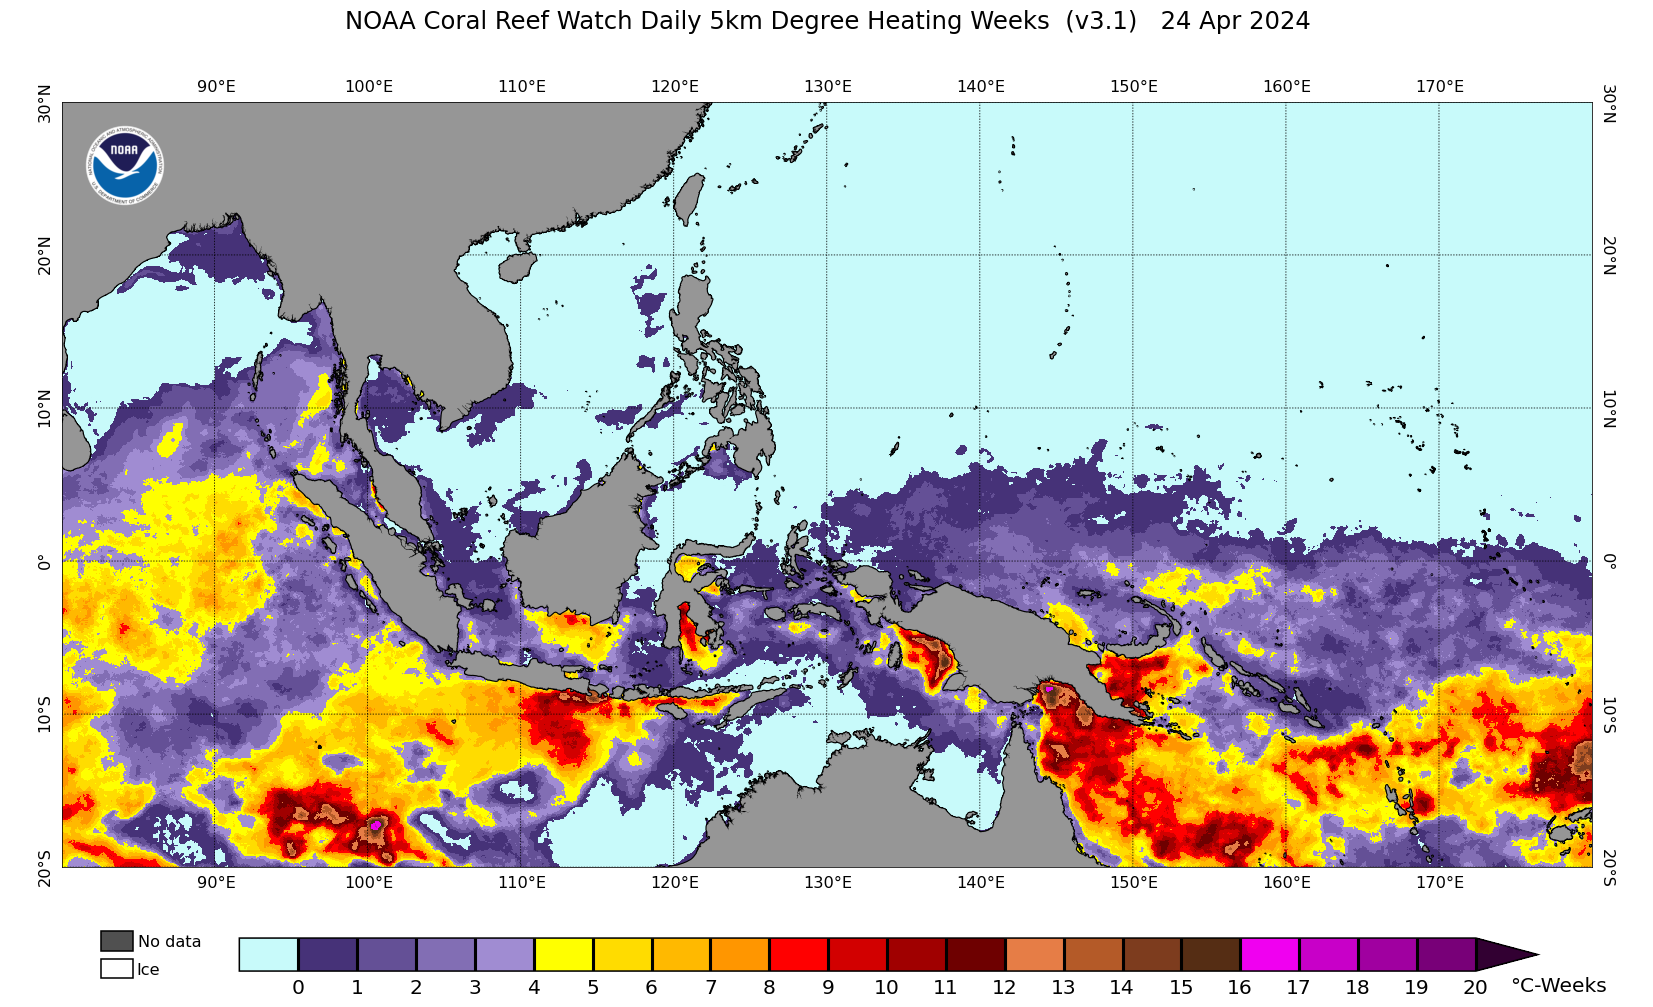
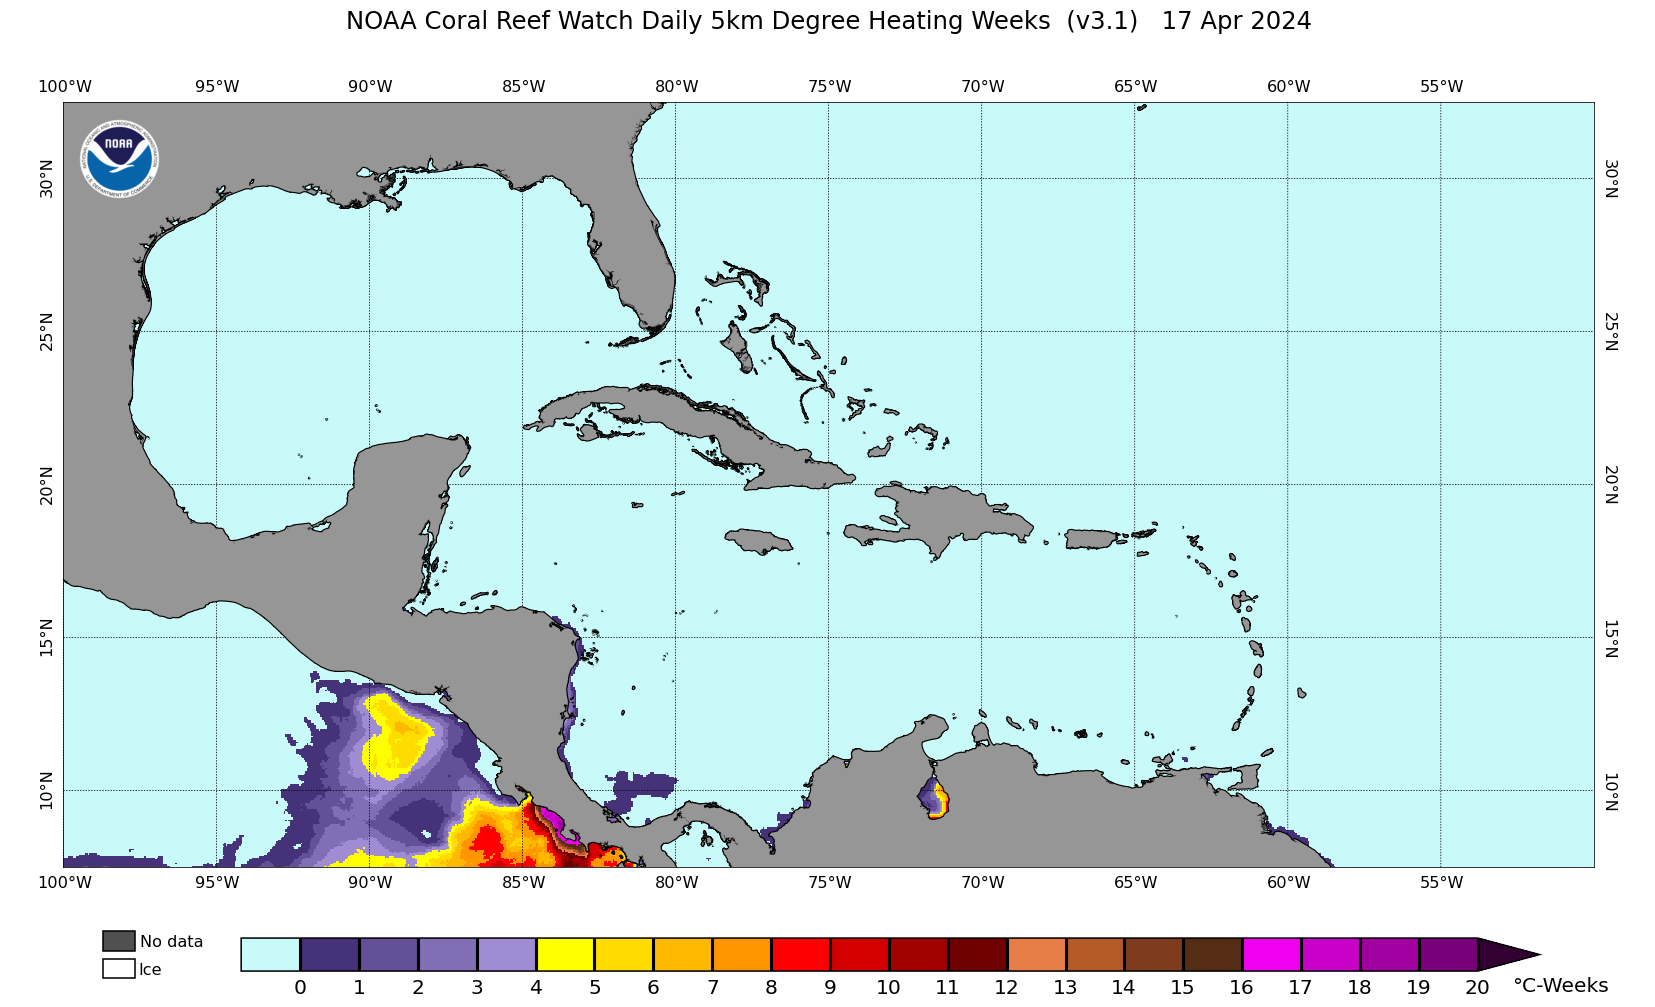
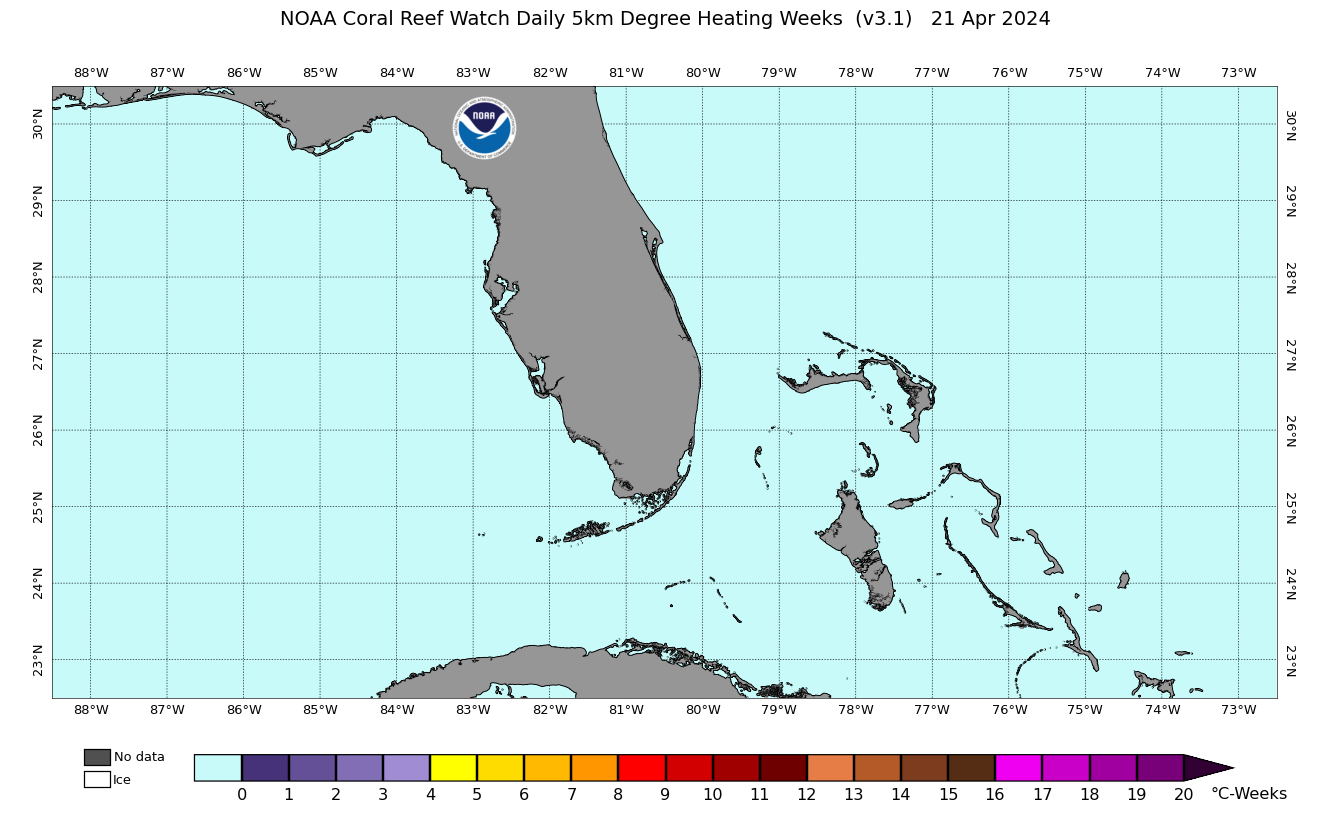
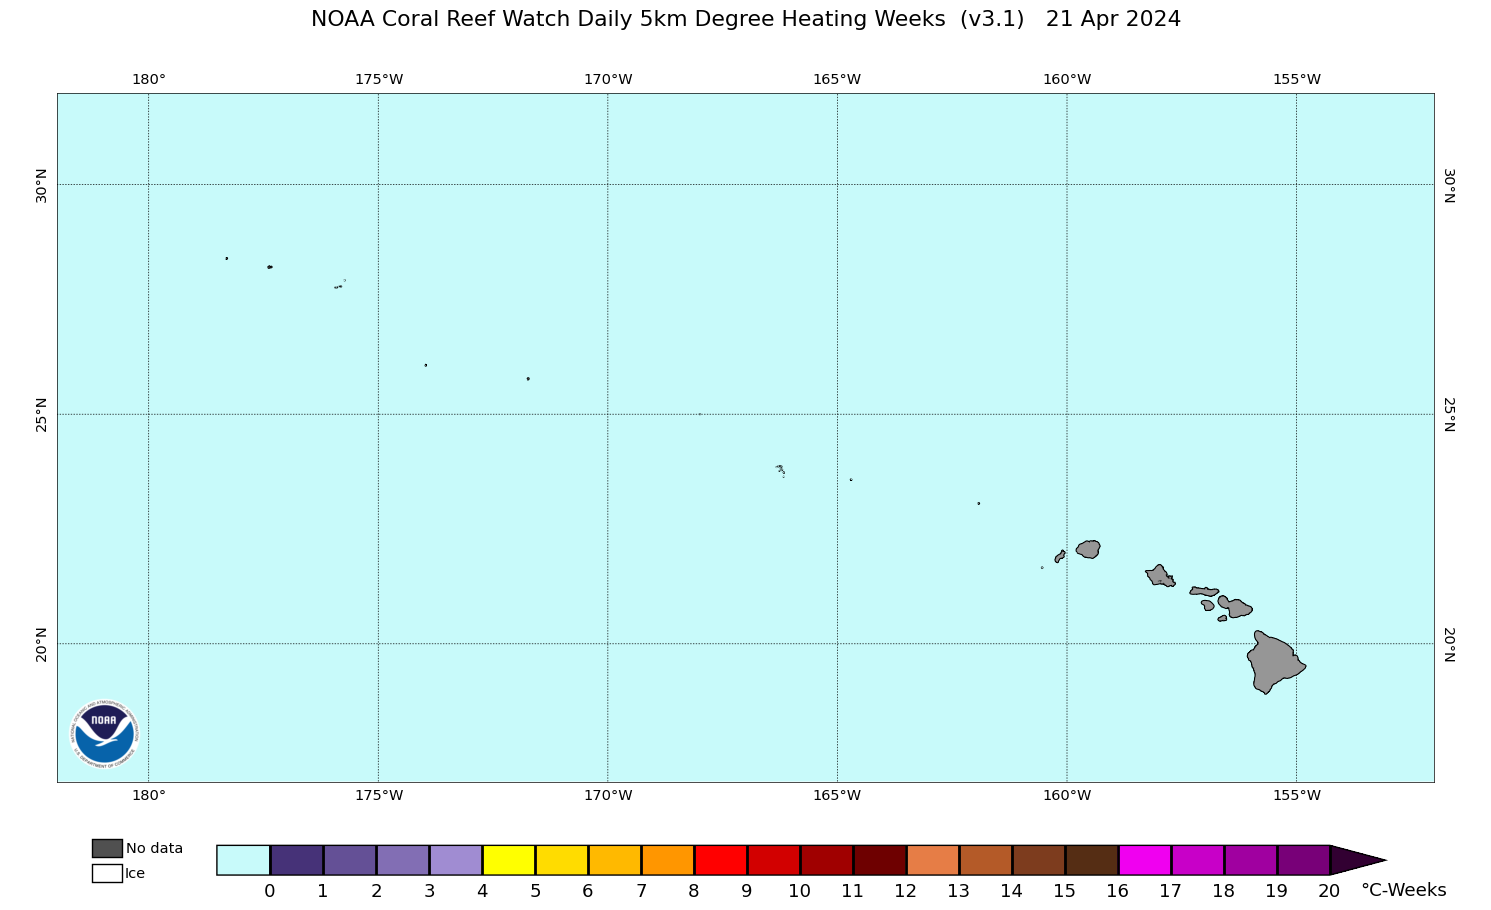
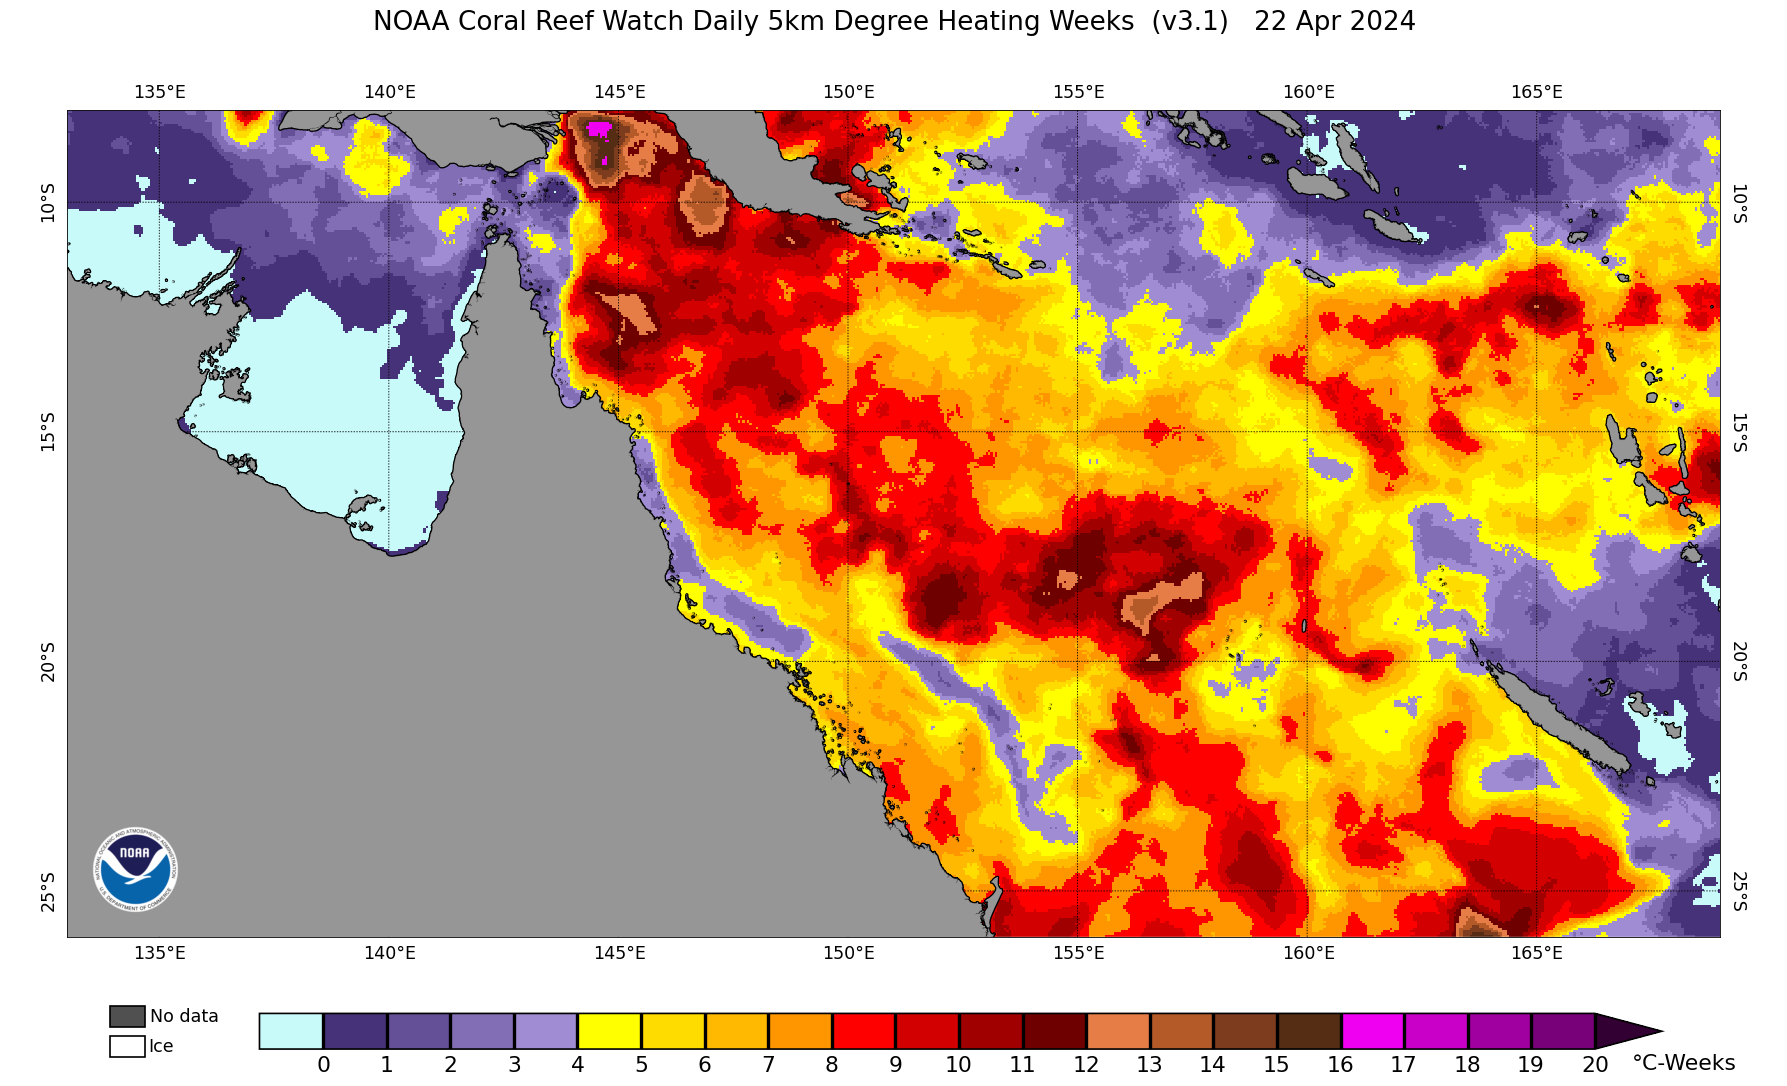
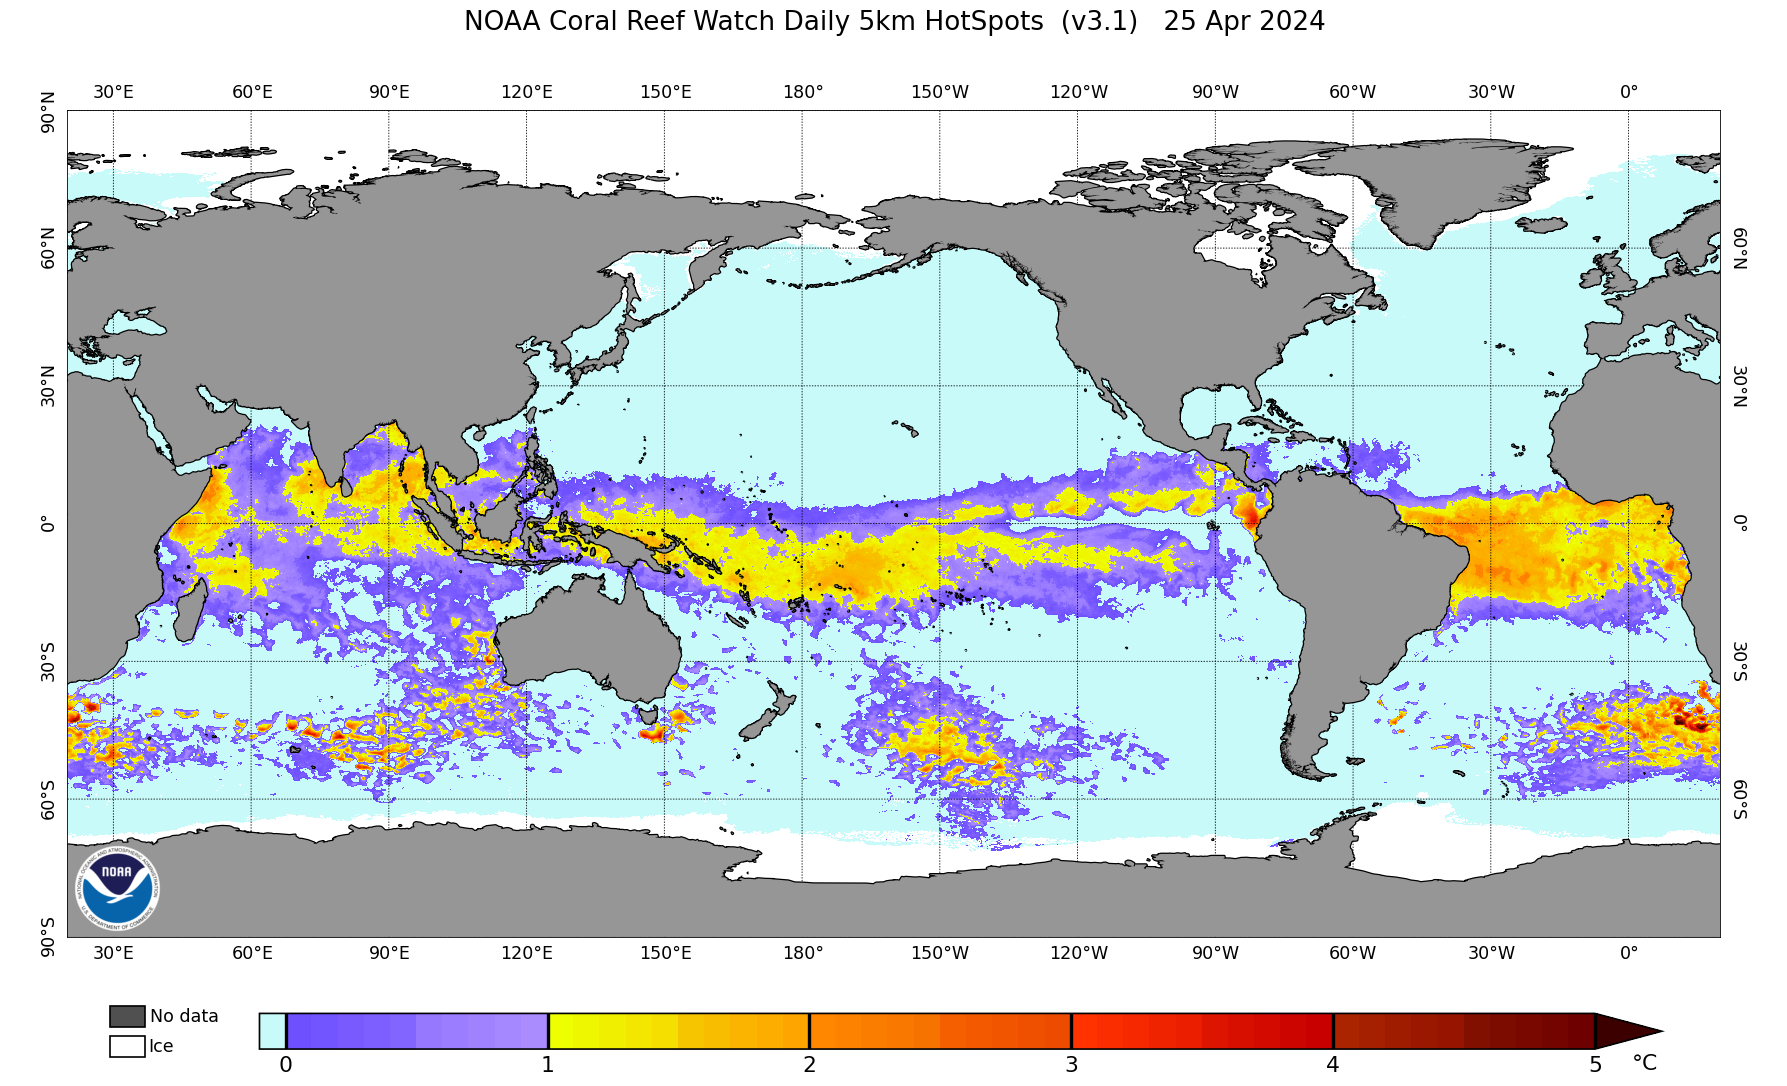
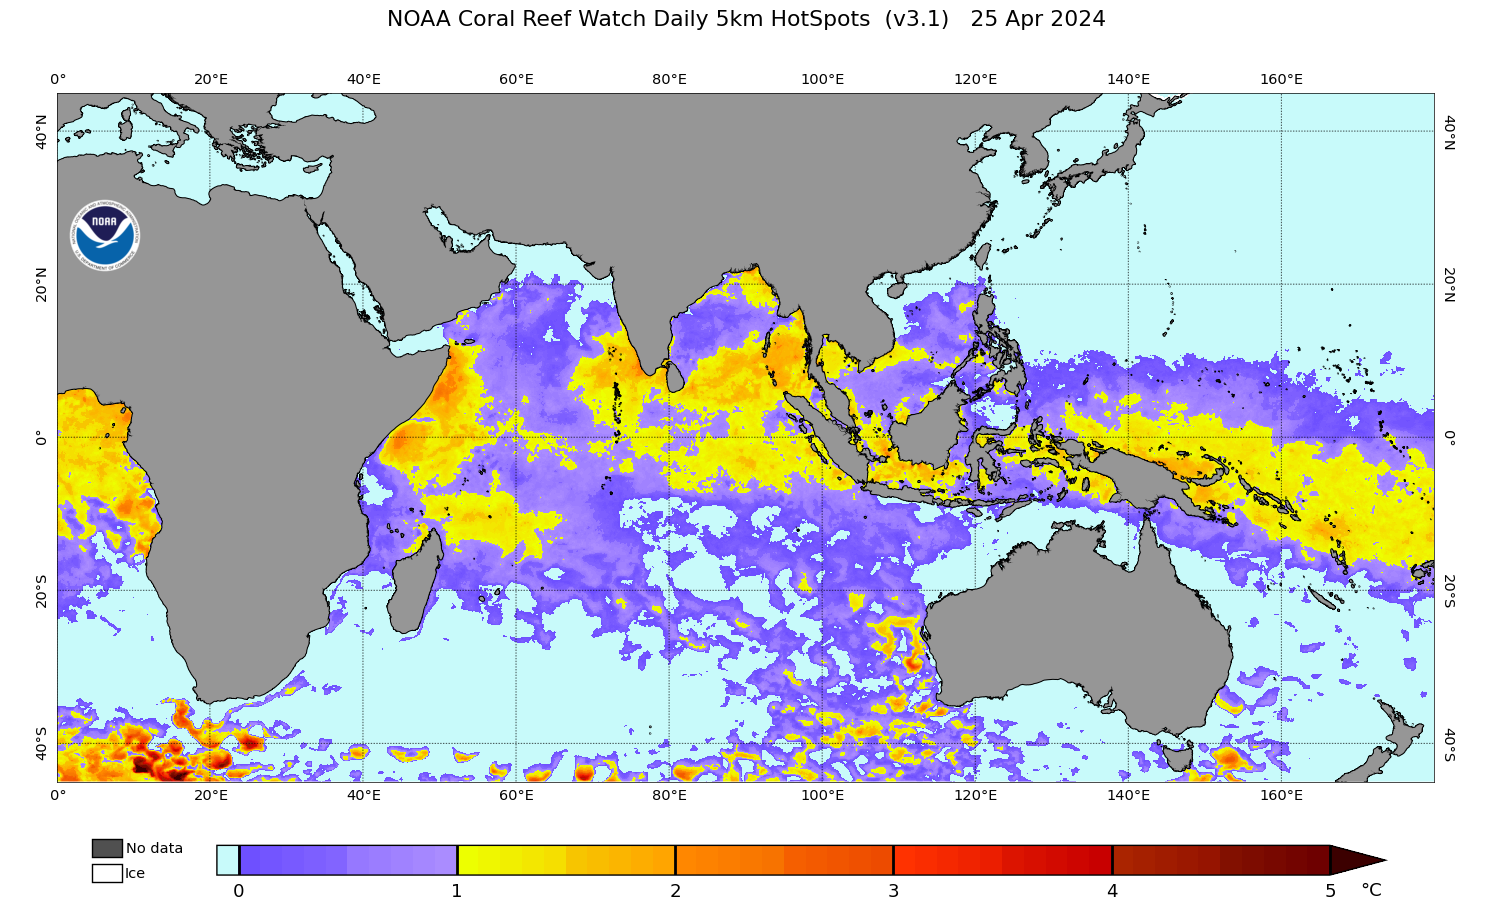
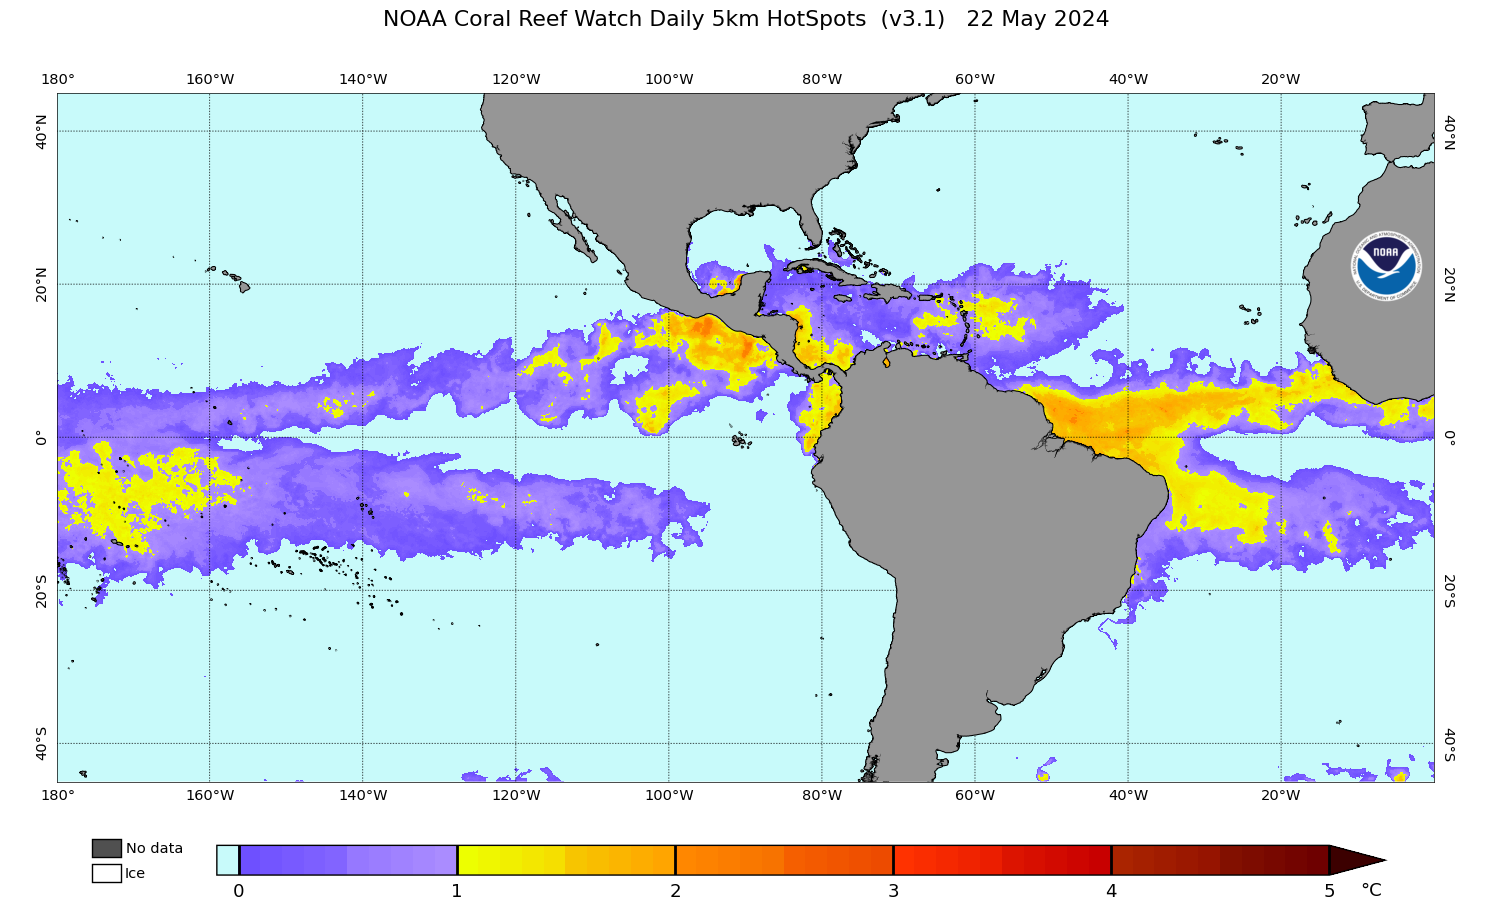
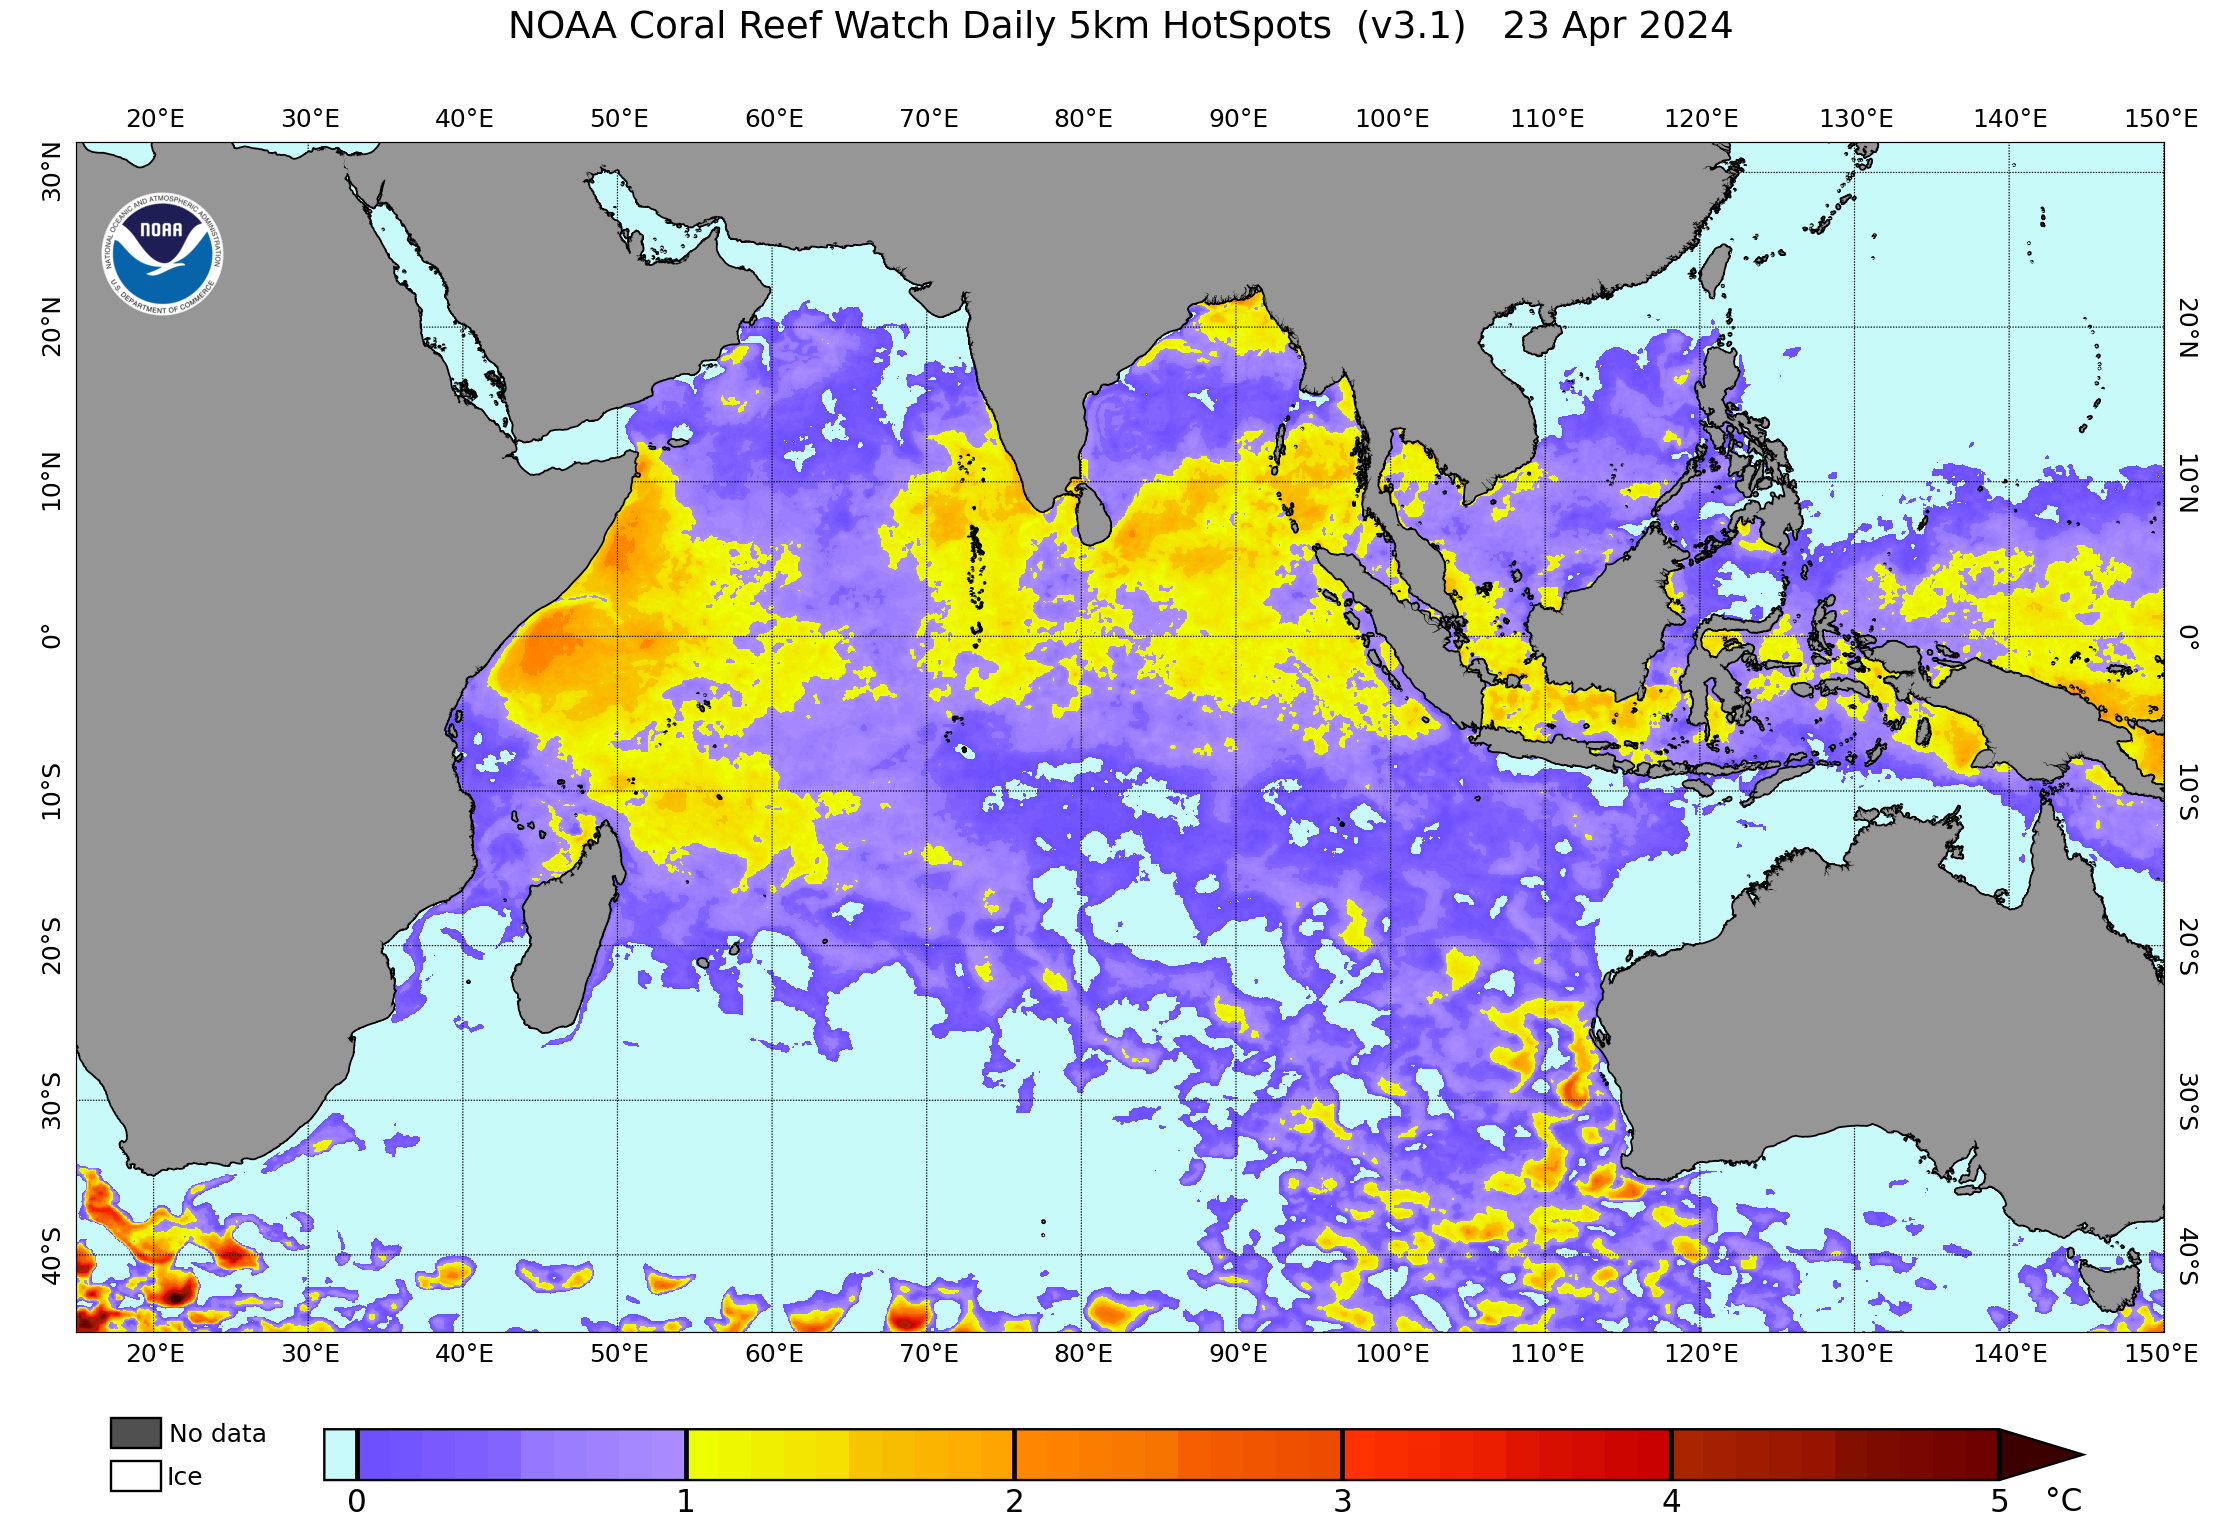
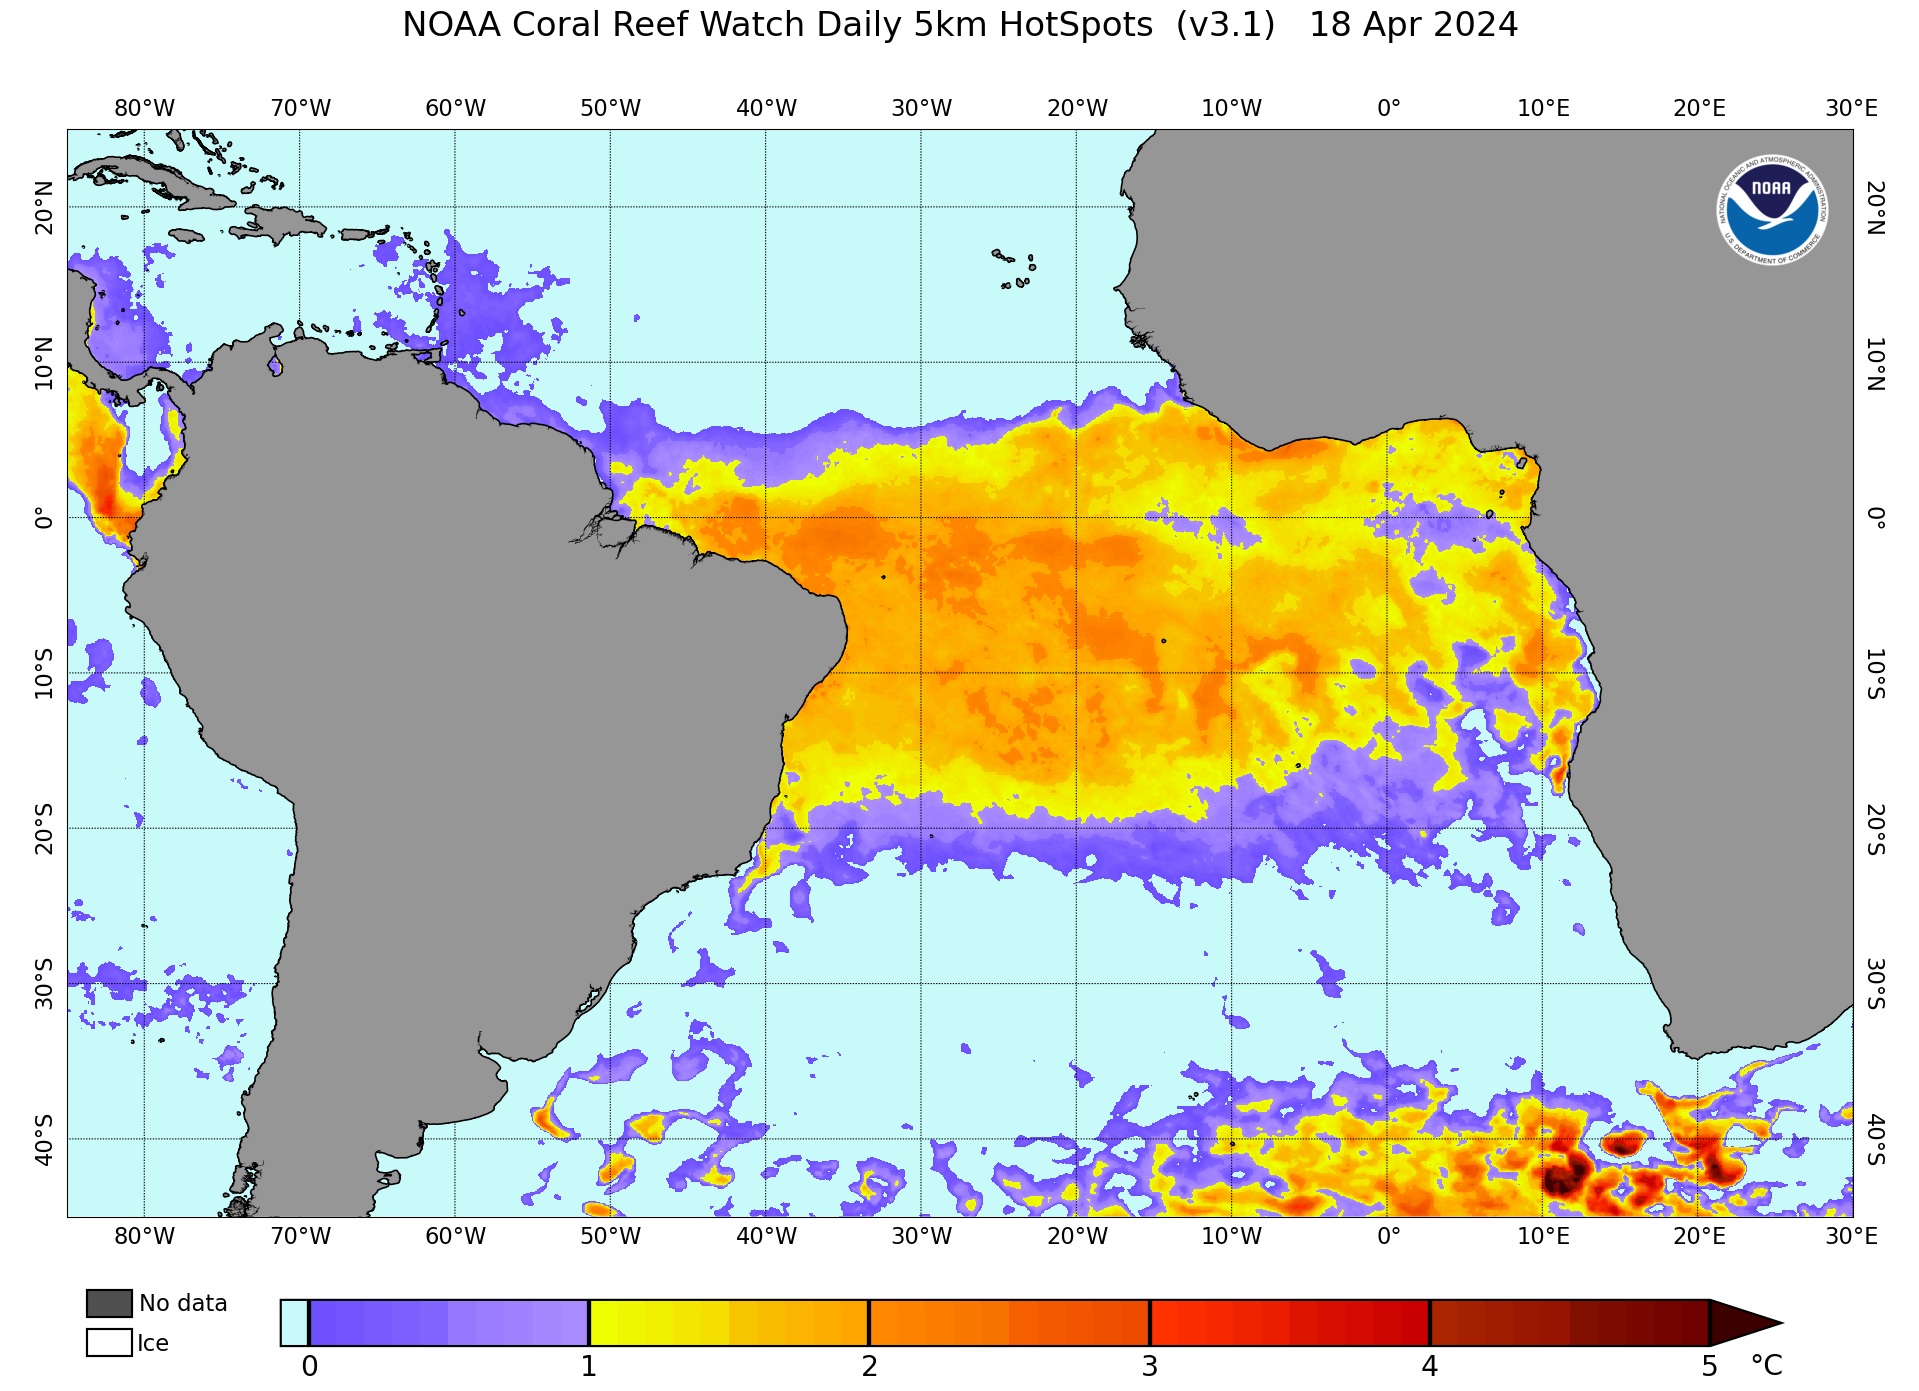
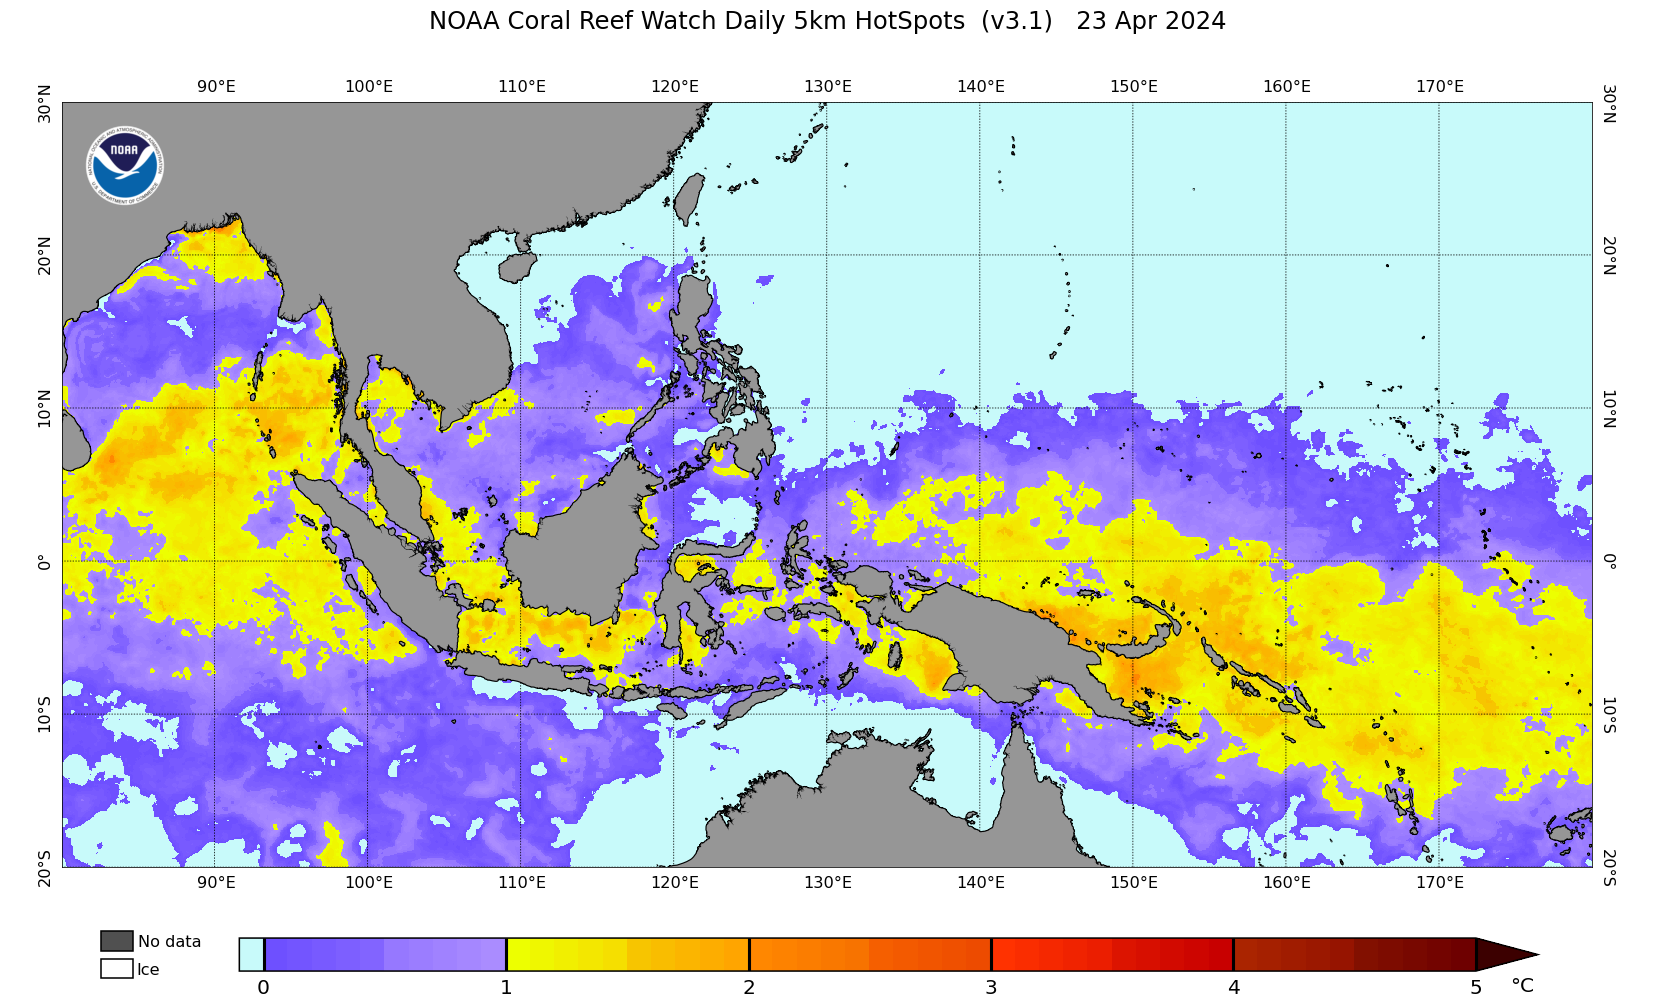
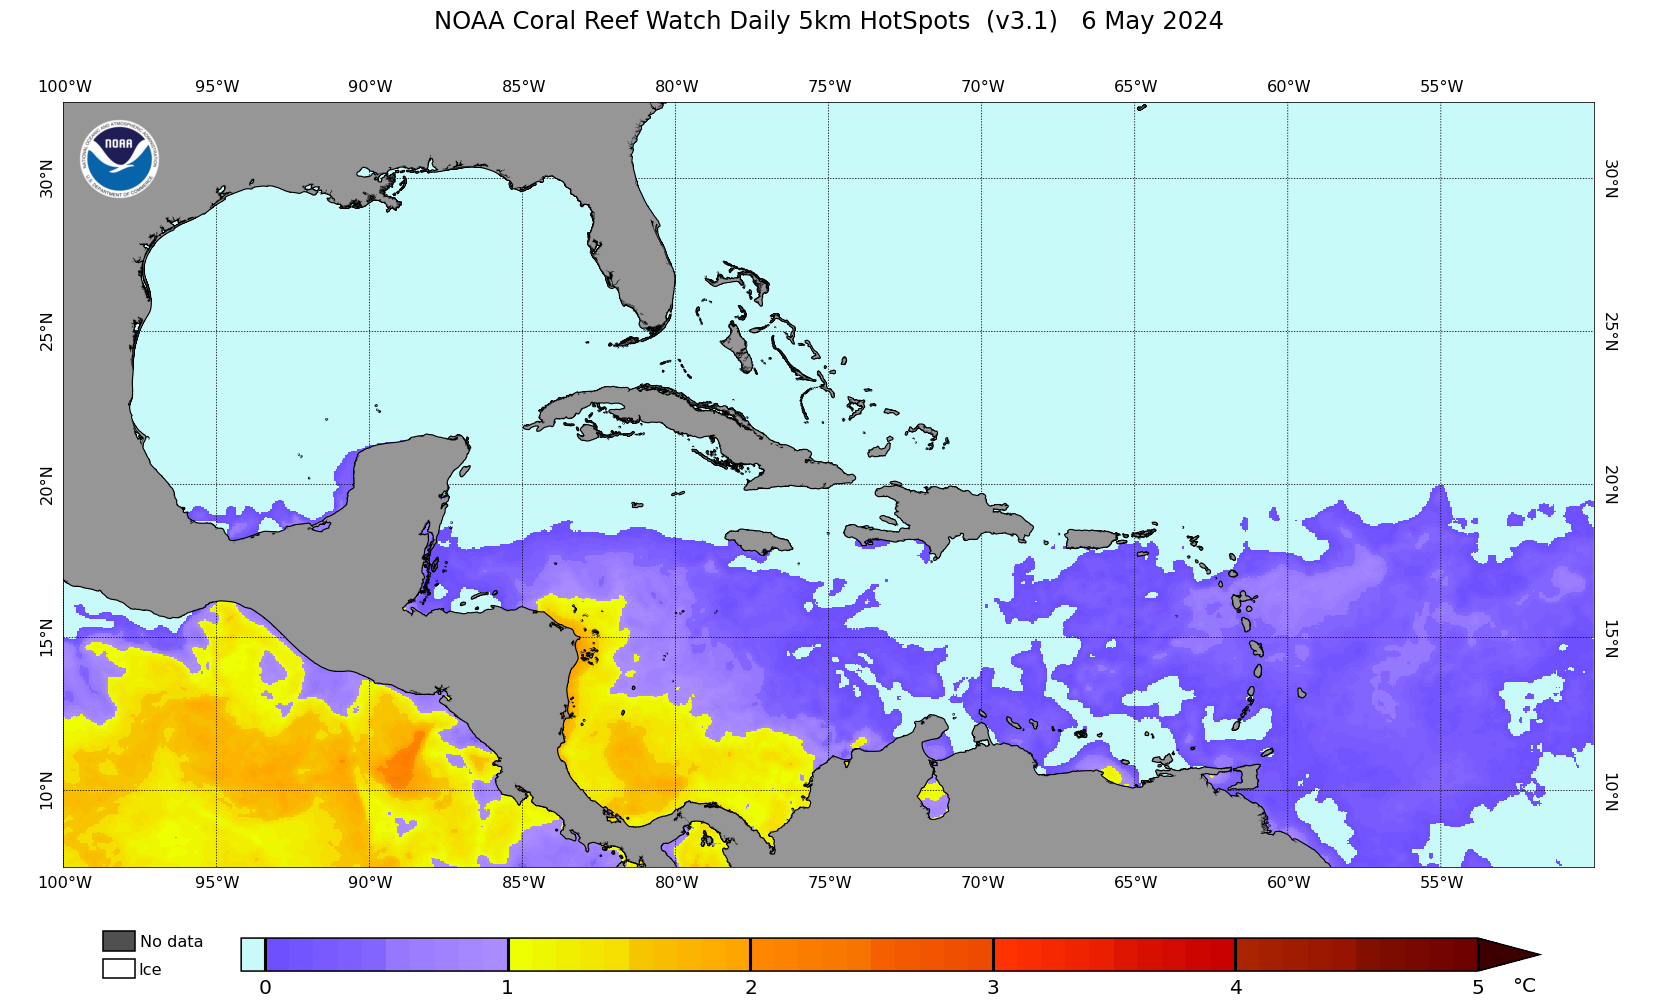
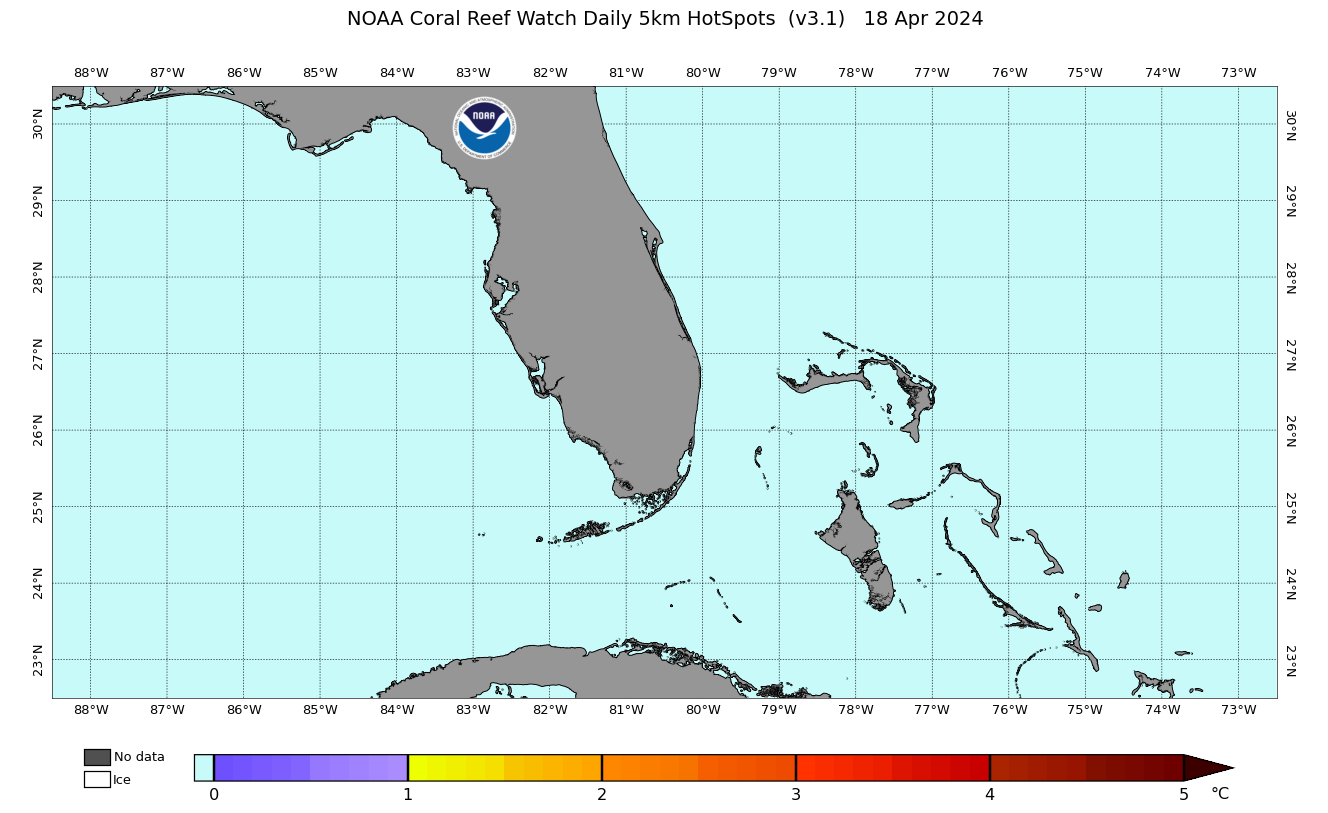
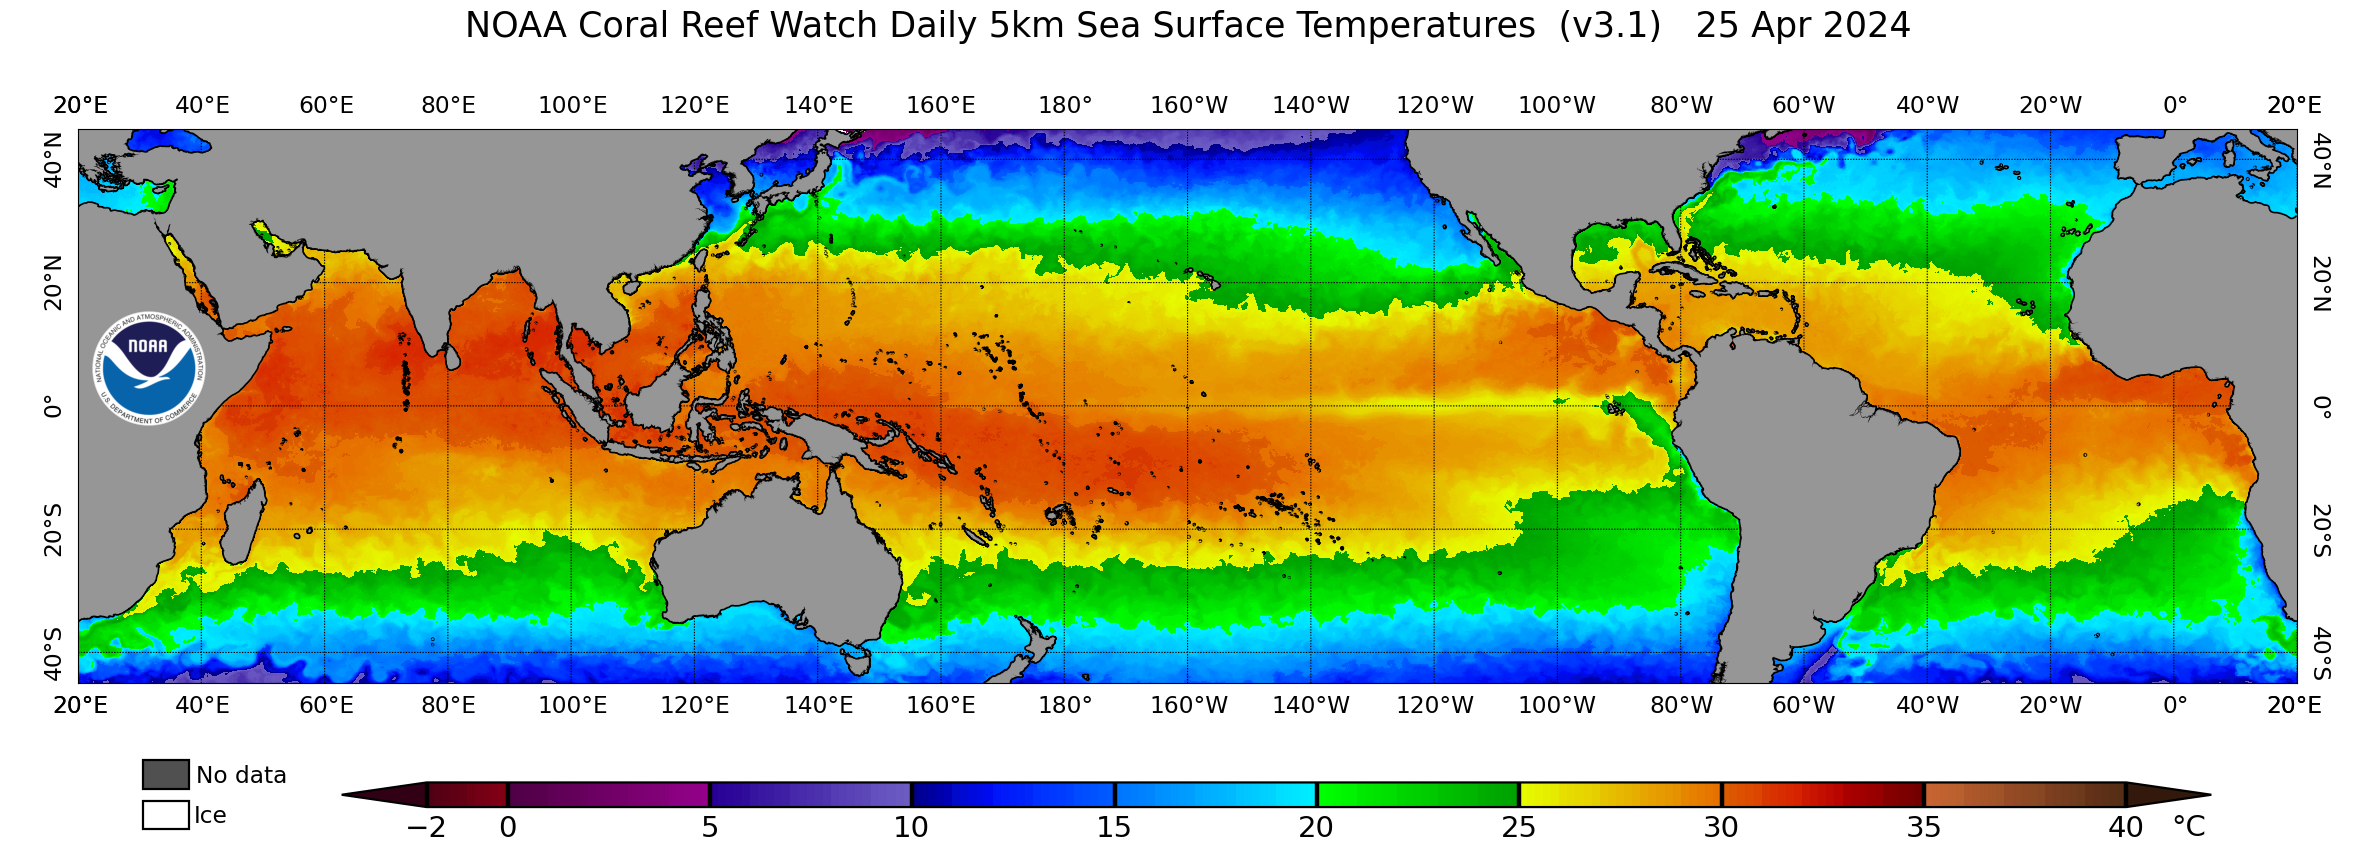
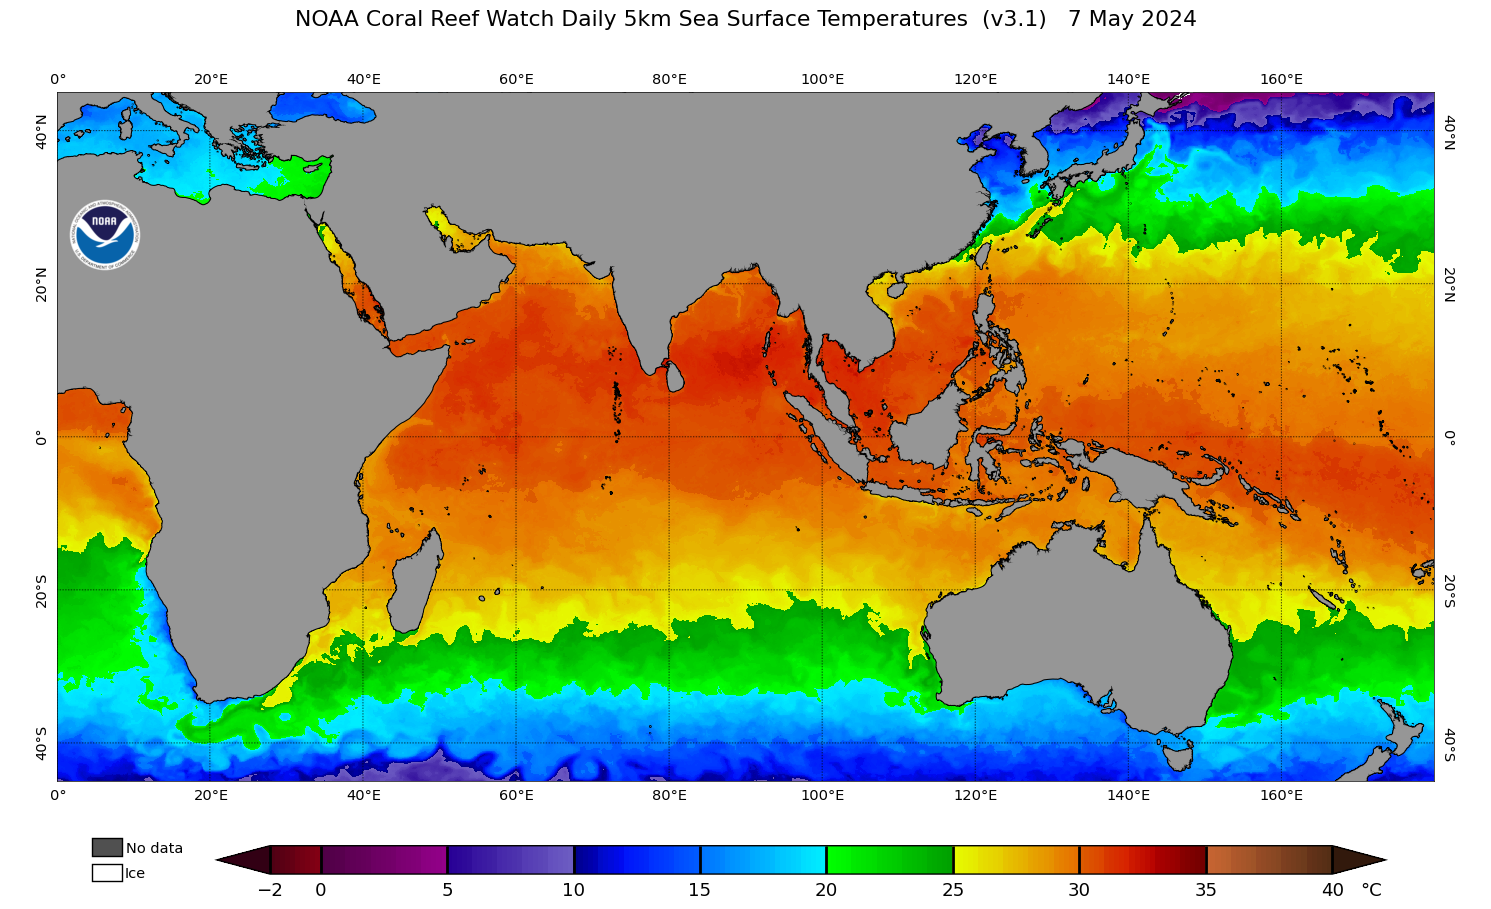
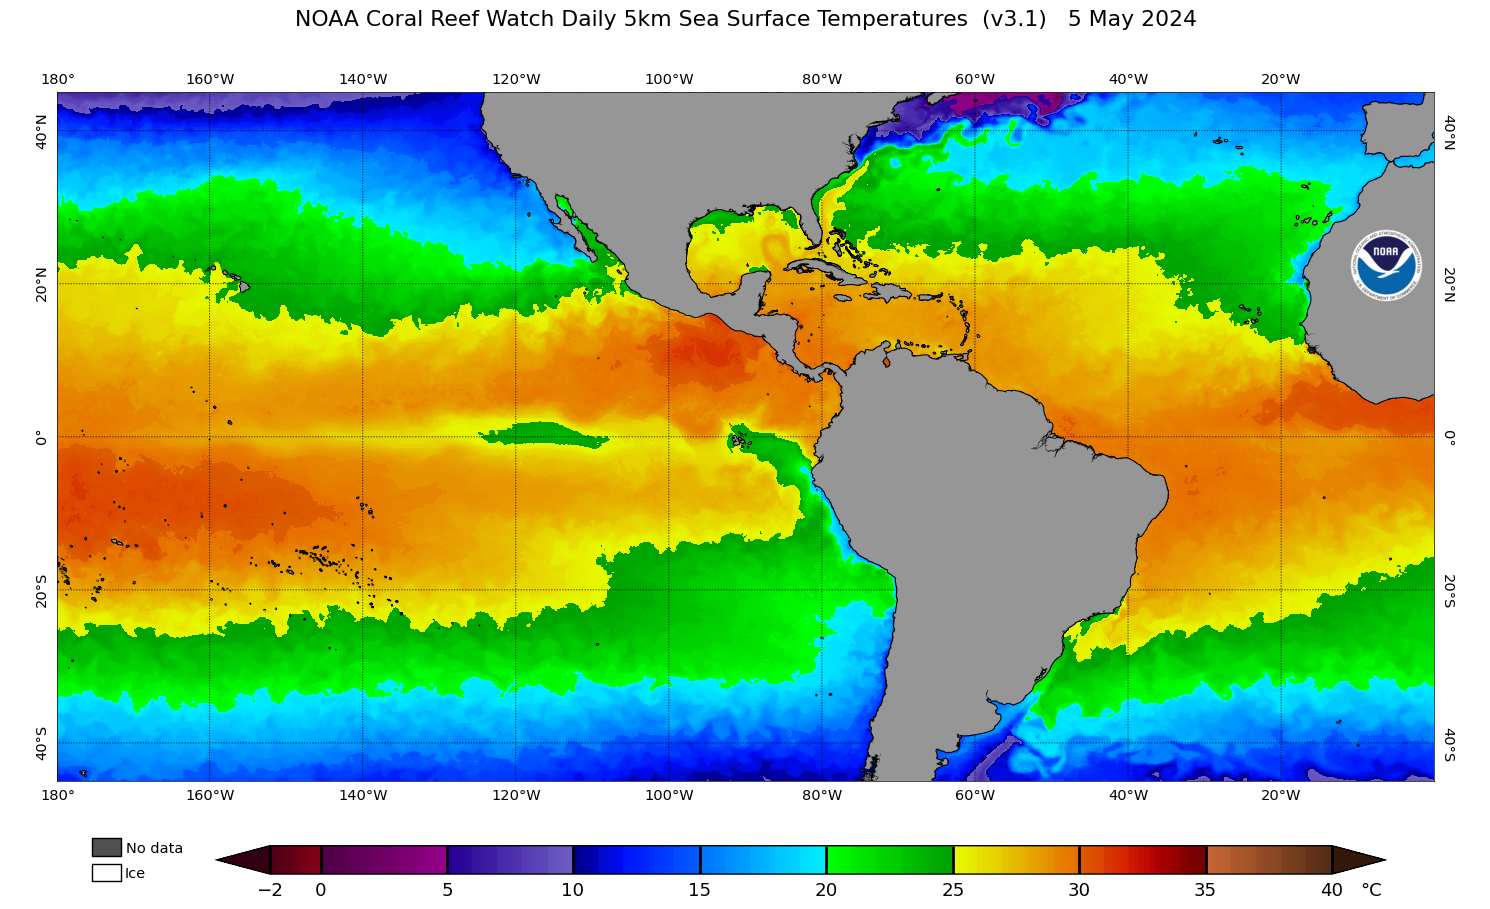
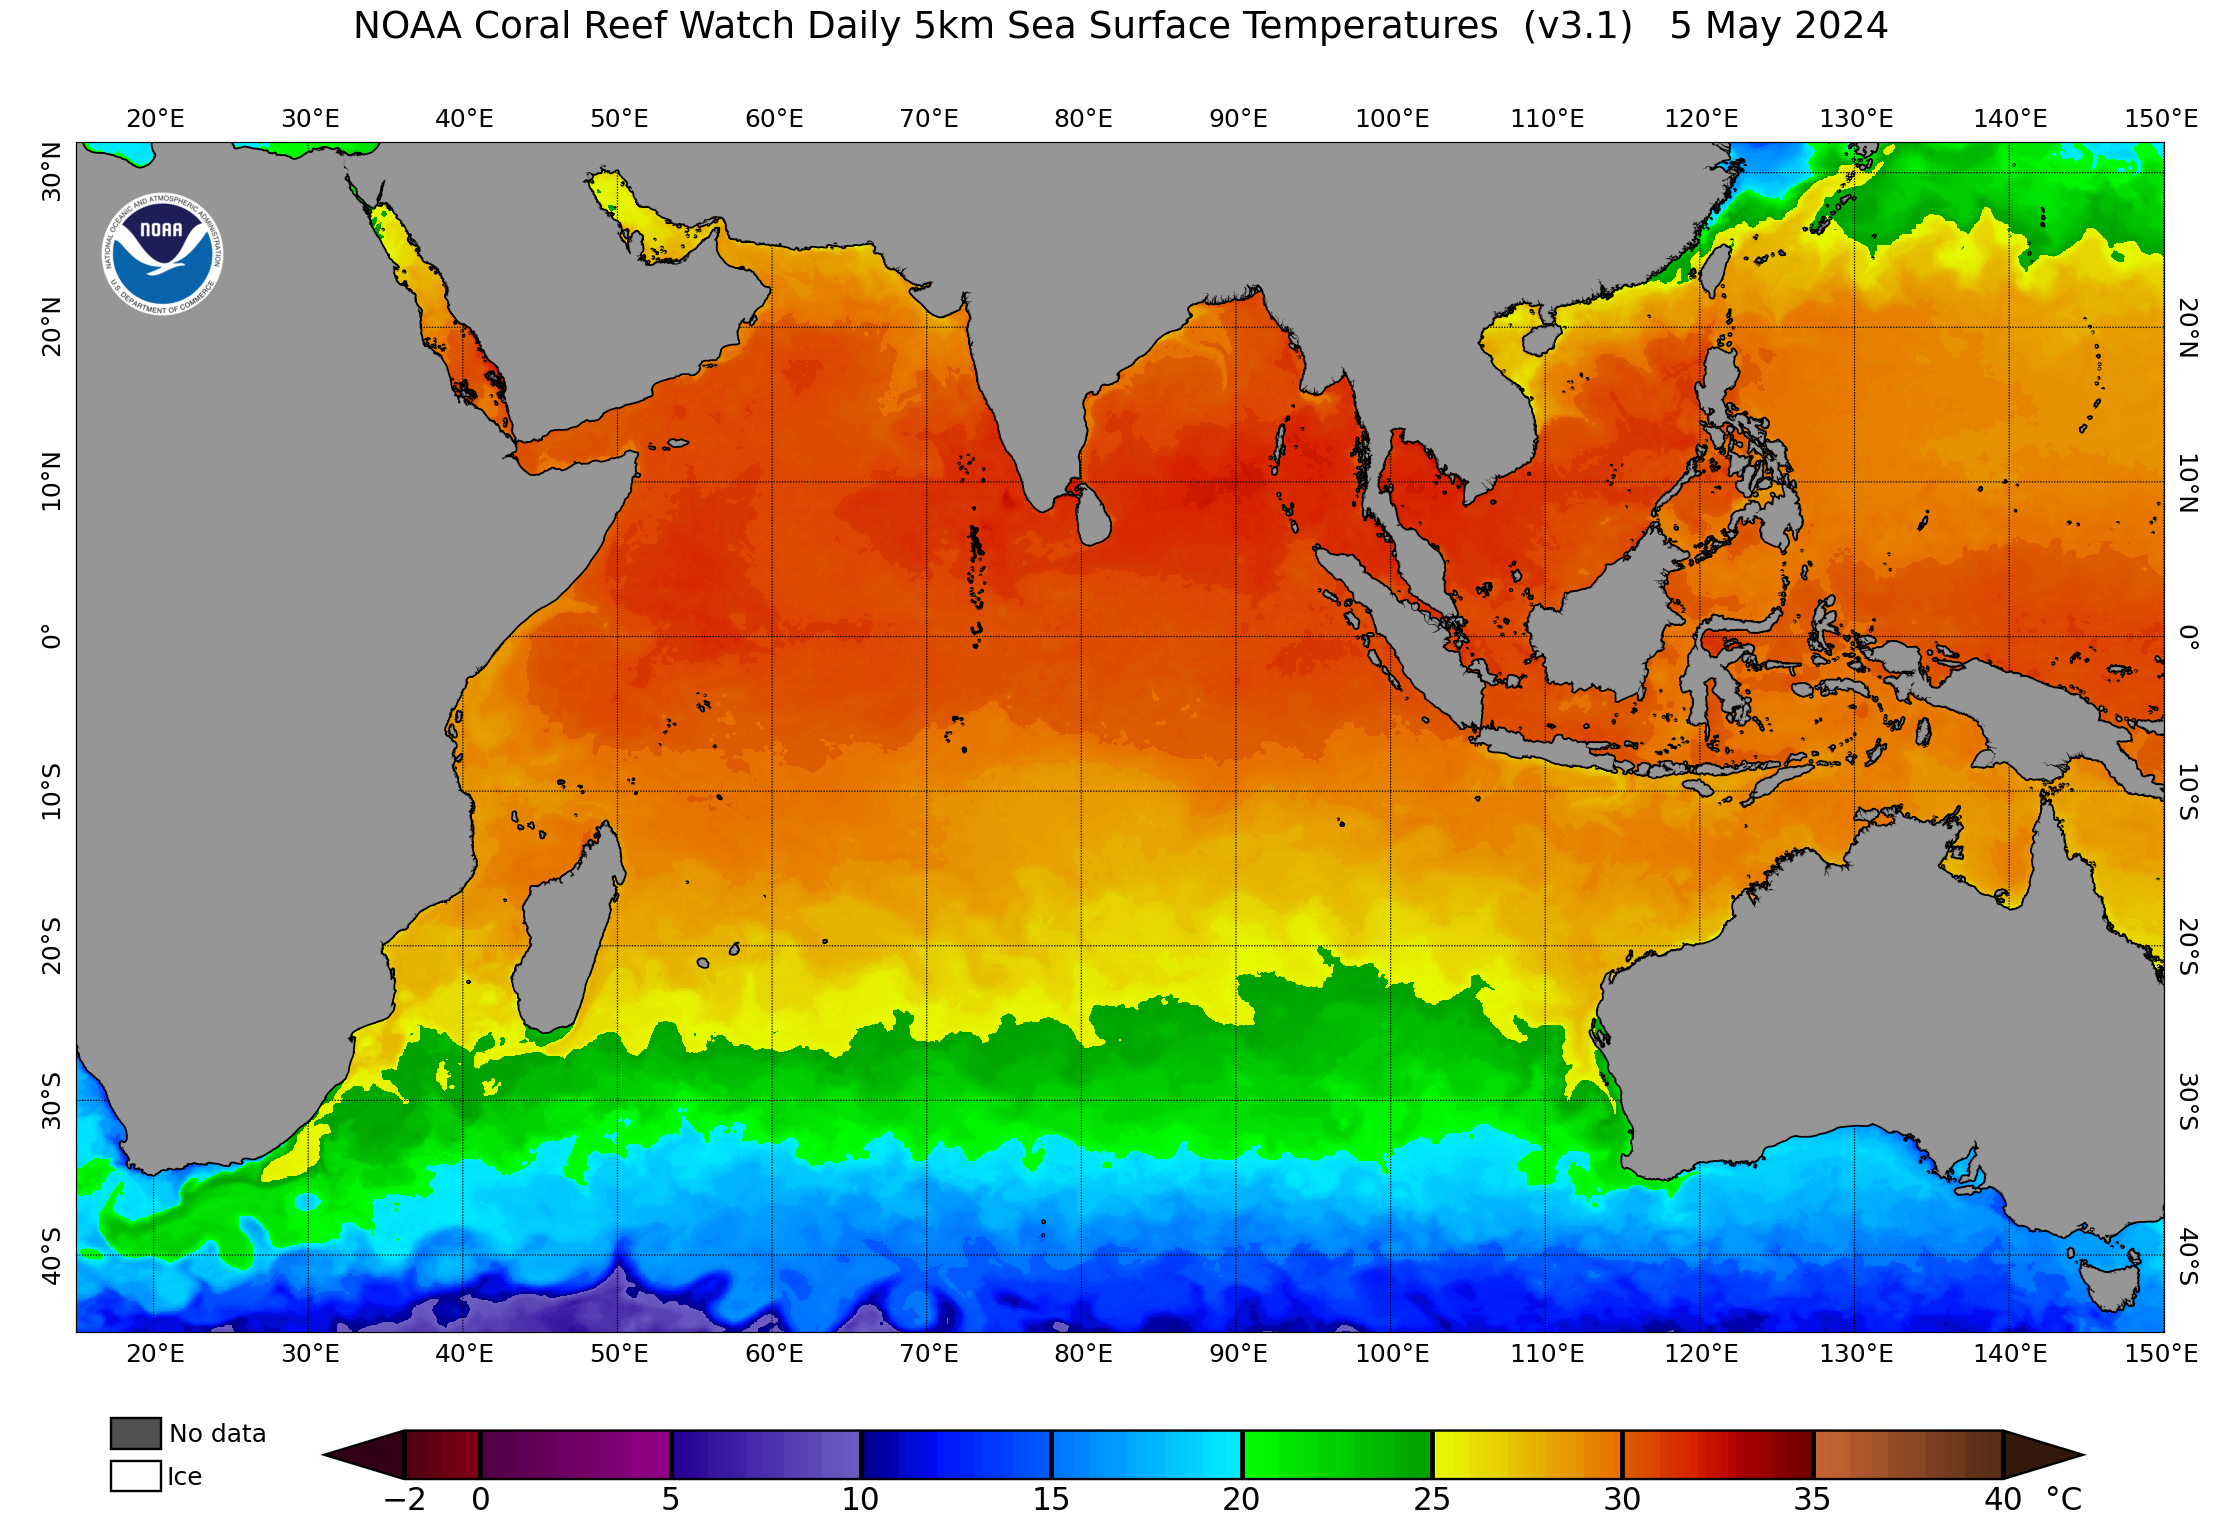
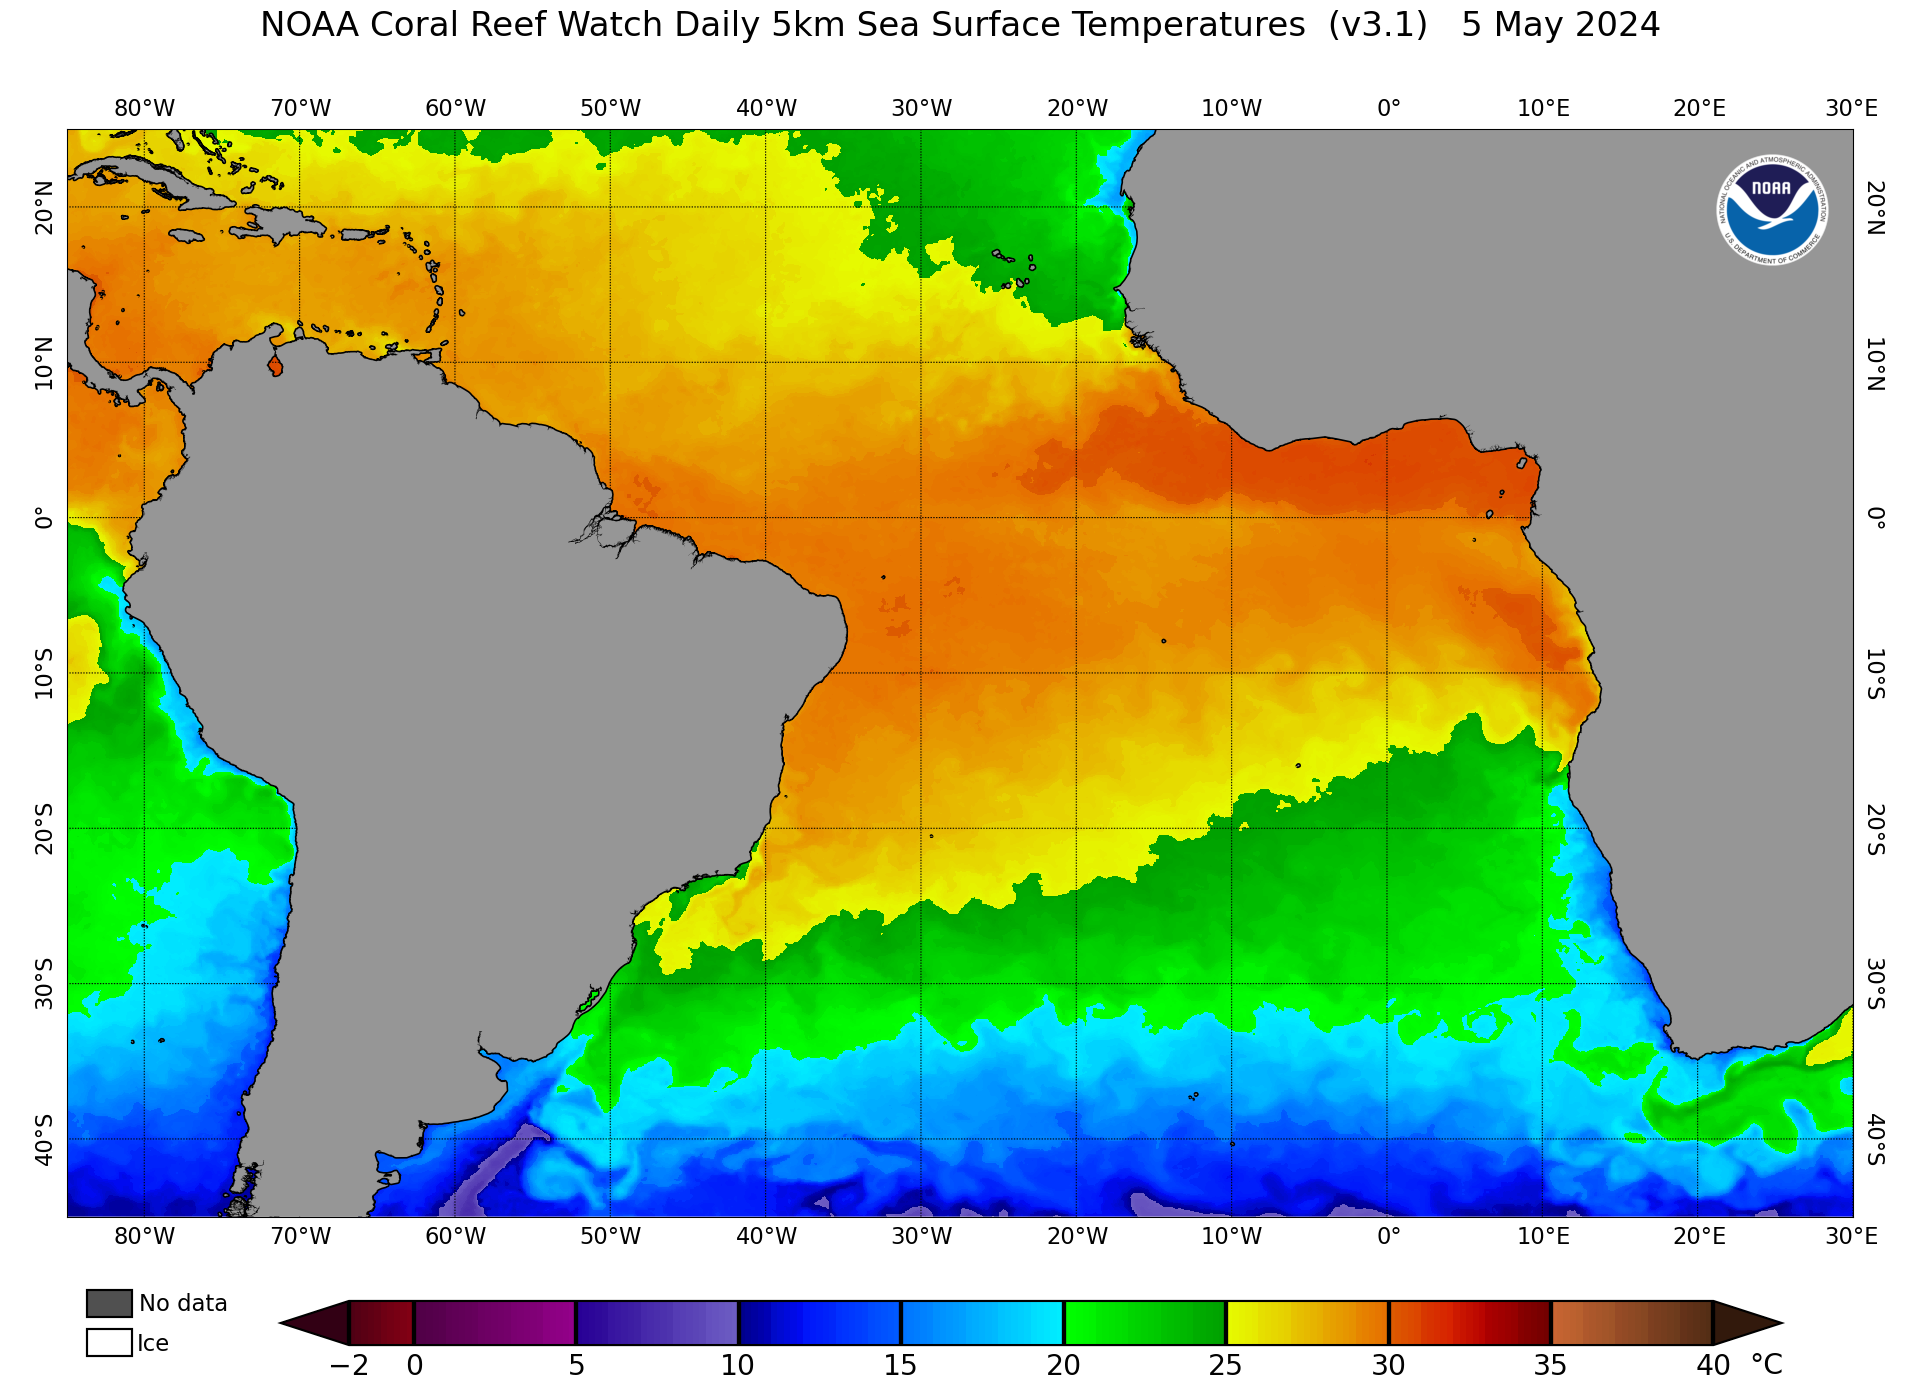
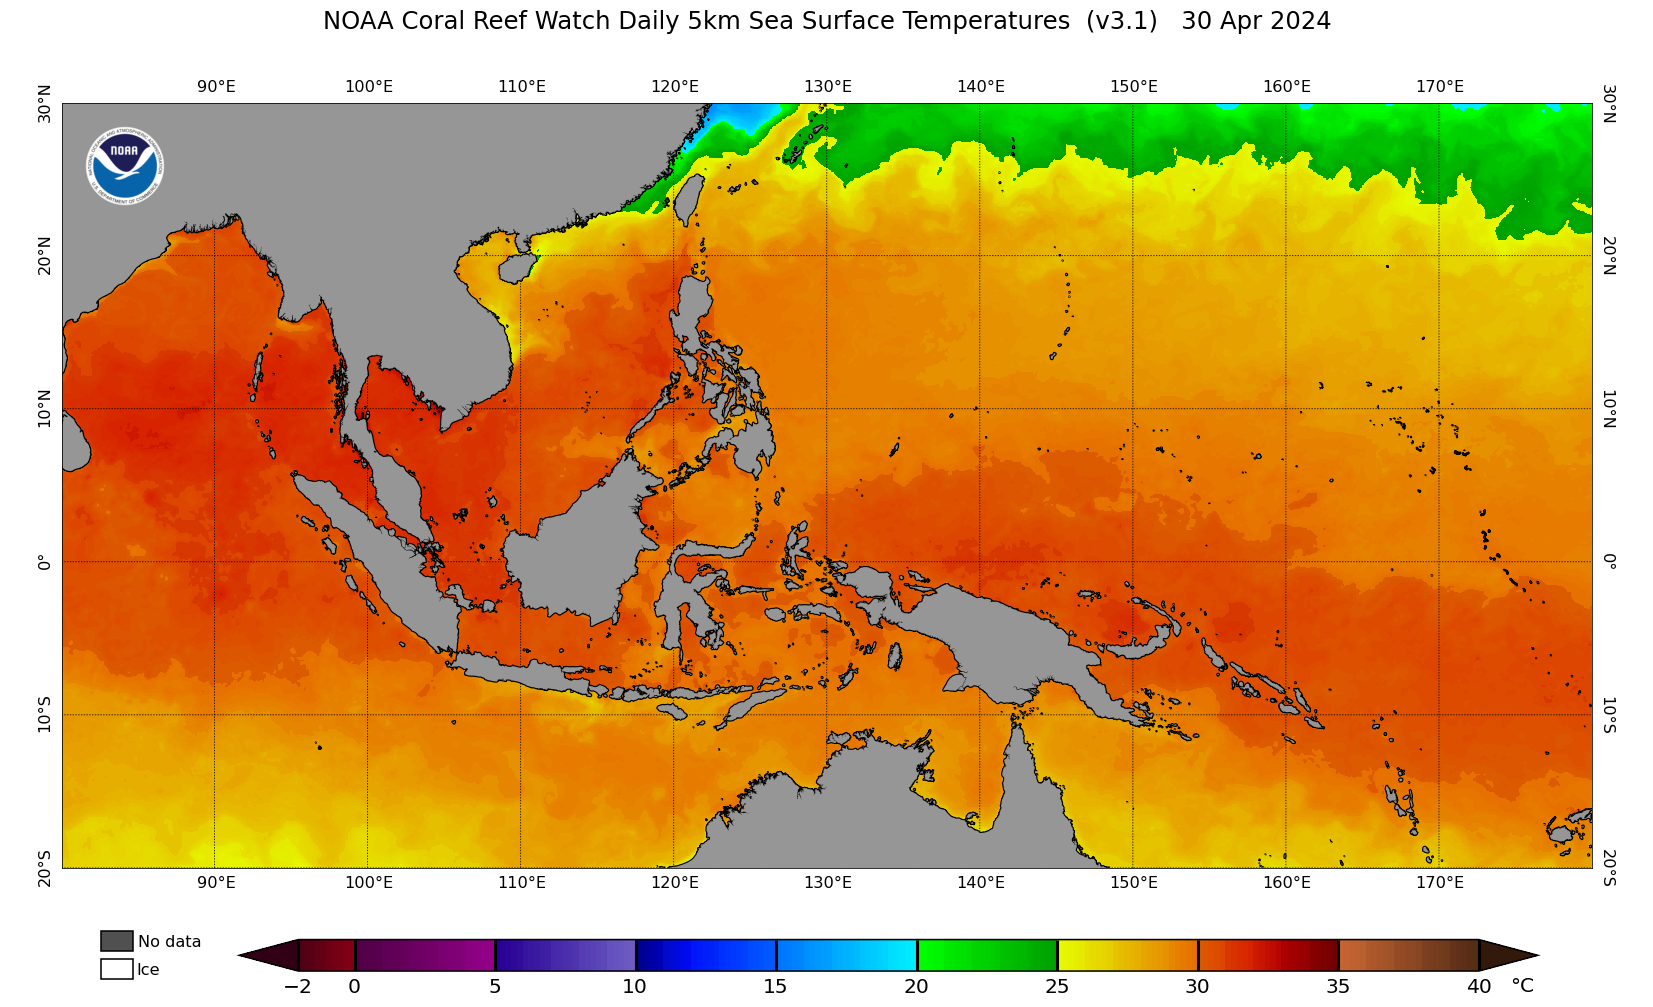
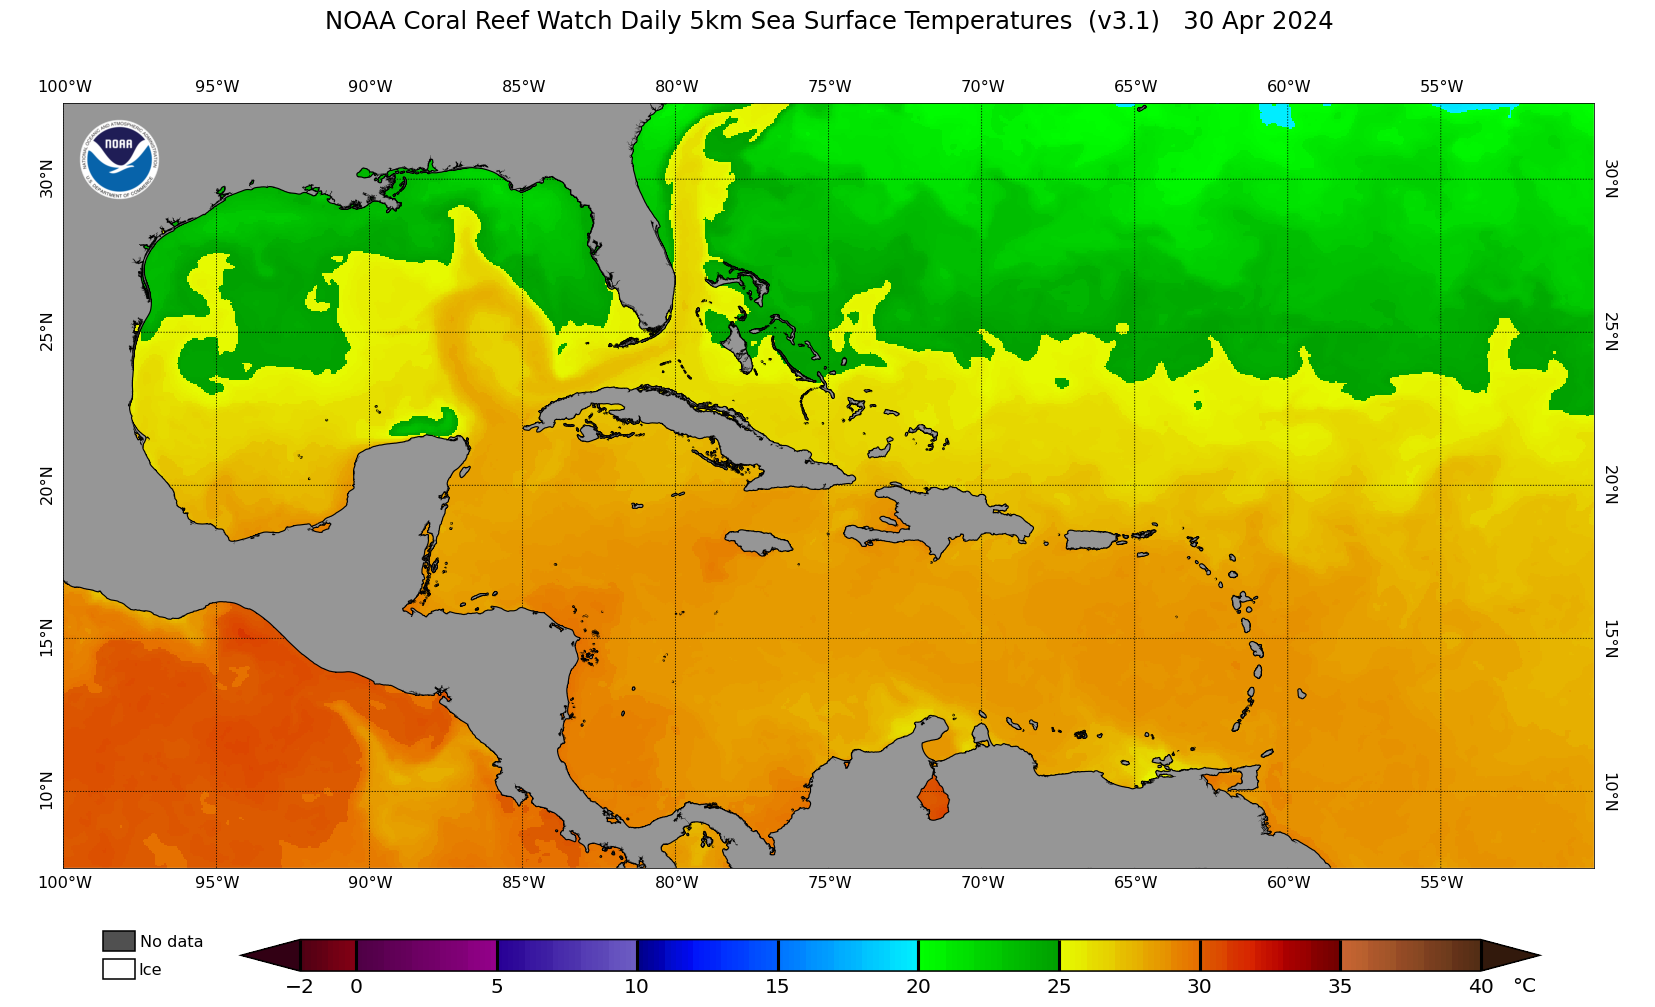
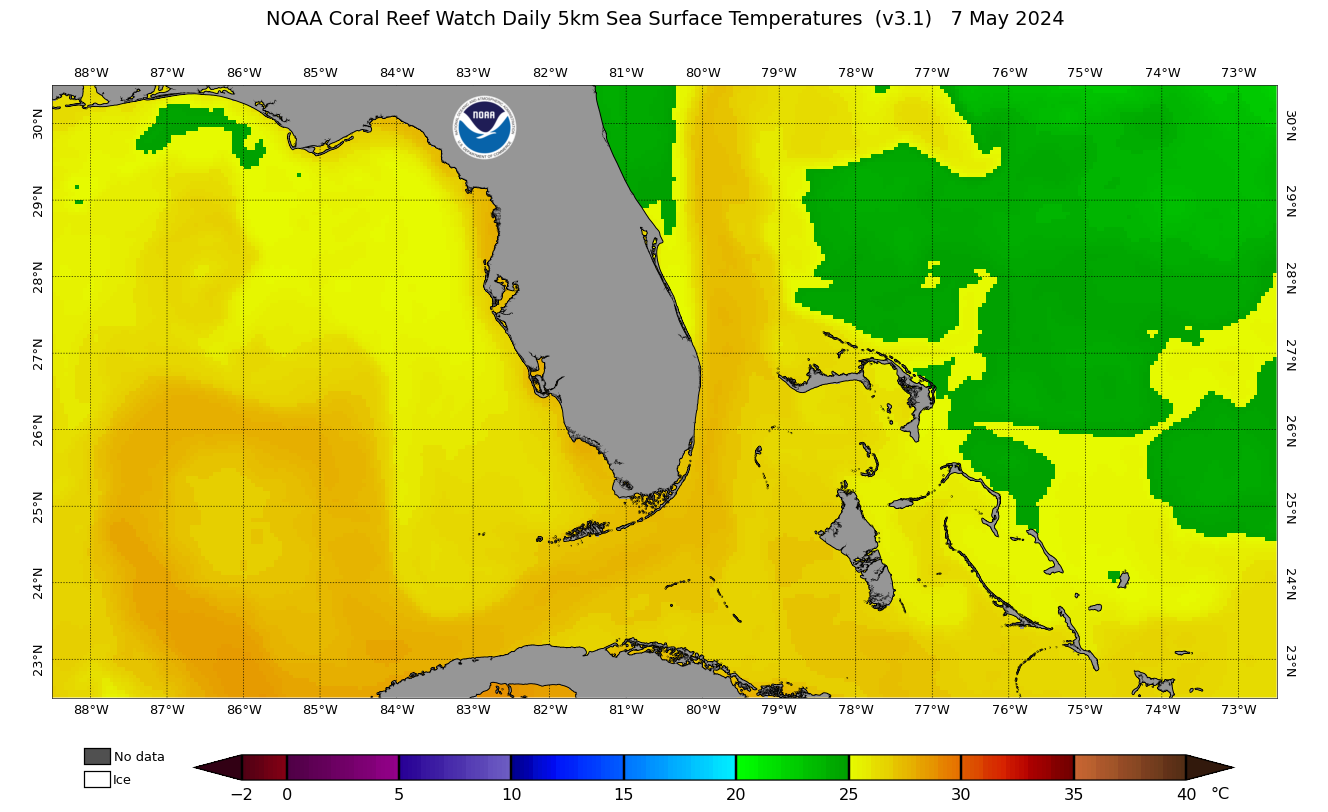
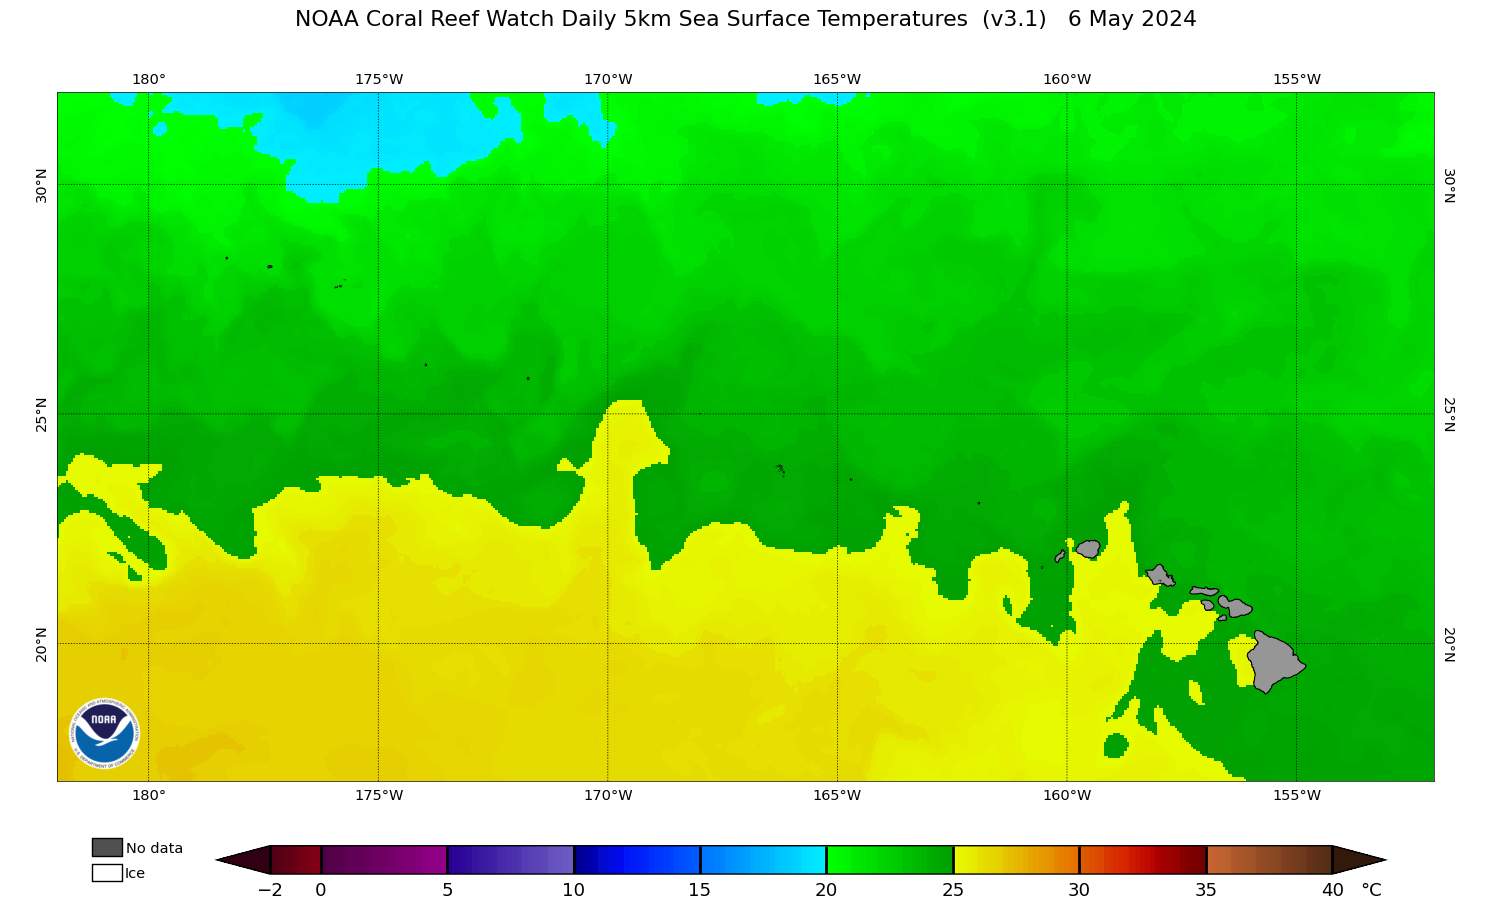
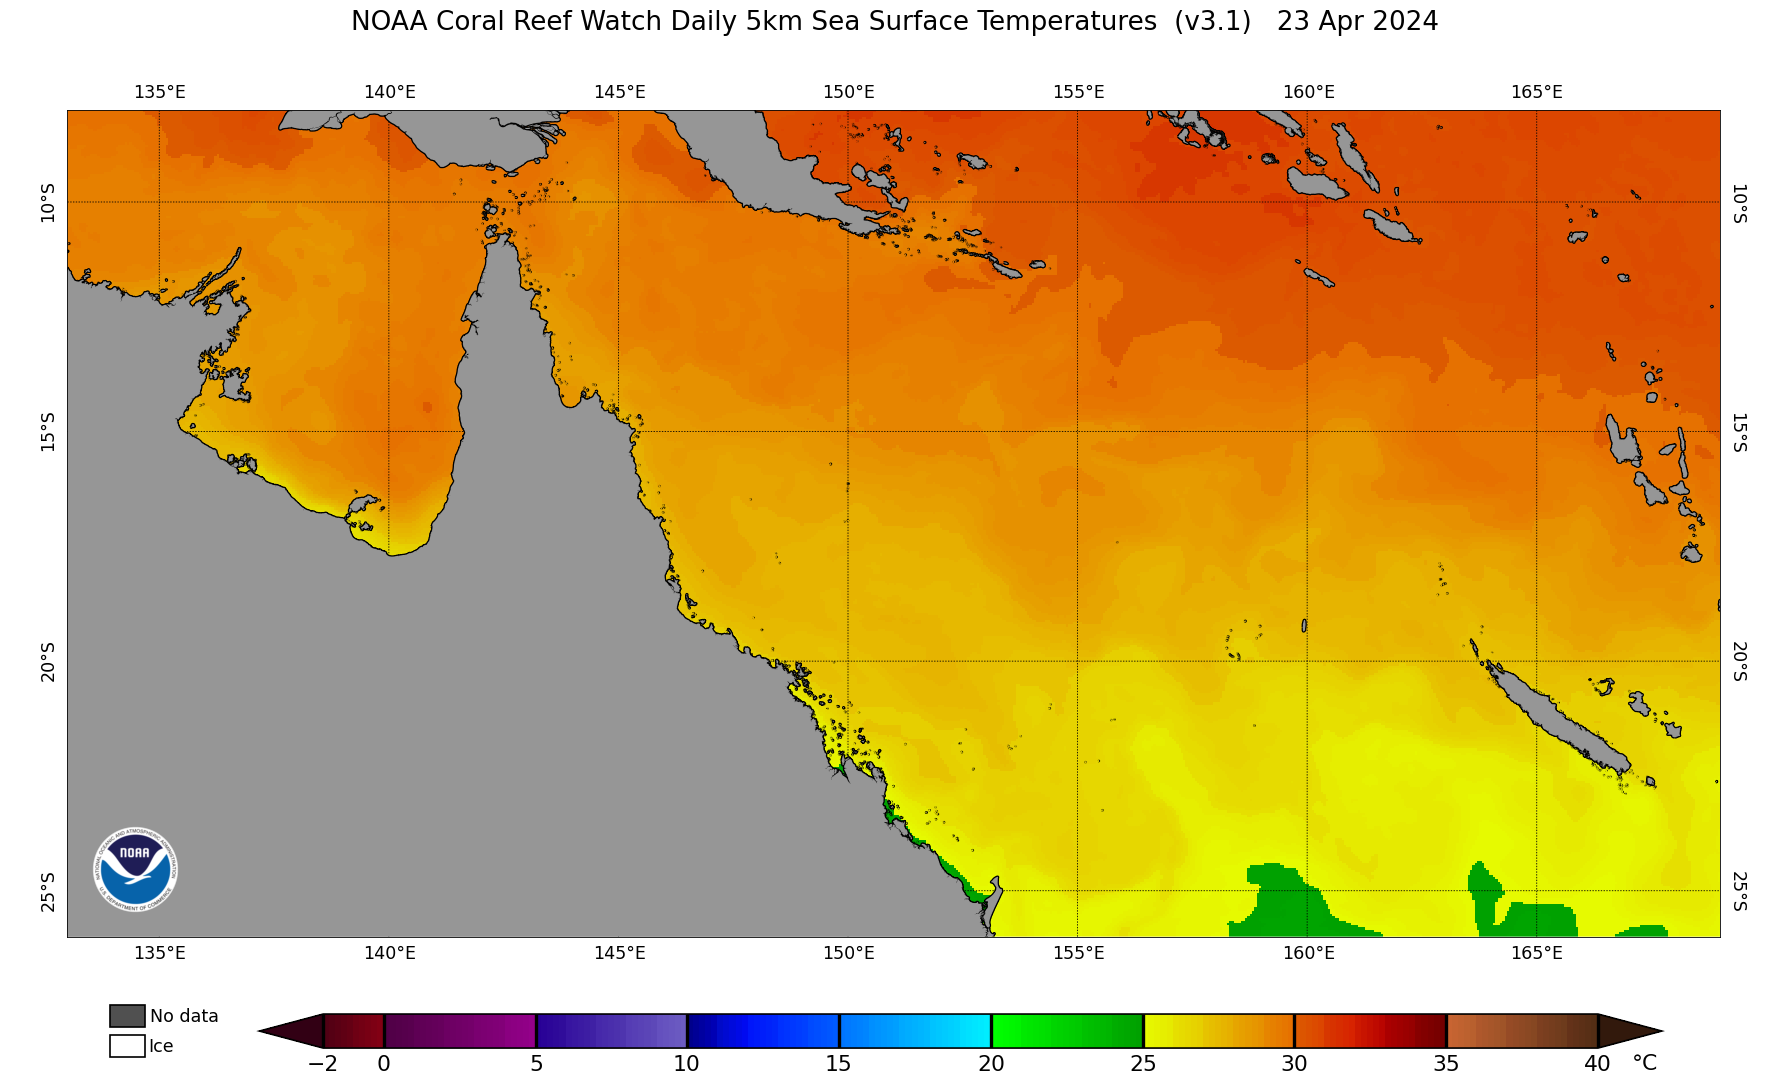
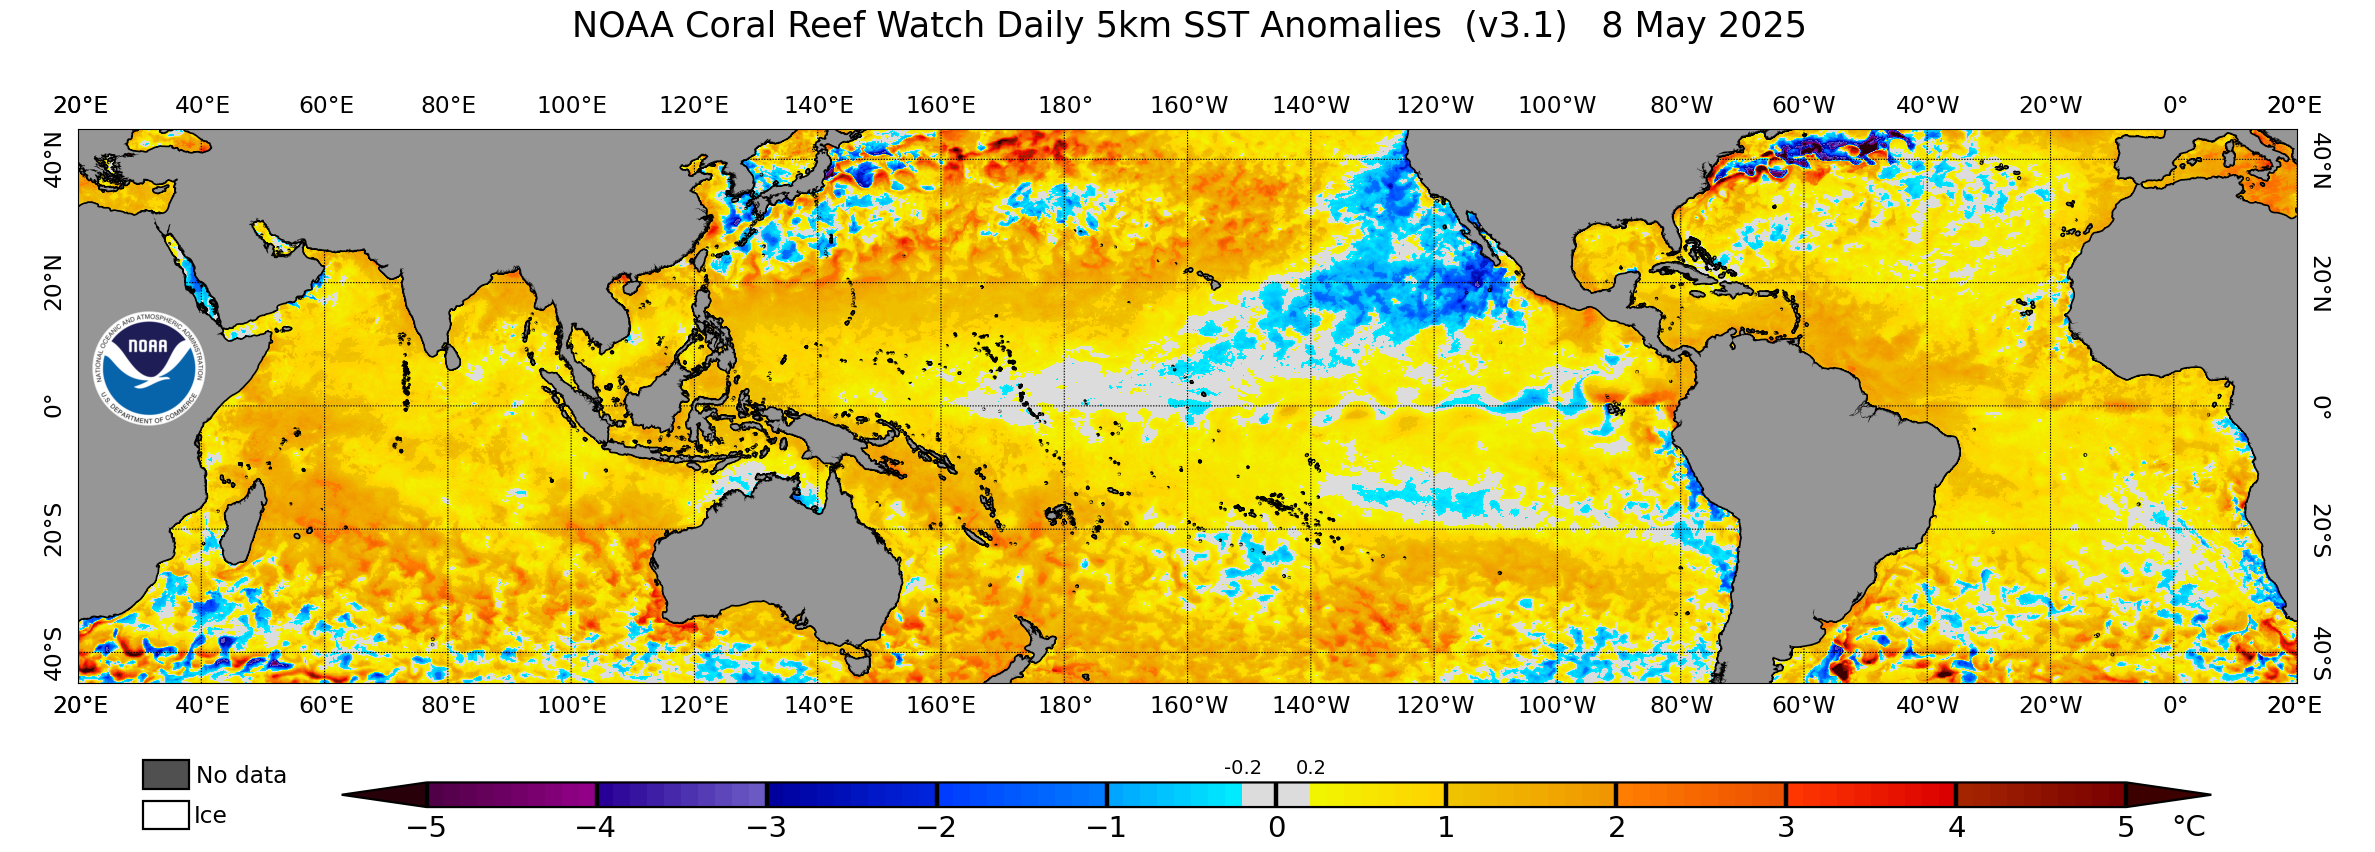
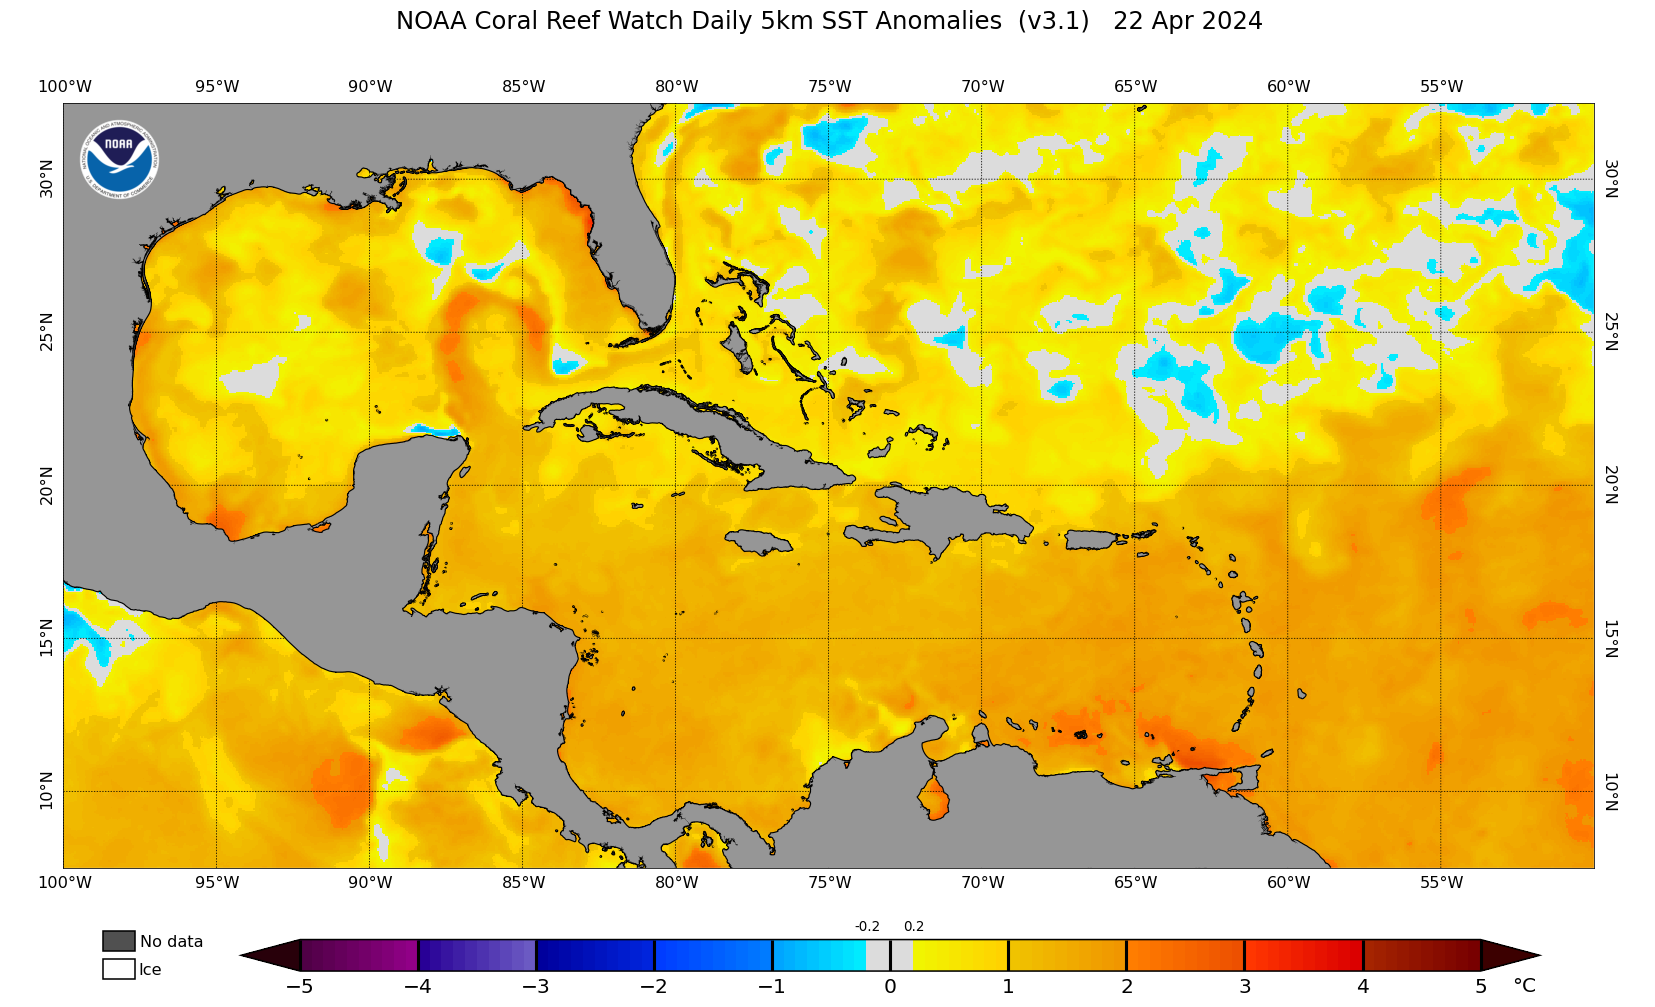
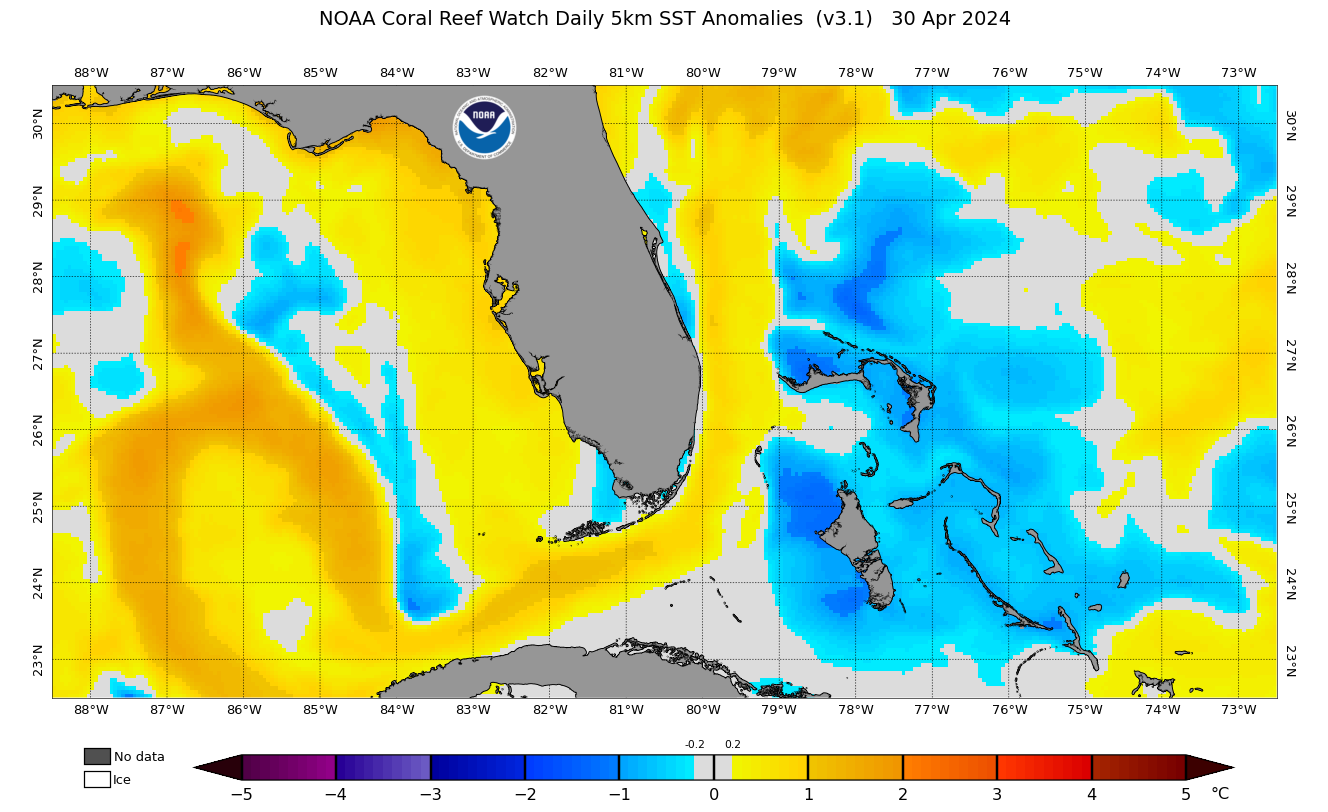
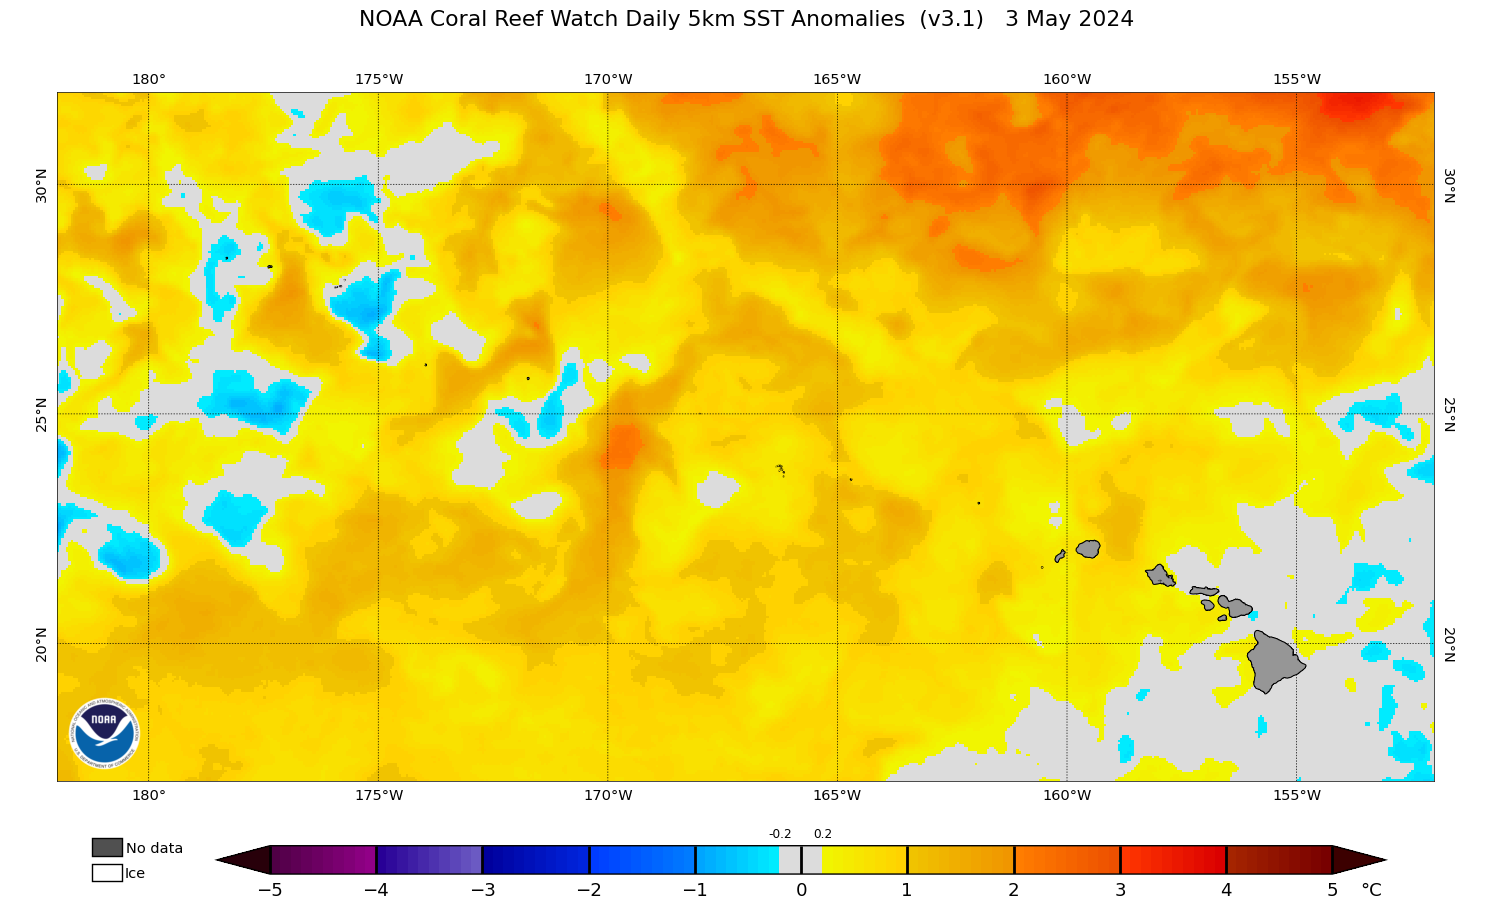
The NOAA Coral Reef Watch (CRW) daily global 5km (0.05 degree exactly) satellite coral bleaching heat stress monitoring product suite presented here is Version 3.1 (v3.1). It spans January 1, 1985 to present and is based on CRW's v3.1 daily global 5km satellite sea surface temperature (SST) data product known as CoralTemp.
This v3.1 5km product suite was developed based on user requests and to address errors identified in the source SST data for CRW's v3.0 products for some coral reef regions during 2013-2016. It now comprises the core of CRW's decision support system for coral reef management, providing service at or near reef-scales, allowing direct monitoring of 95% of global coral reefs and significantly reducing data gaps caused by cloud cover.
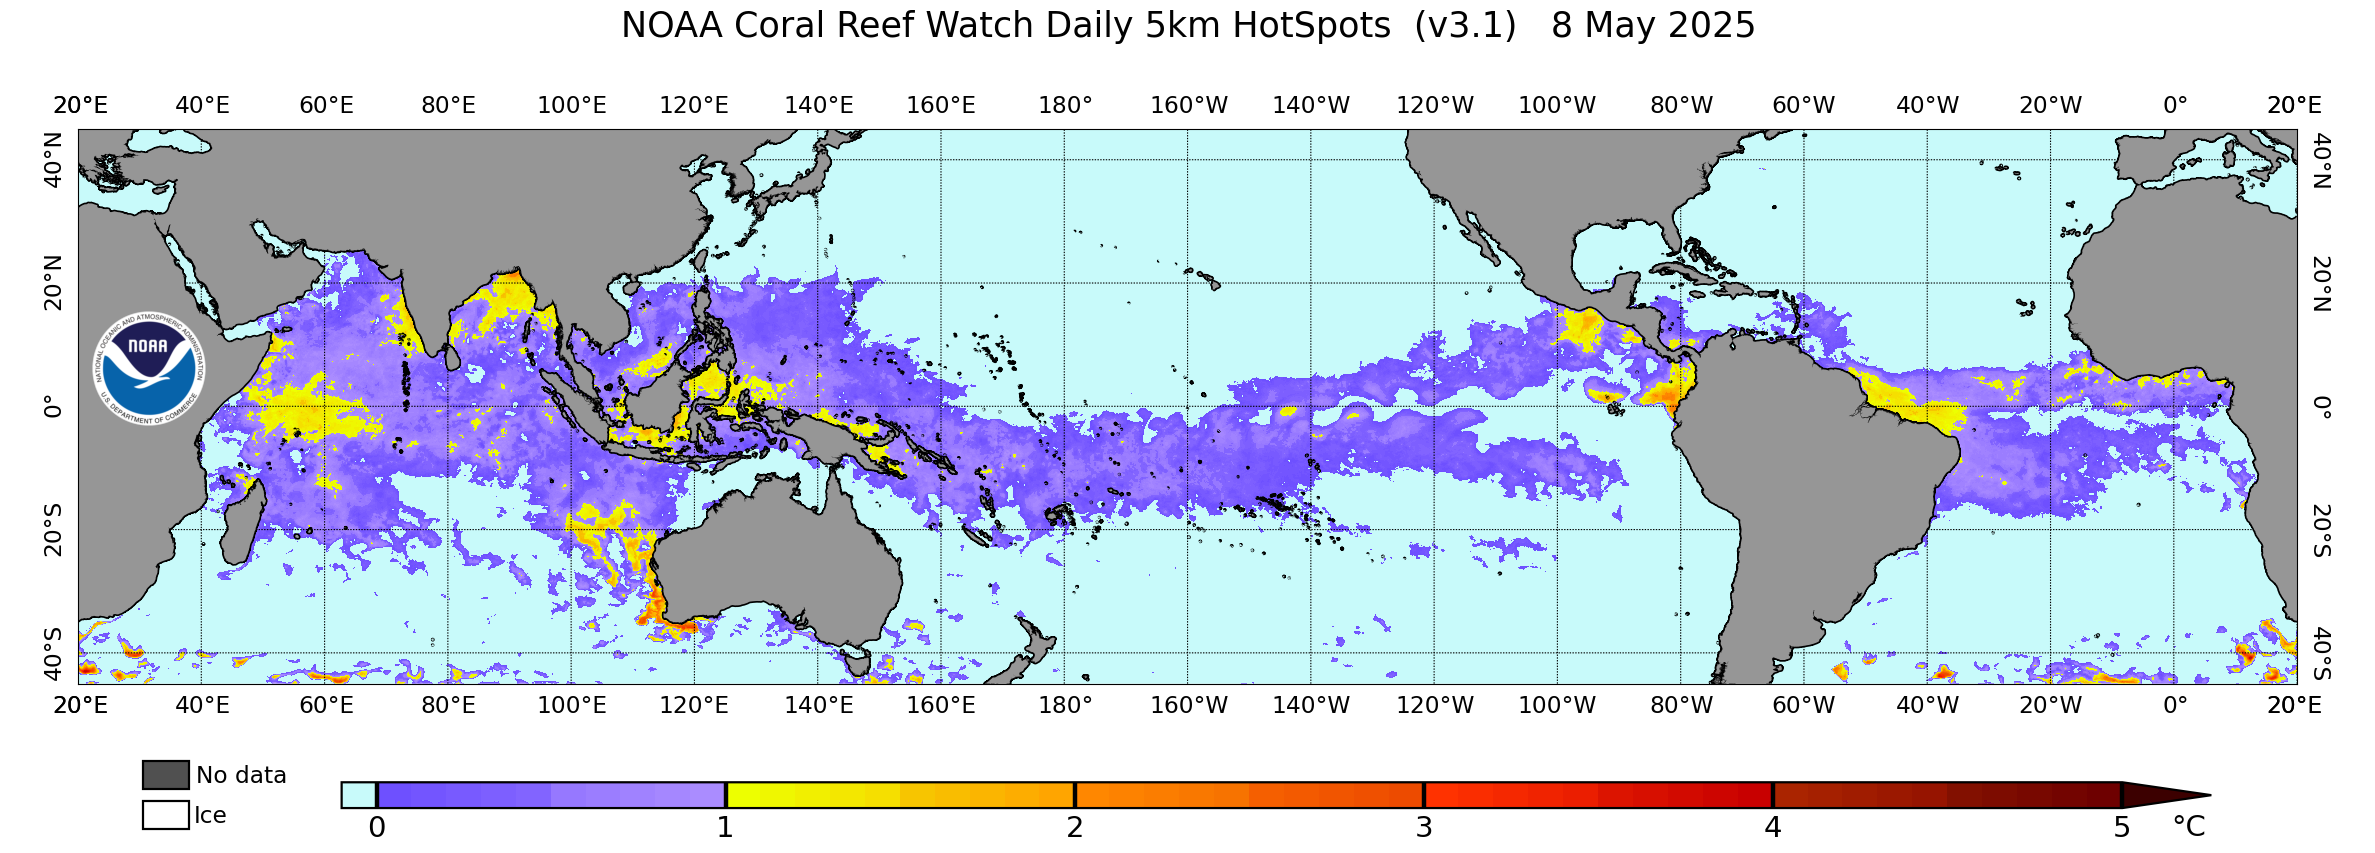
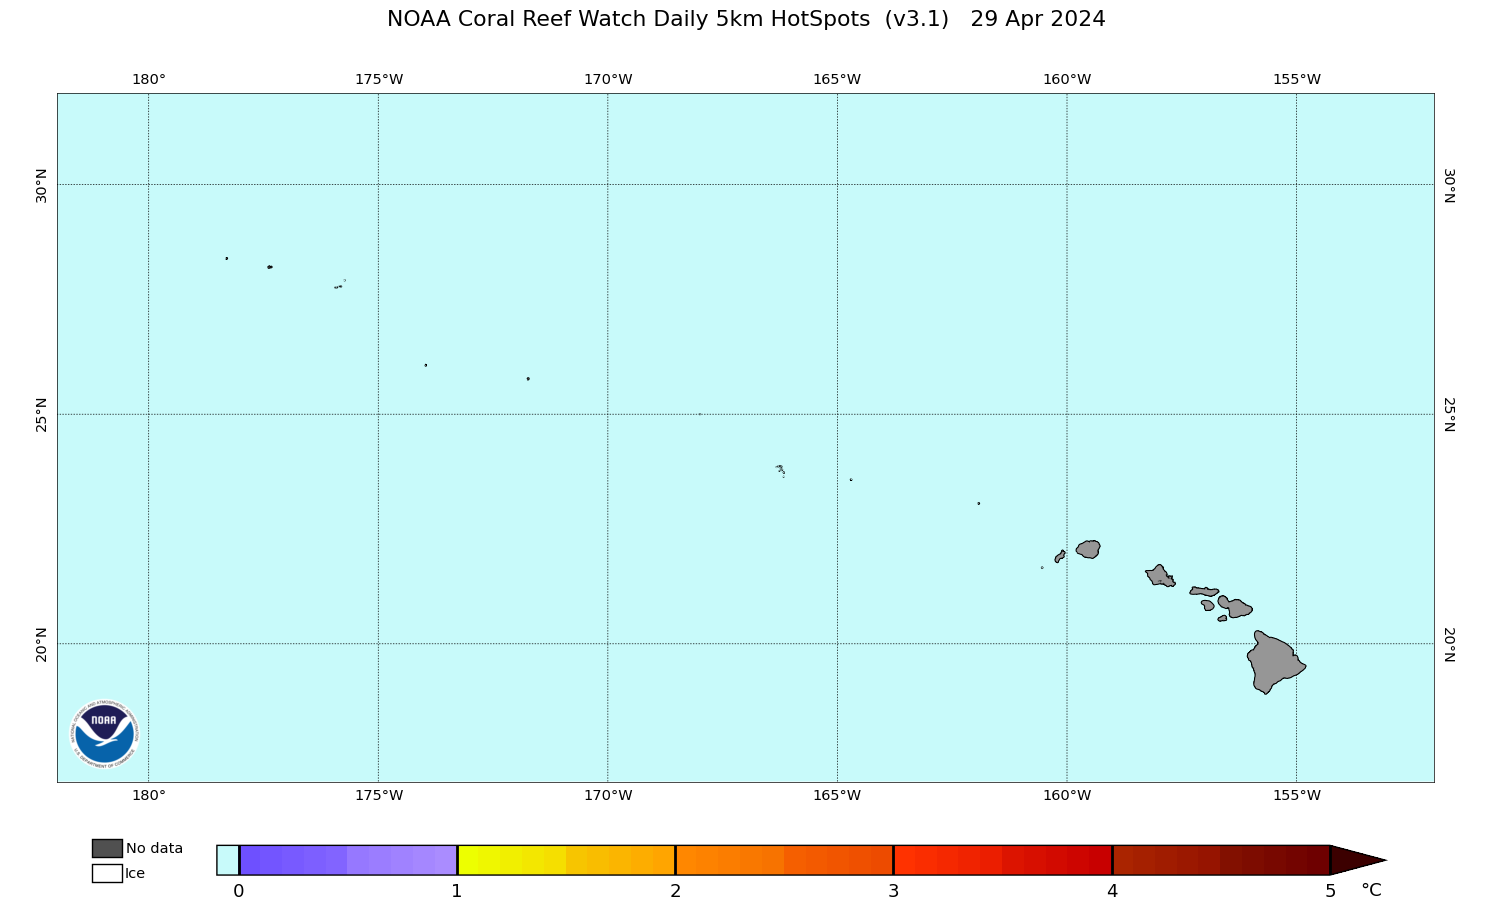
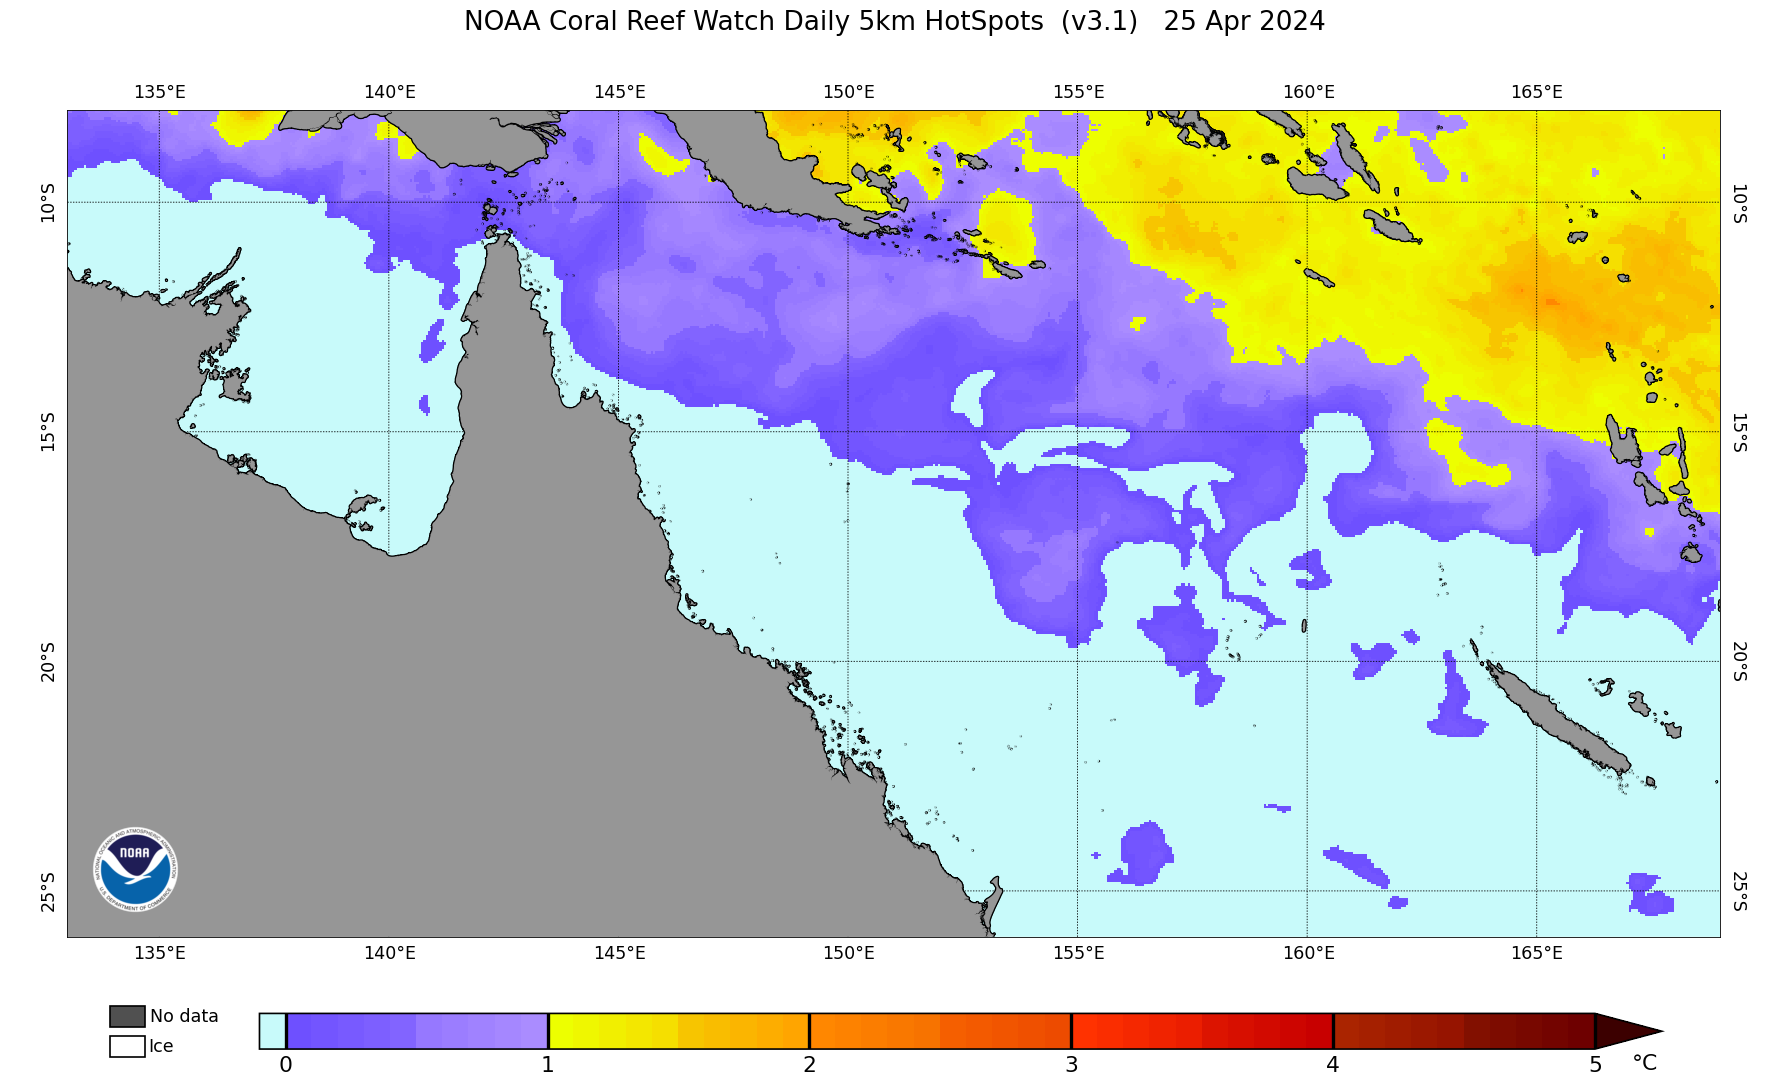
CRW's current v3.1 daily global 5km satellite products include: SST (a.k.a. CoralTemp), SST Anomaly, Coral Bleaching HotSpot, coral bleaching Degree Heating Week (DHW), a single-day Bleaching Alert Area, a 7-day maximum Bleaching Alert Area, and a 7-day SST Trend. CRW produces year-to-date (for the current year), monthly, and annual composites of the SST, SST Anomaly, Coral Bleaching HotSpot, DHW, and Bleaching Alert Area products. We also provide the most recent 30-day and 90-day animations of the SST, SST Anomaly, Coral Bleaching HotSpot, DHW, Bleaching Alert Area (7-day maximum), and SST Trend products. In addition, we offer daily 5km Regional Virtual Stations/Bleaching Heat Stress Gauges and a free, automated 5km Satellite Bleaching Alert Email System that are based on the global products presented here.
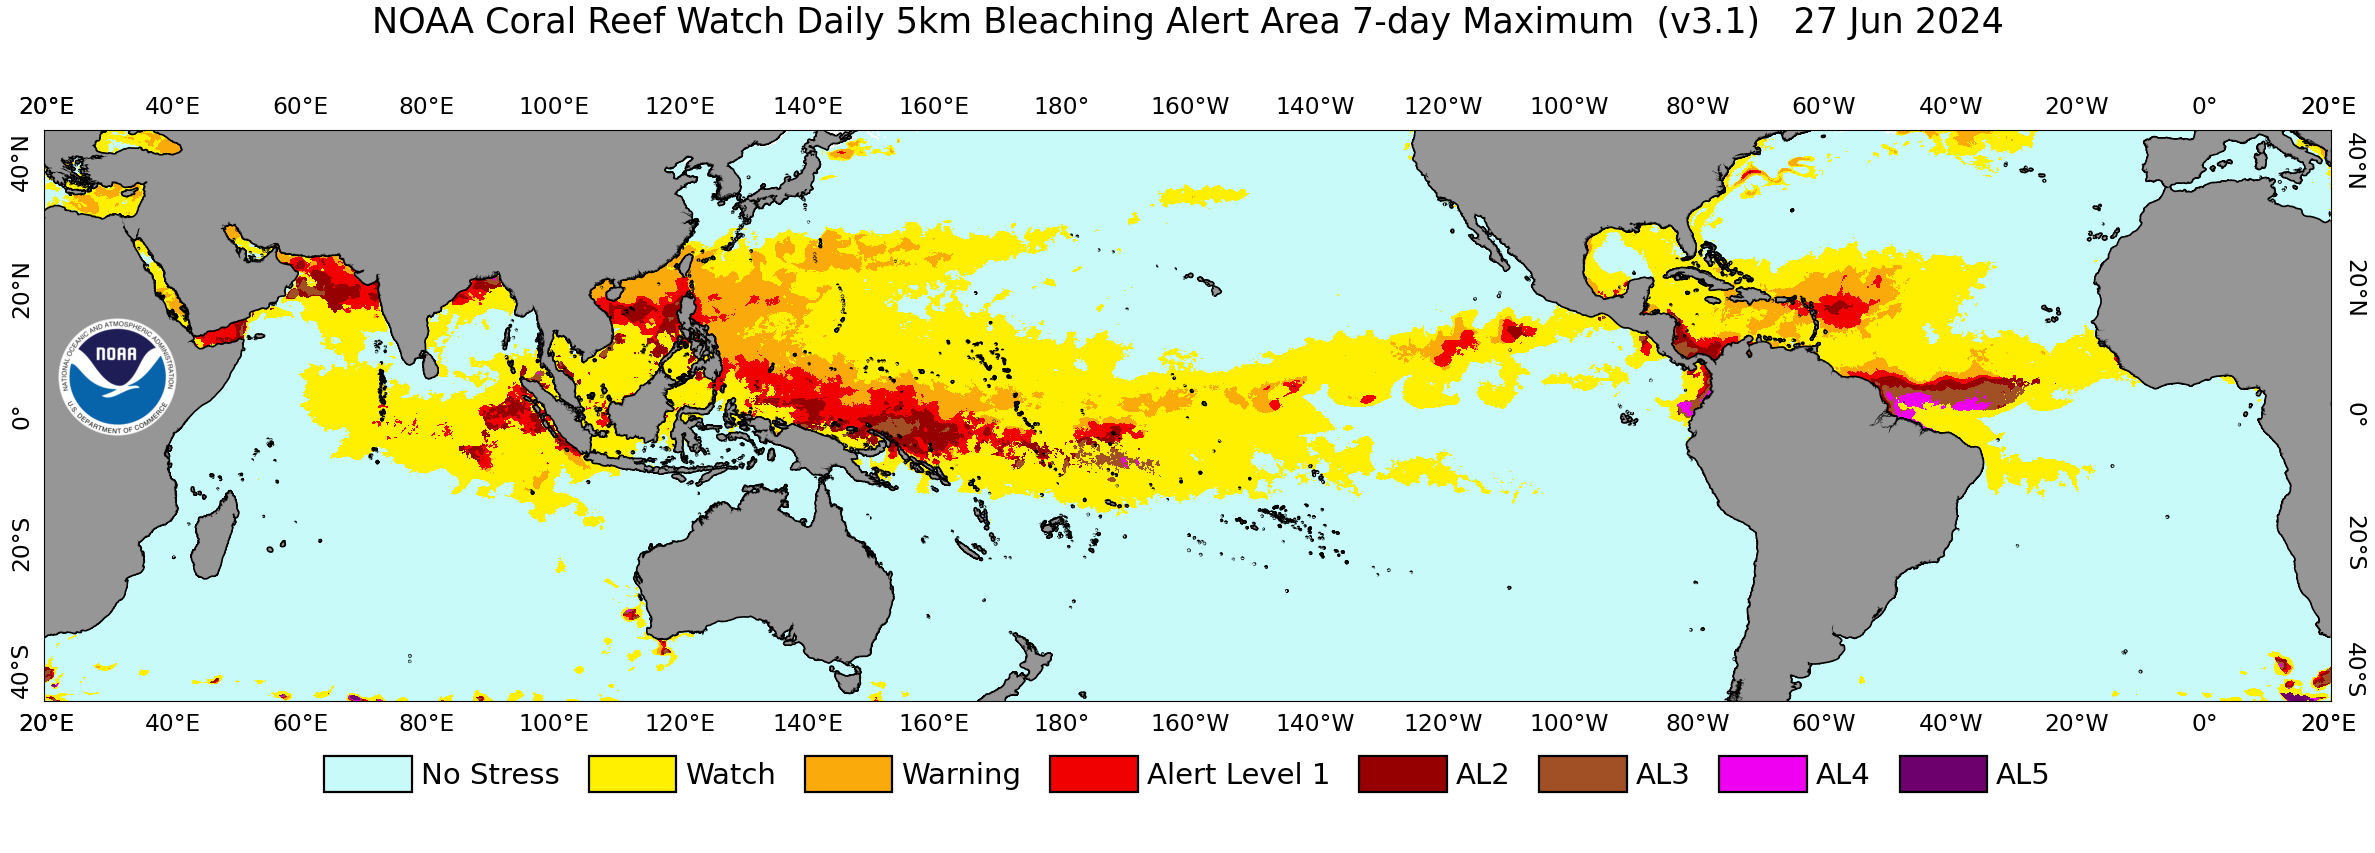
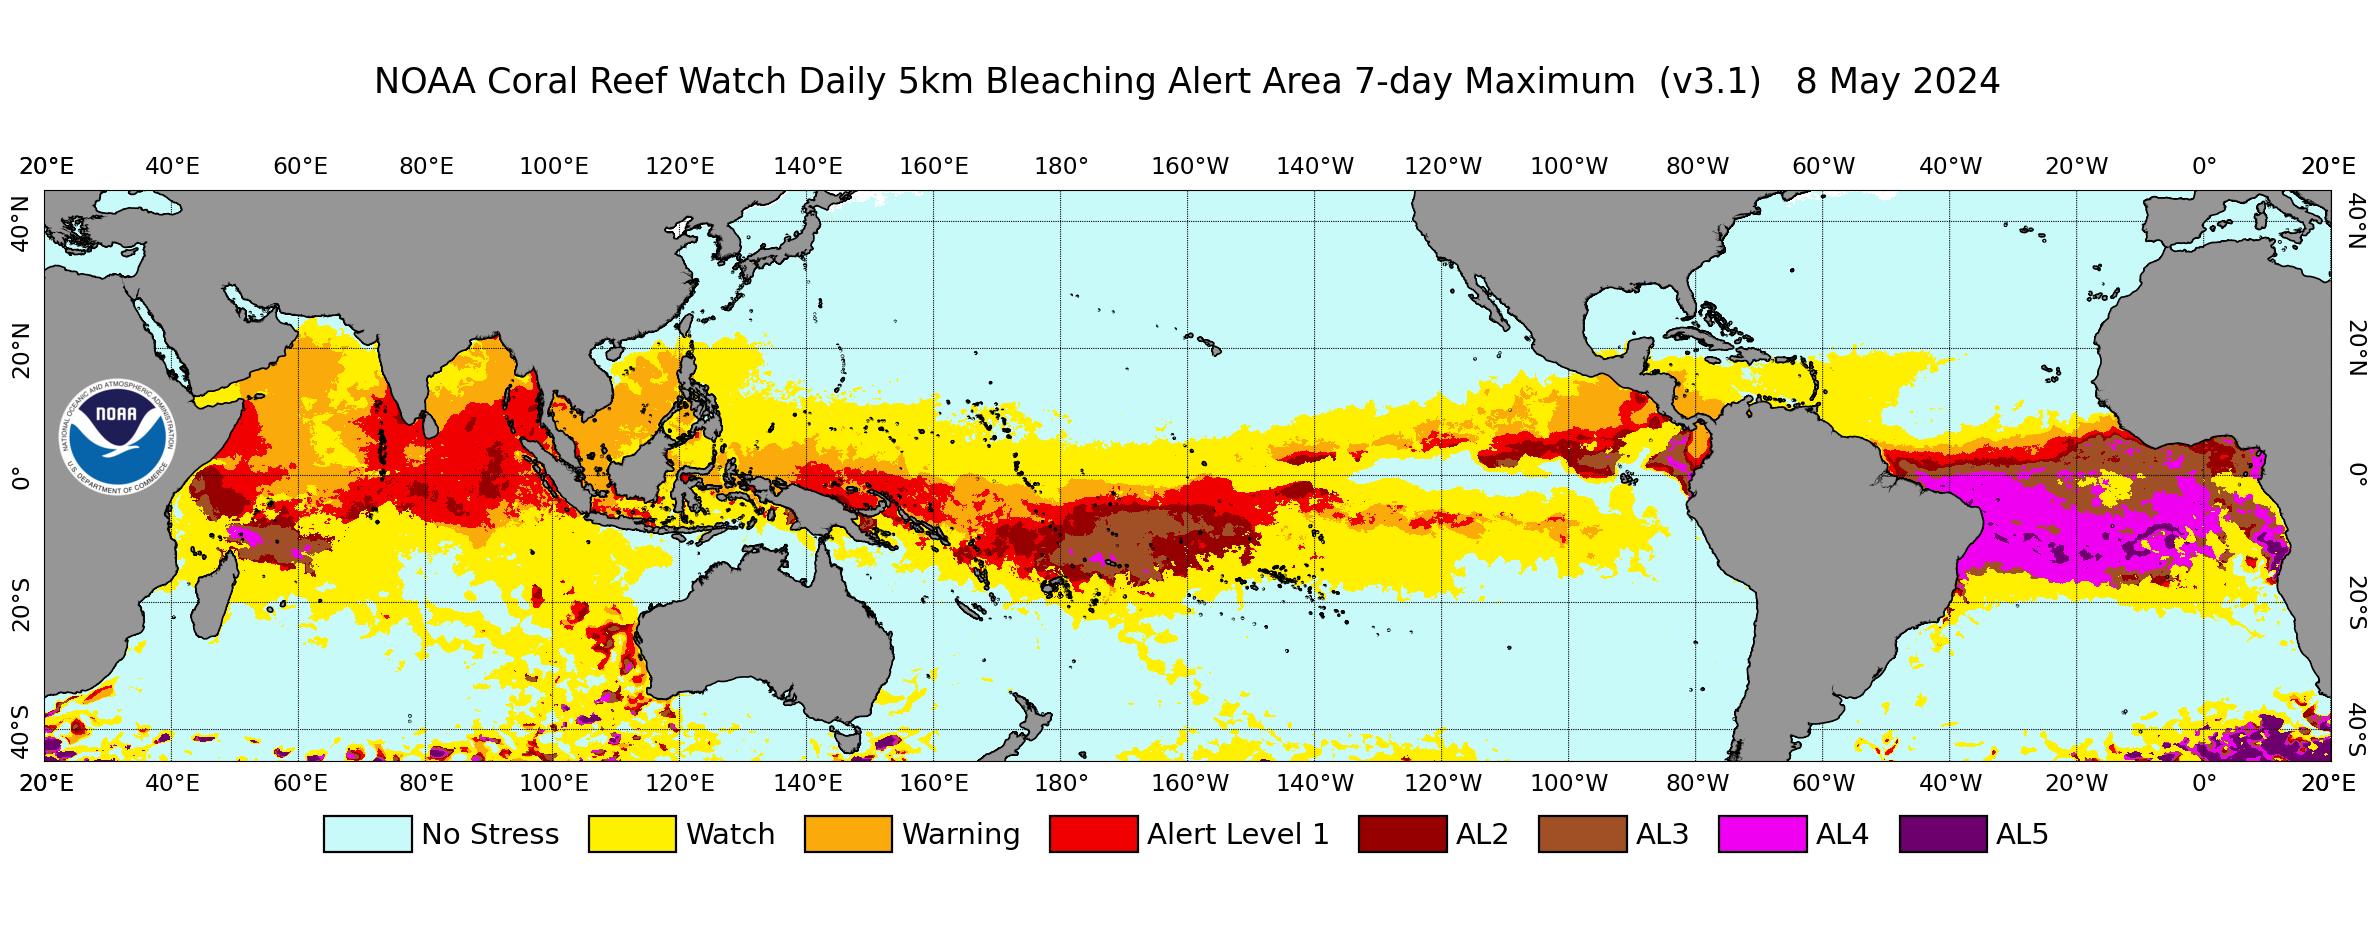
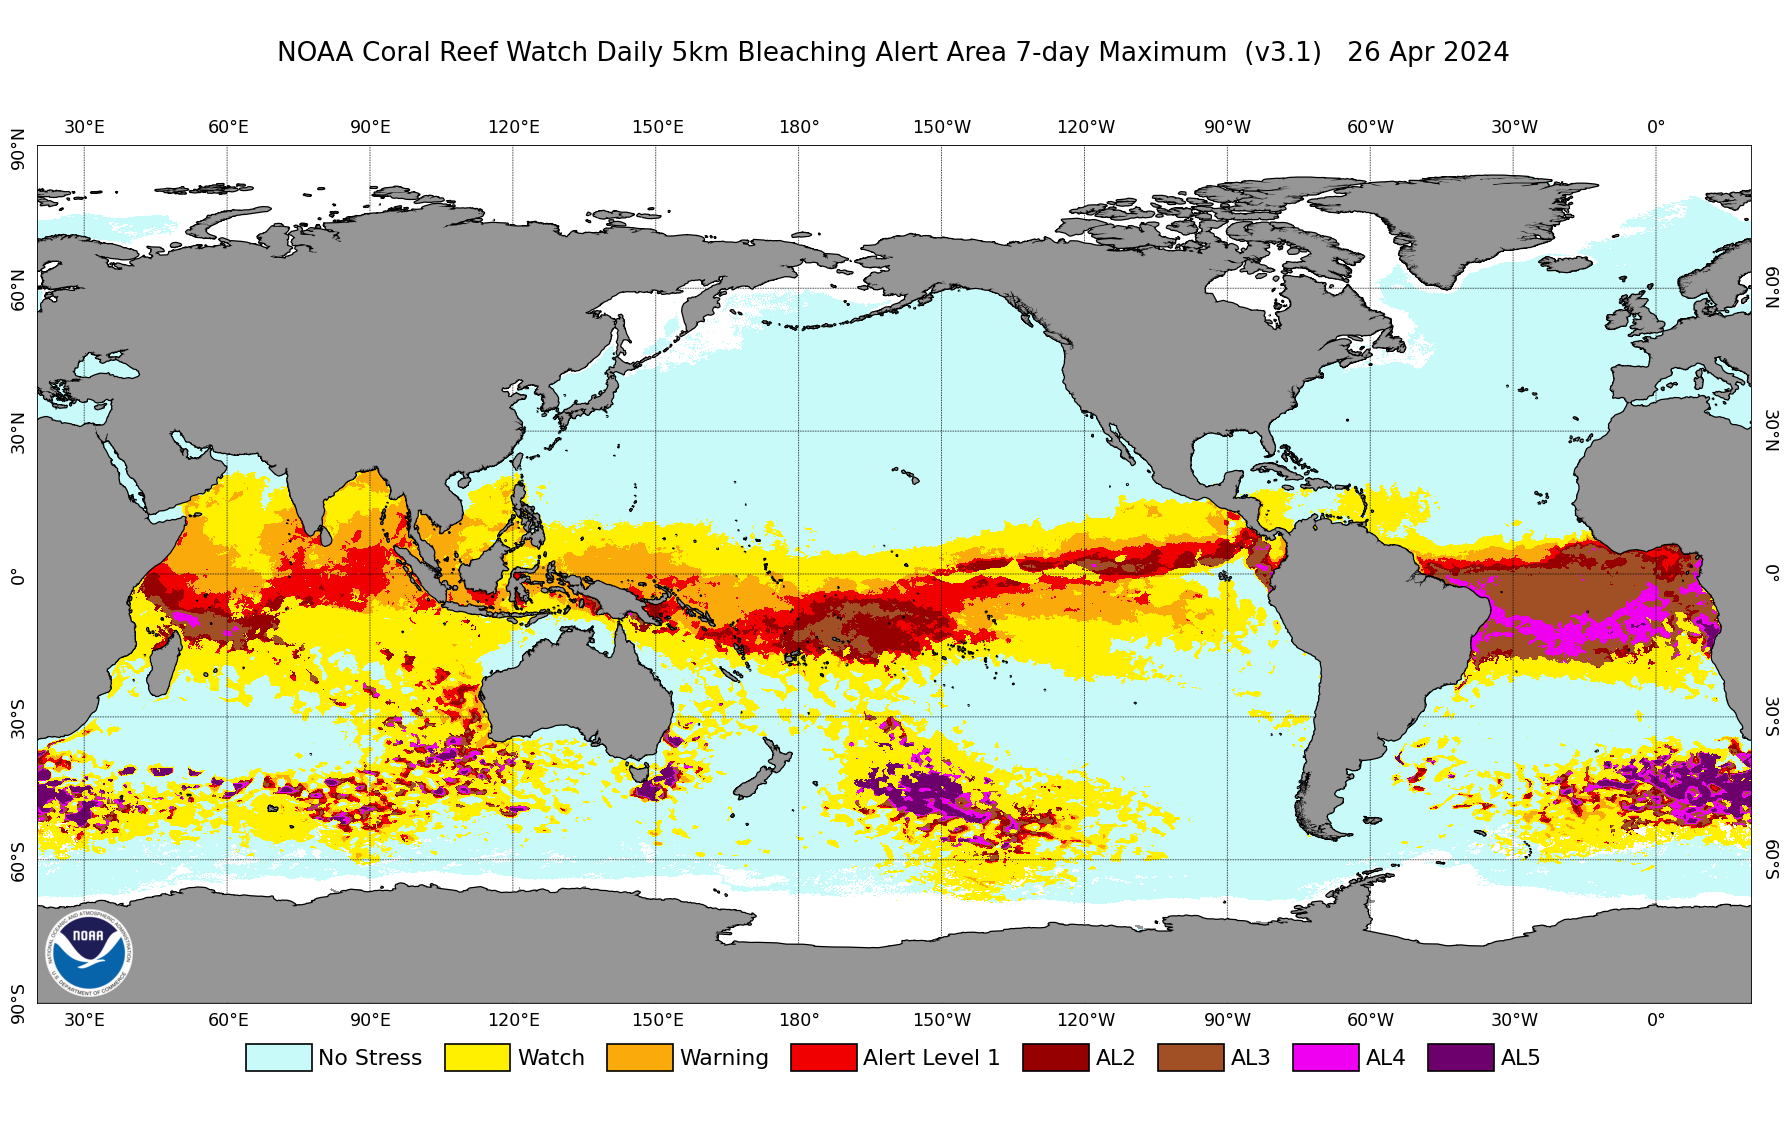
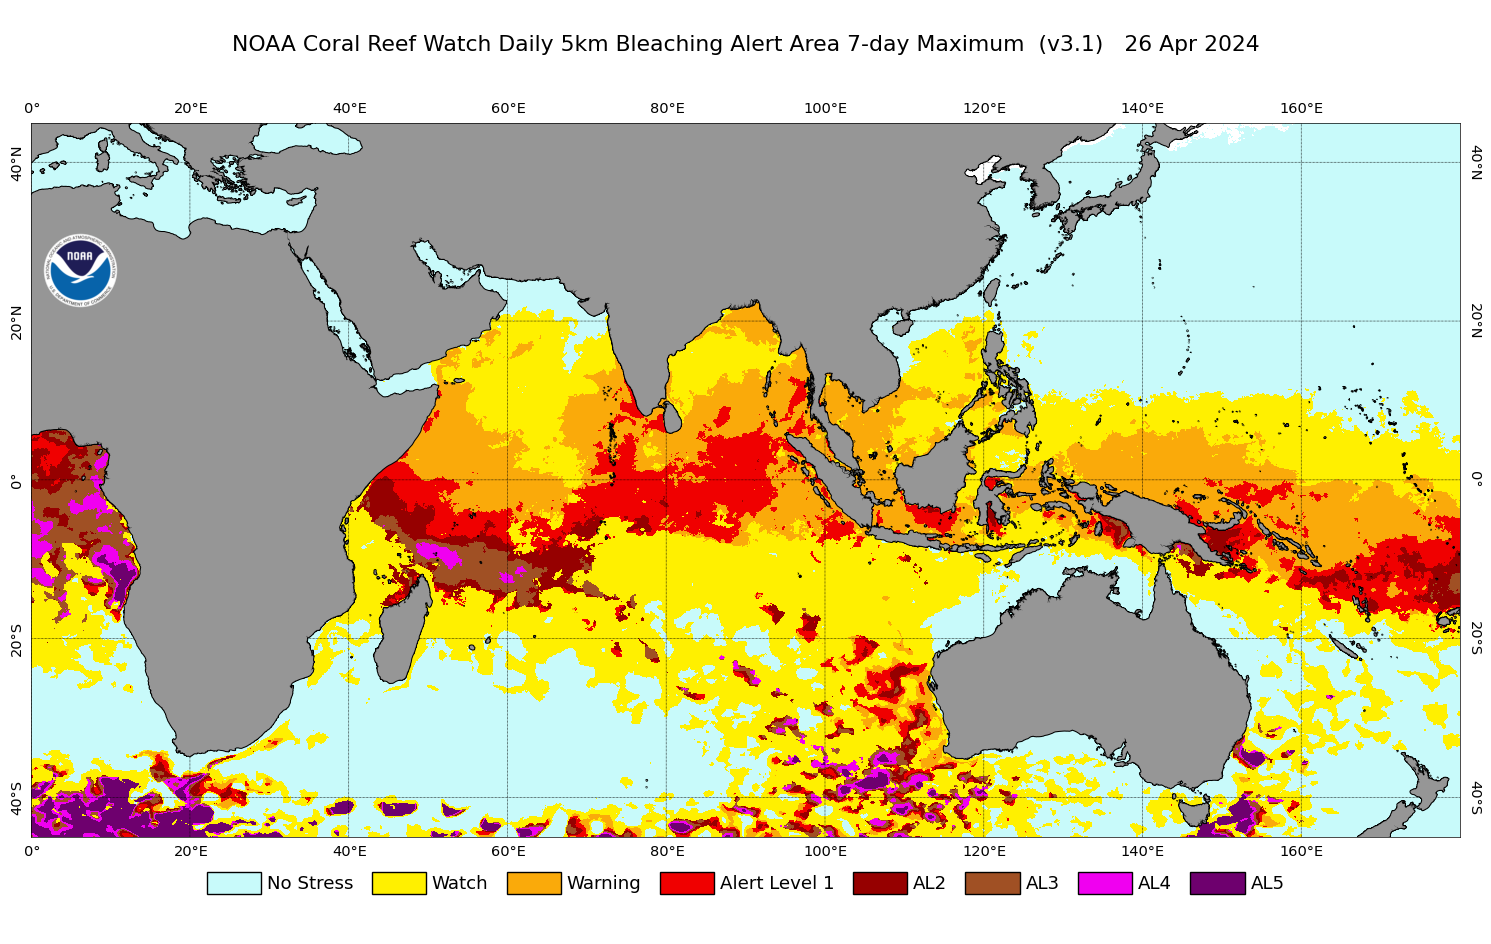
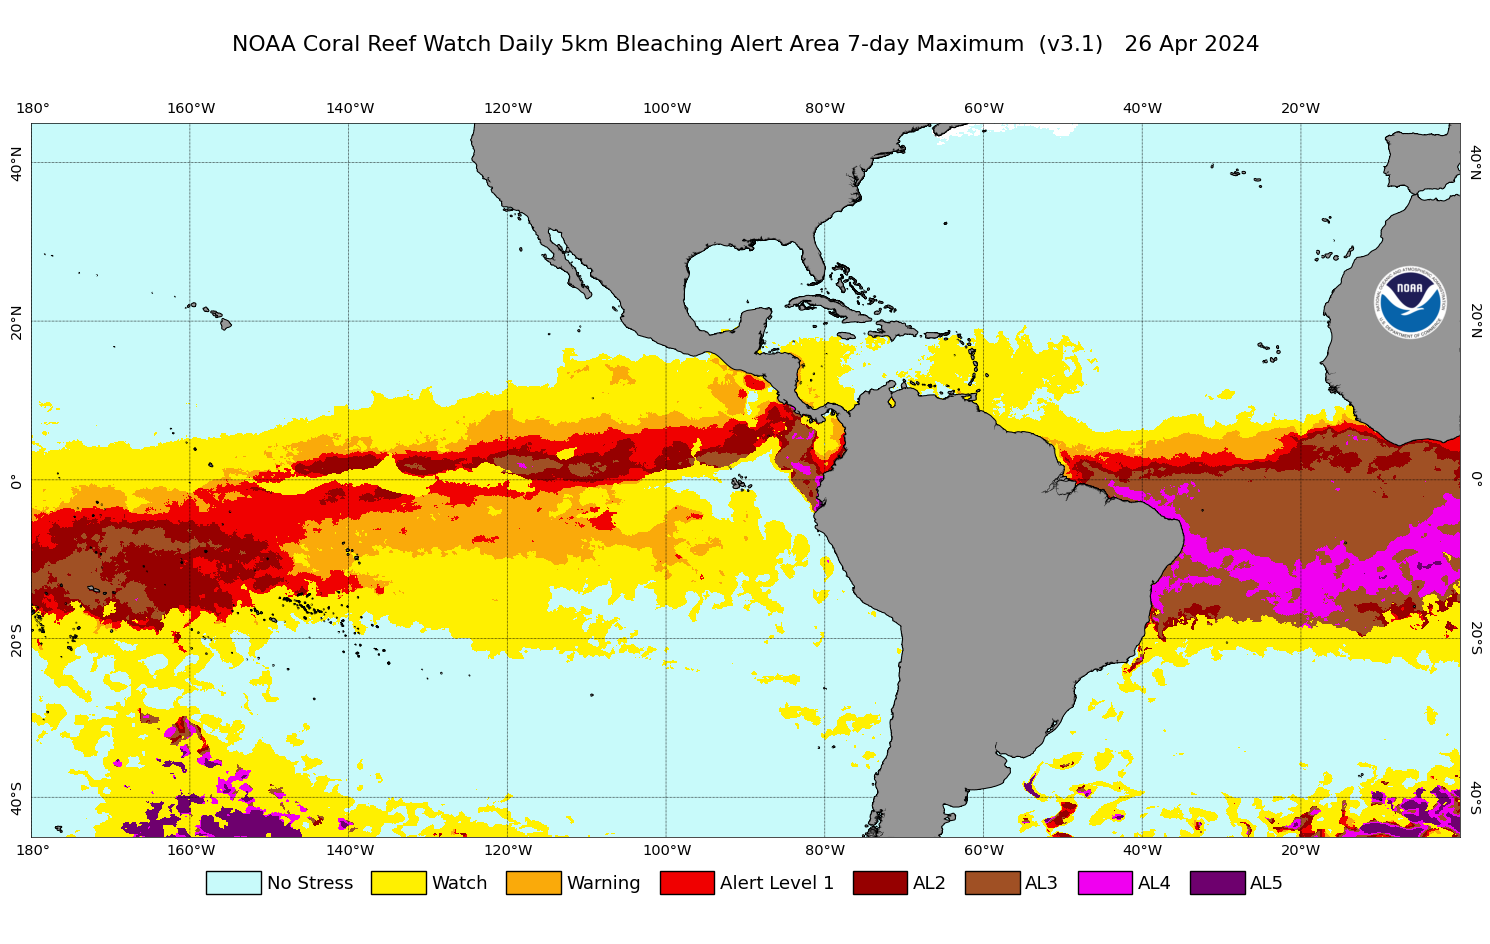
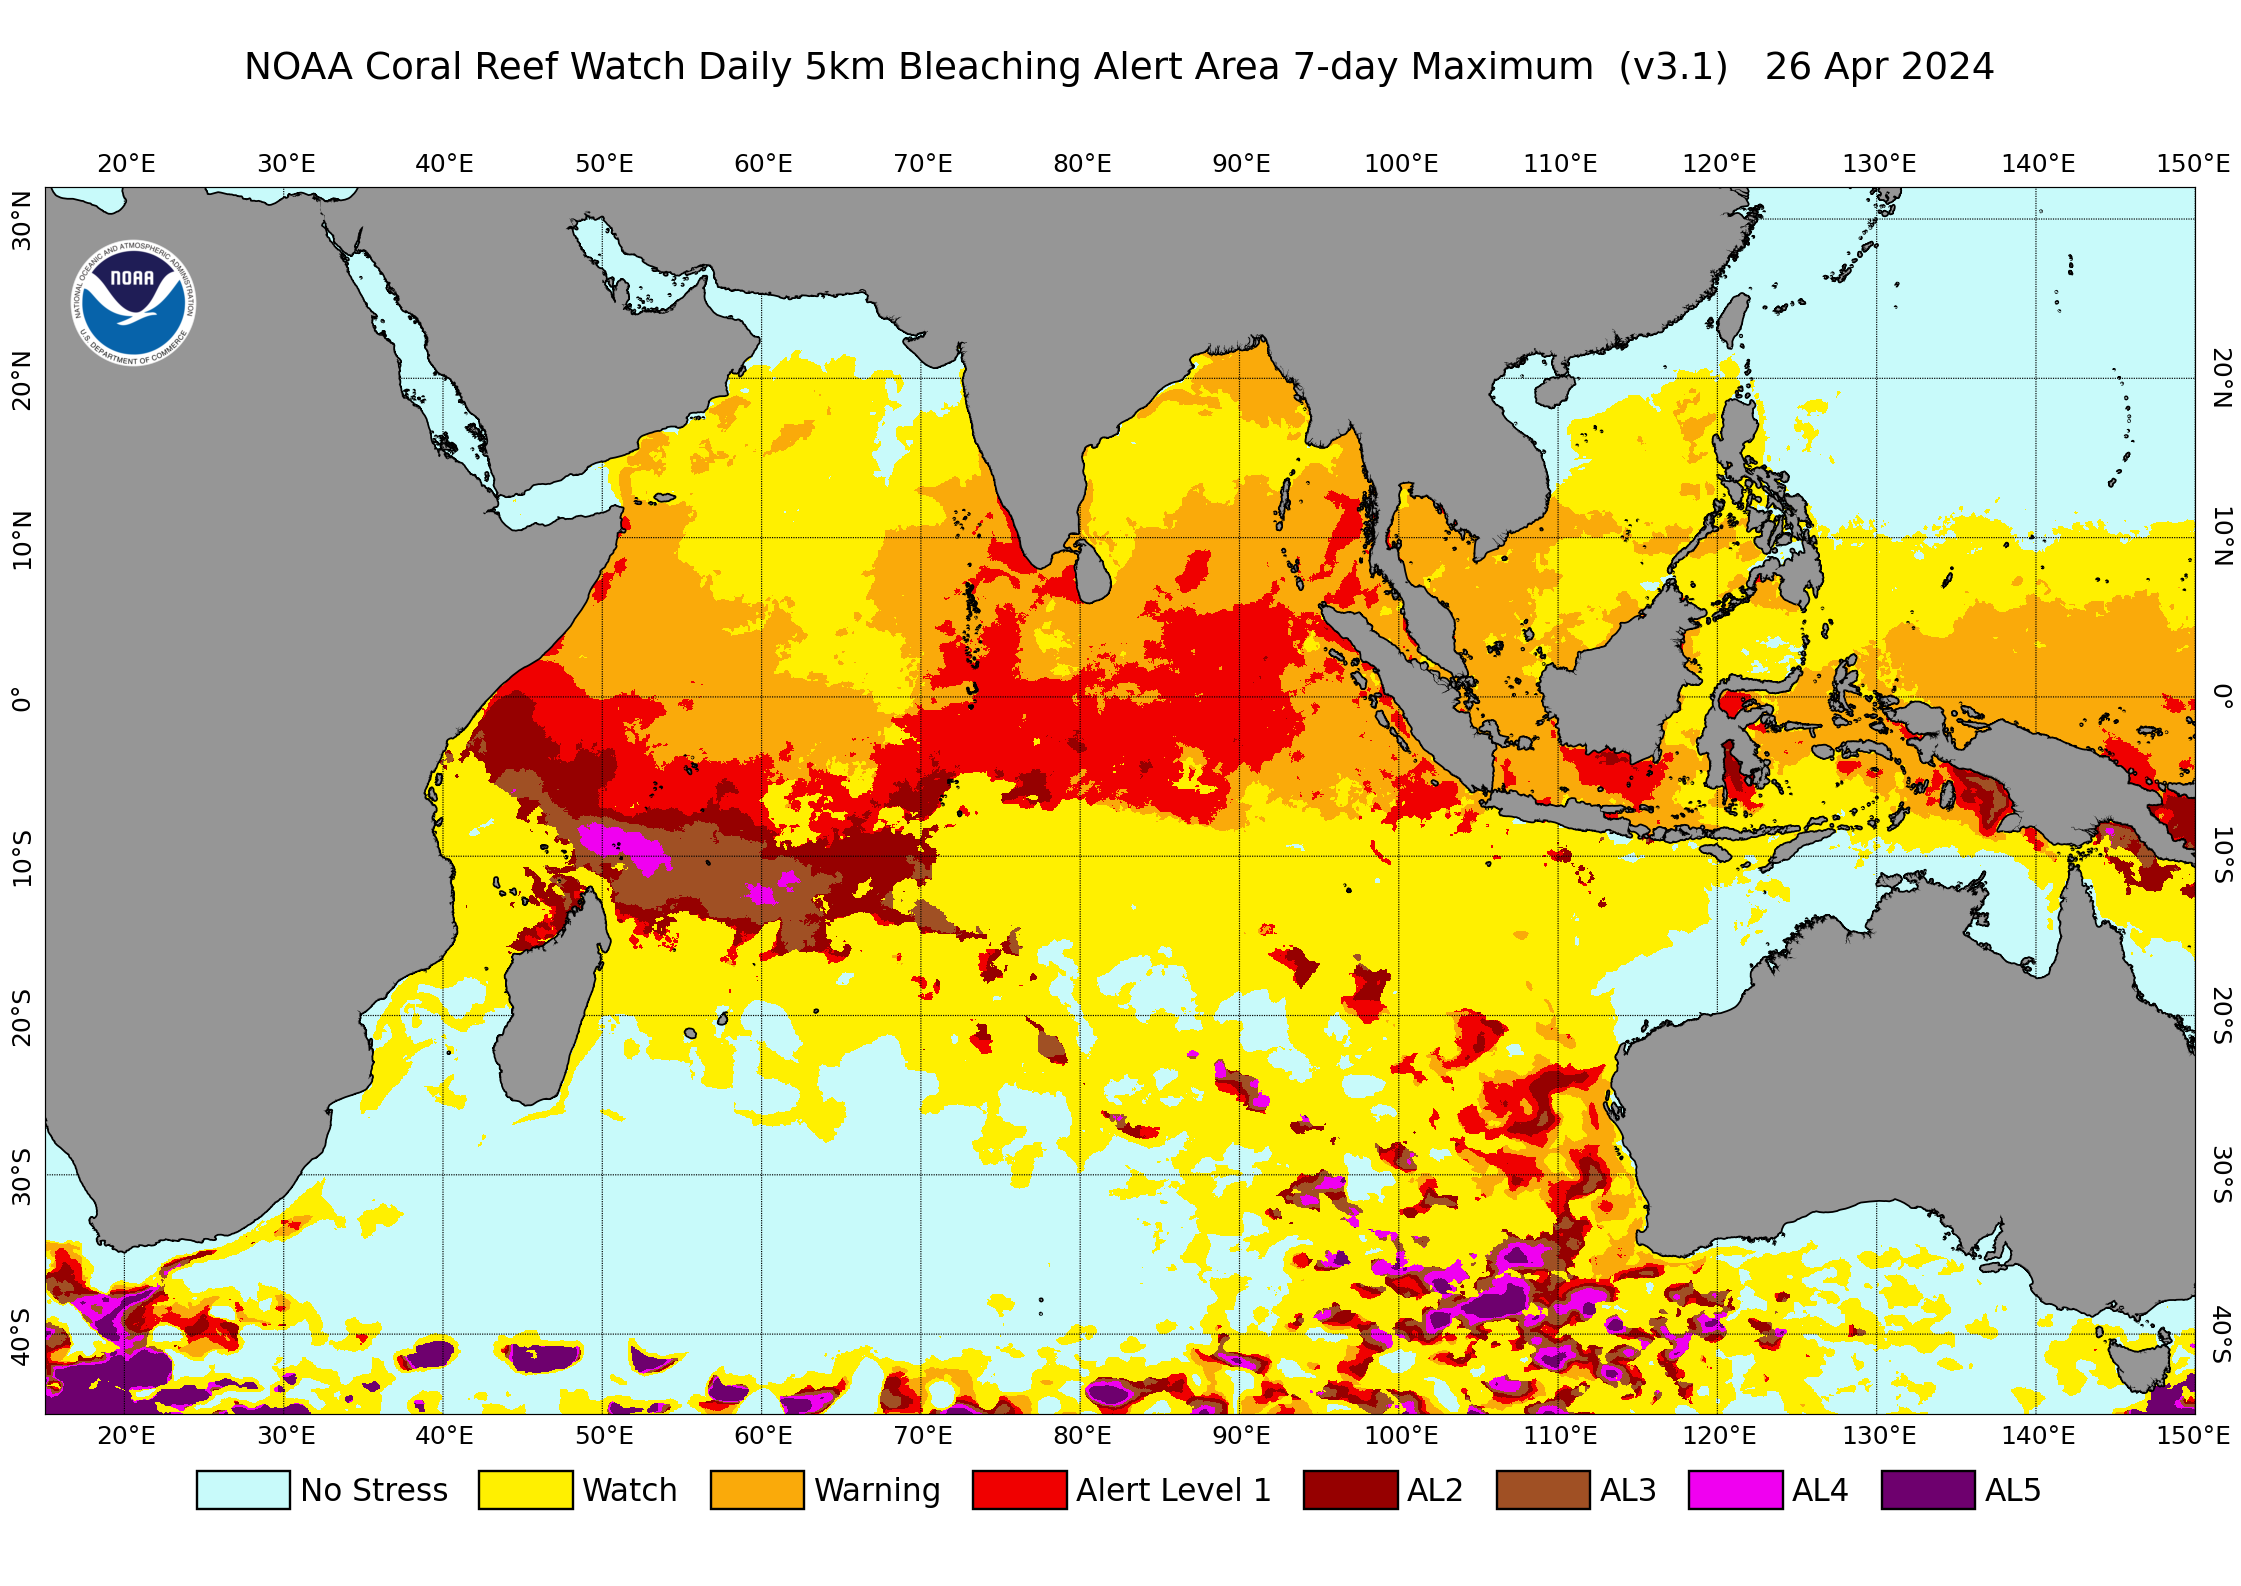
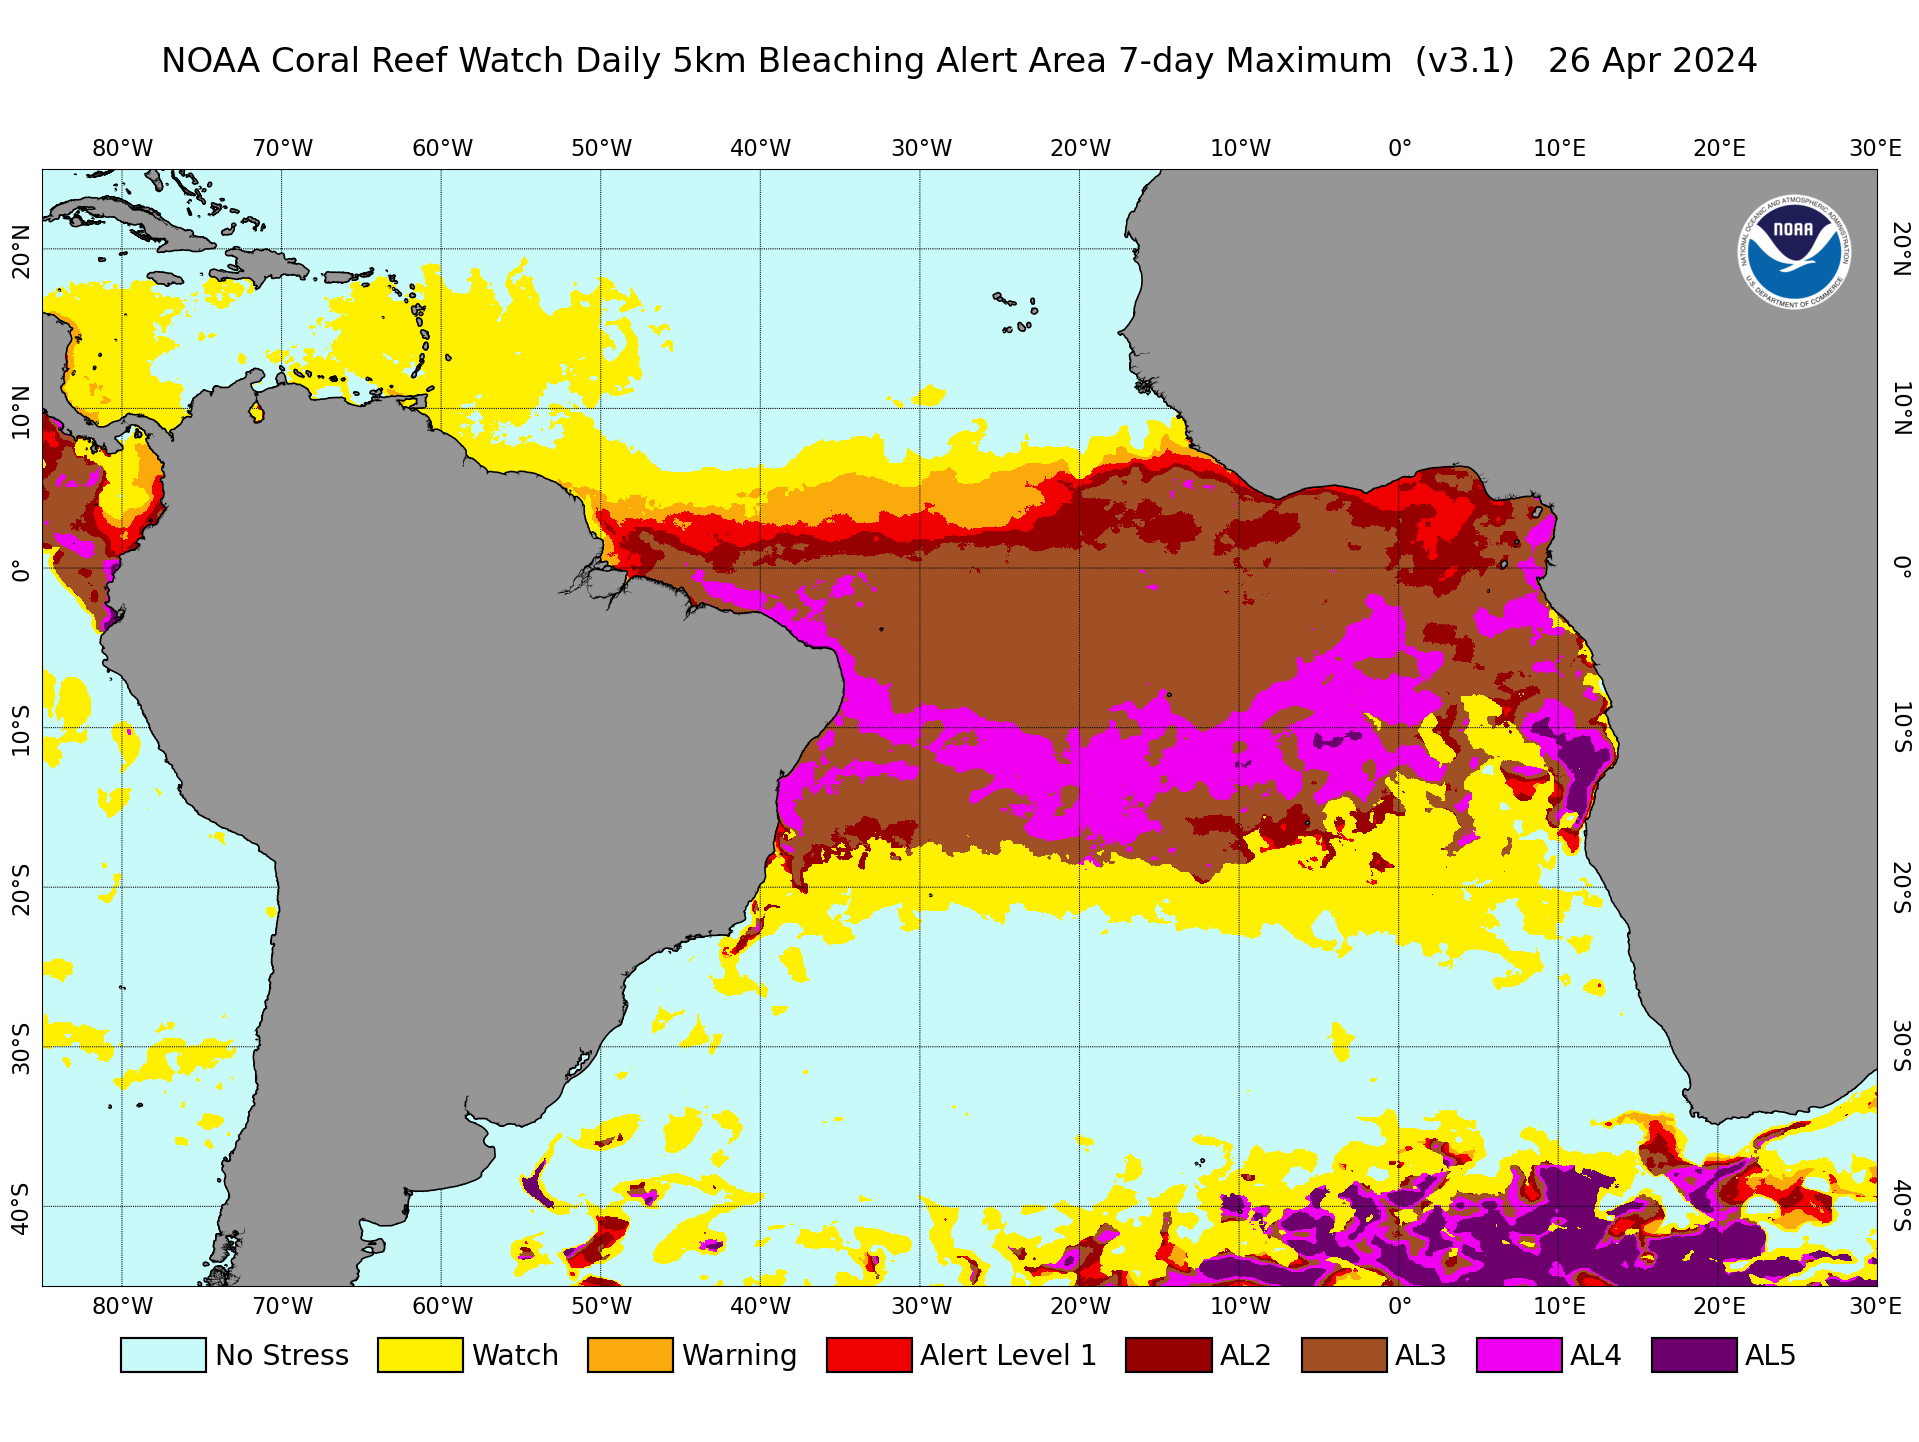
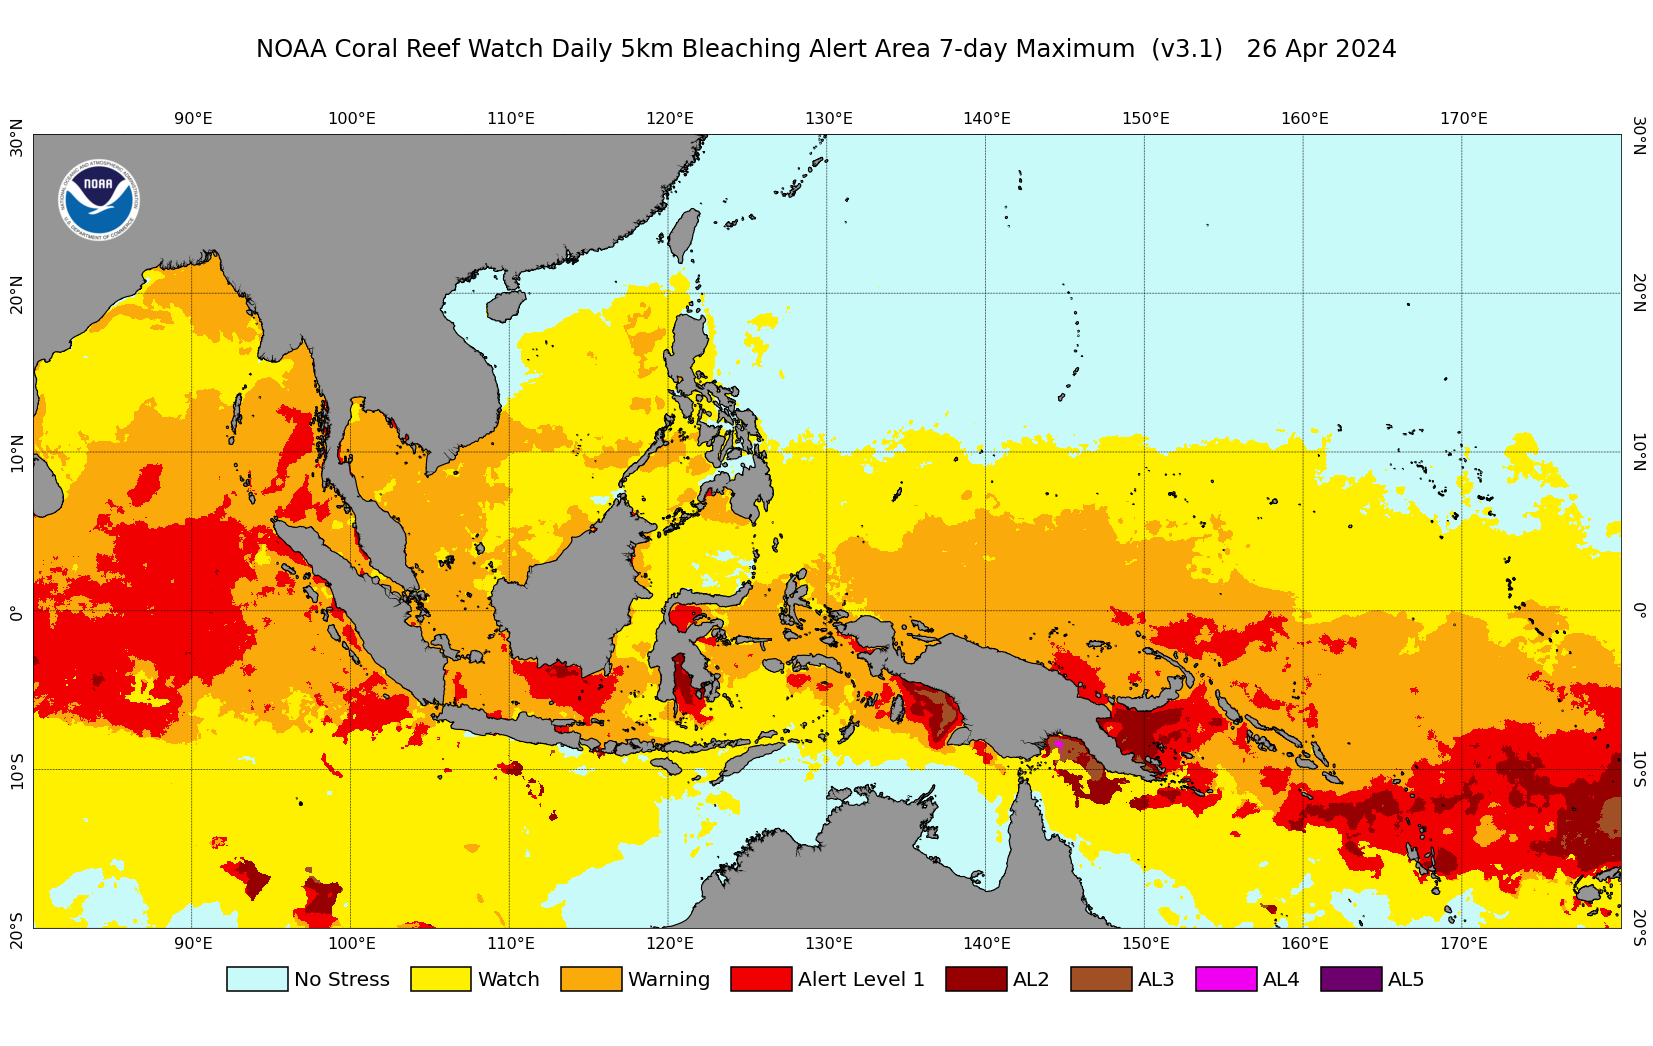
Note that SST variability is often considerably higher at the much finer 5km spatial and daily temporal resolutions, when compared with CRW's heritage twice-weekly global 50km (0.5-degree) monitoring products. Due to resulting day-to-day fluctuations between stress levels in highly-variable locations, the single-day 5km Bleaching Alert Area product does not consistently and adequately identify potentially harmful heat stress levels, especially with regard to accumulated heat stress impacts. Rather than requiring users to examine the single-day 5km Bleaching Alert Area product over several days, a 7-day maximum Bleaching Alert Area composite product, updated daily, was introduced in the v2 product suite and is maintained here in v3.1. (Evolution of CRW's daily global 5km product suites can be found here.) This 7-day composite product shows the maximum stress level that a satellite pixel has experienced during the most recent seven (7) consecutive days. Data and images are dated on the last day of the 7-day period. Notably, it is compatible with CRW's heritage twice-weekly global 50km Bleaching Alert Area product
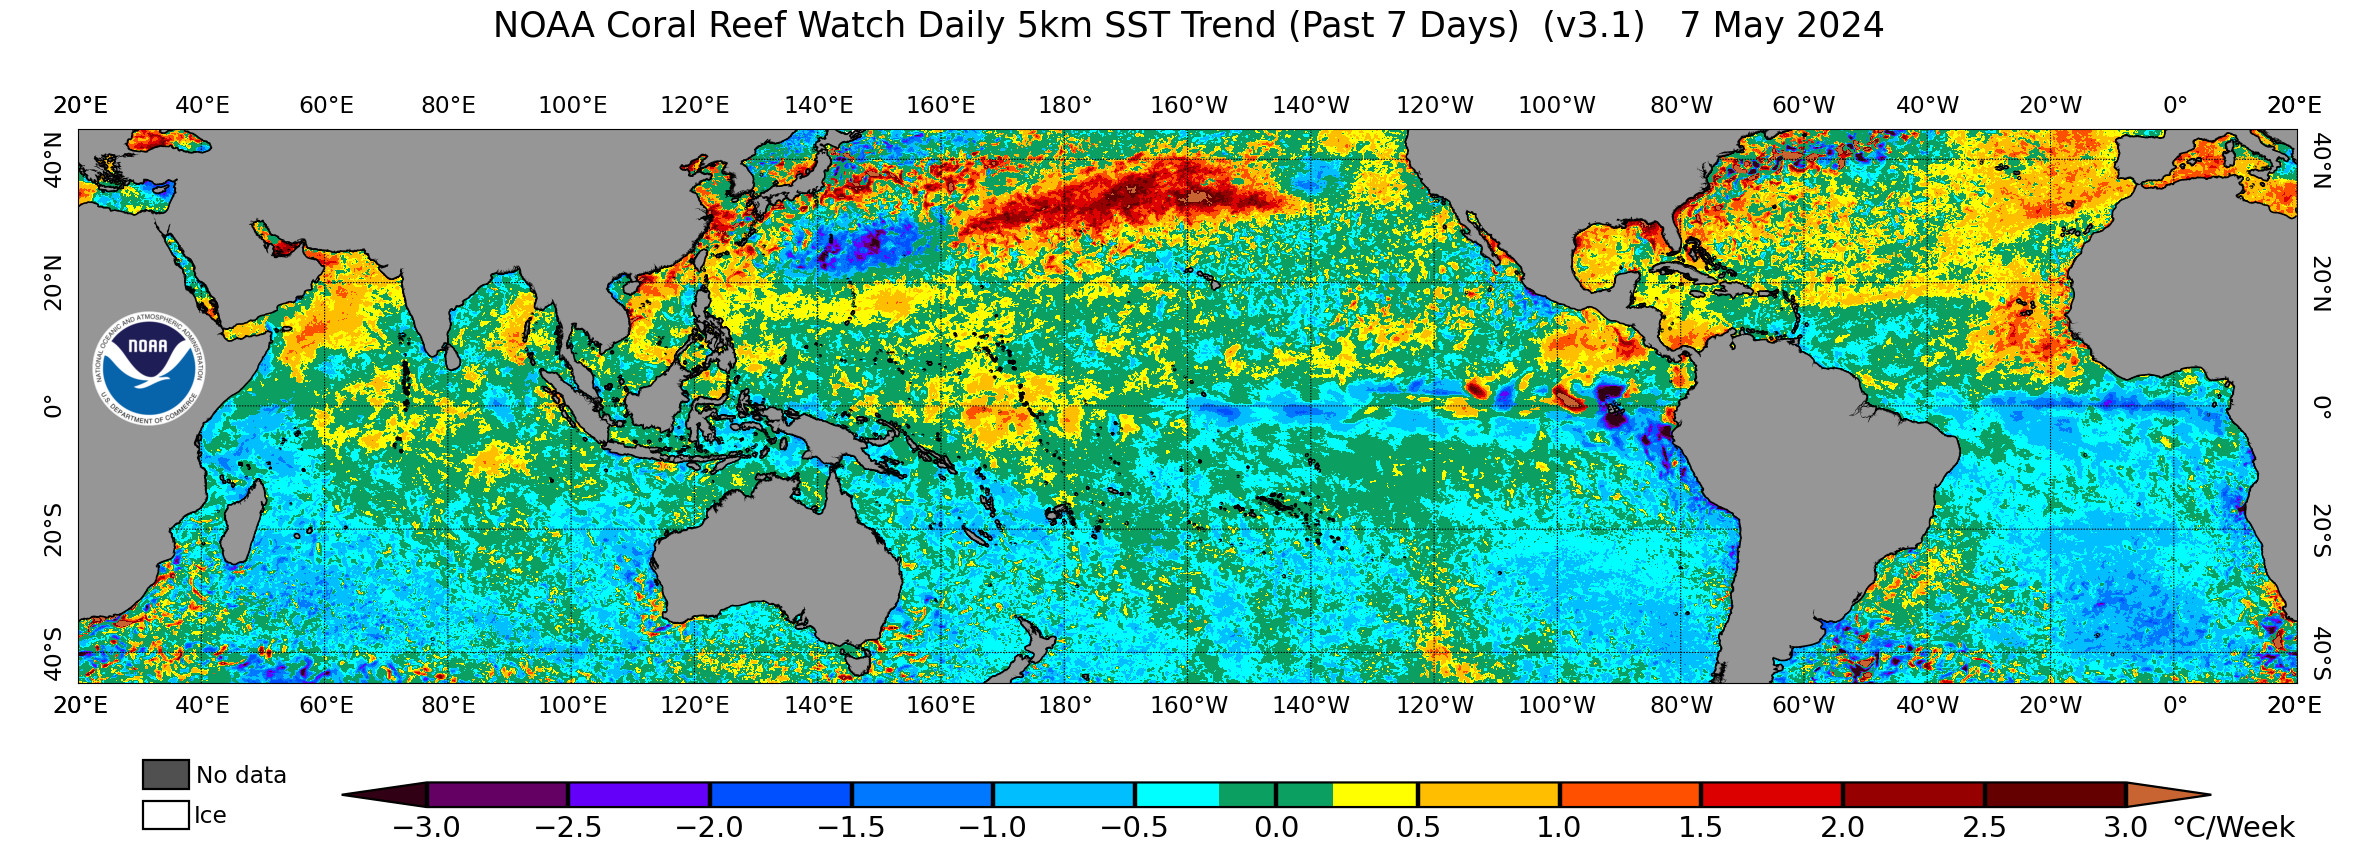
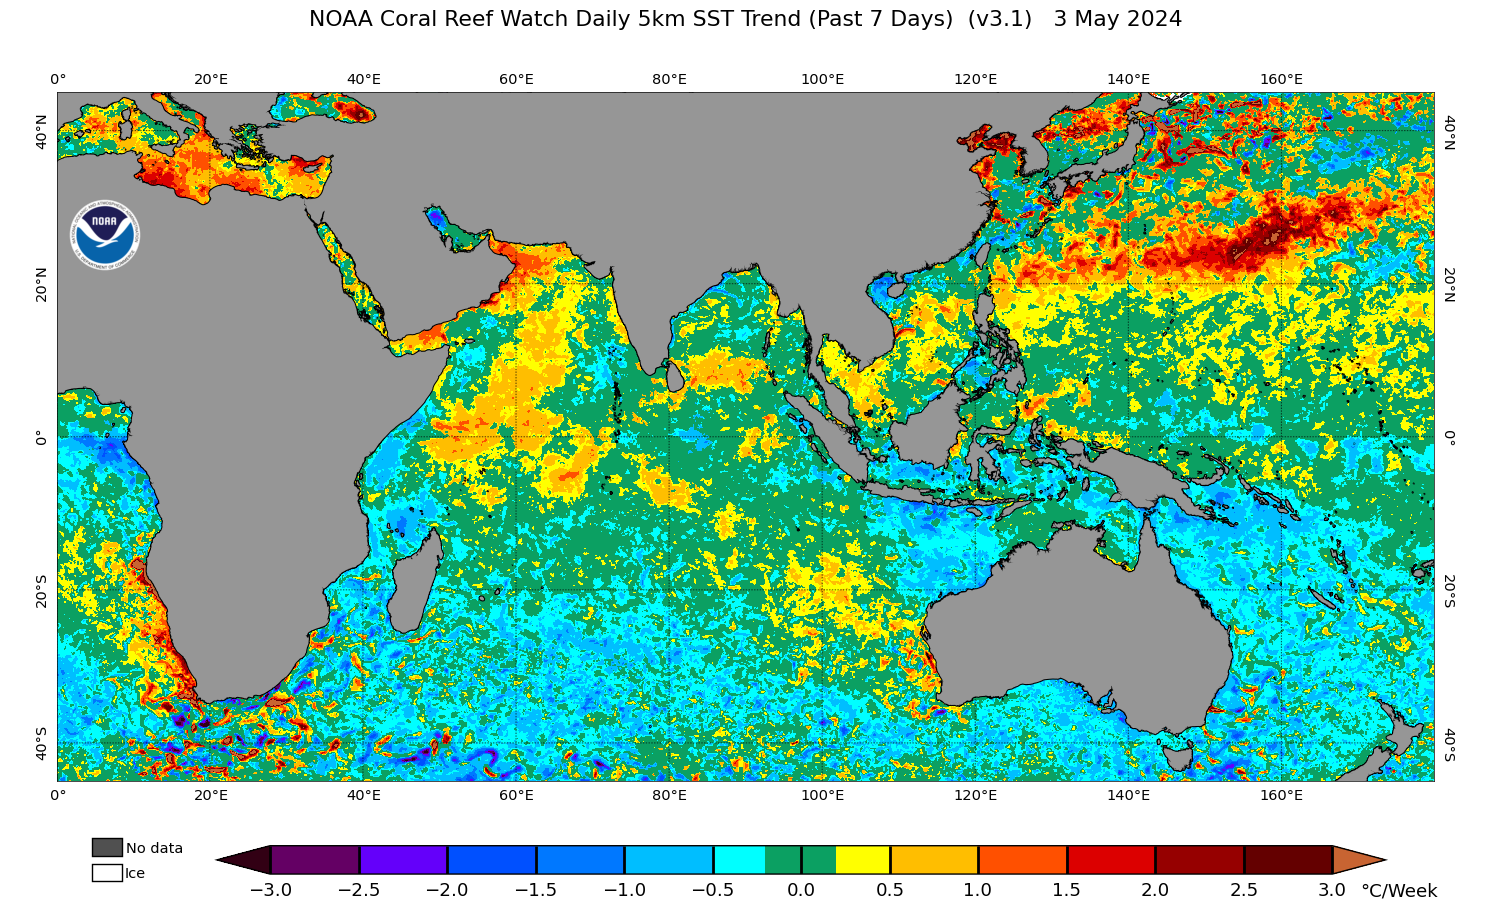
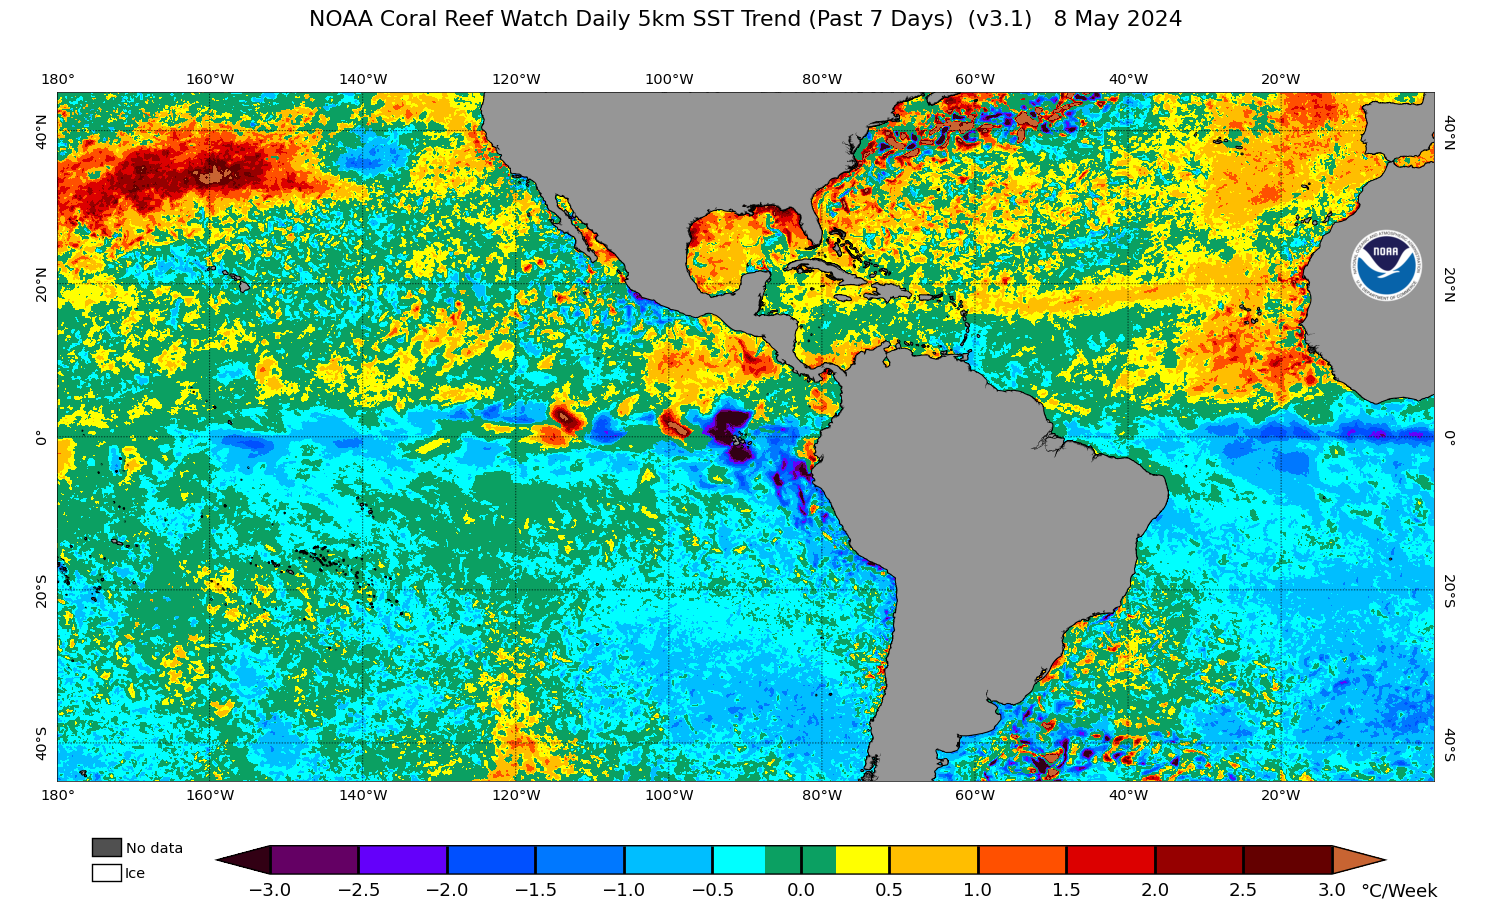
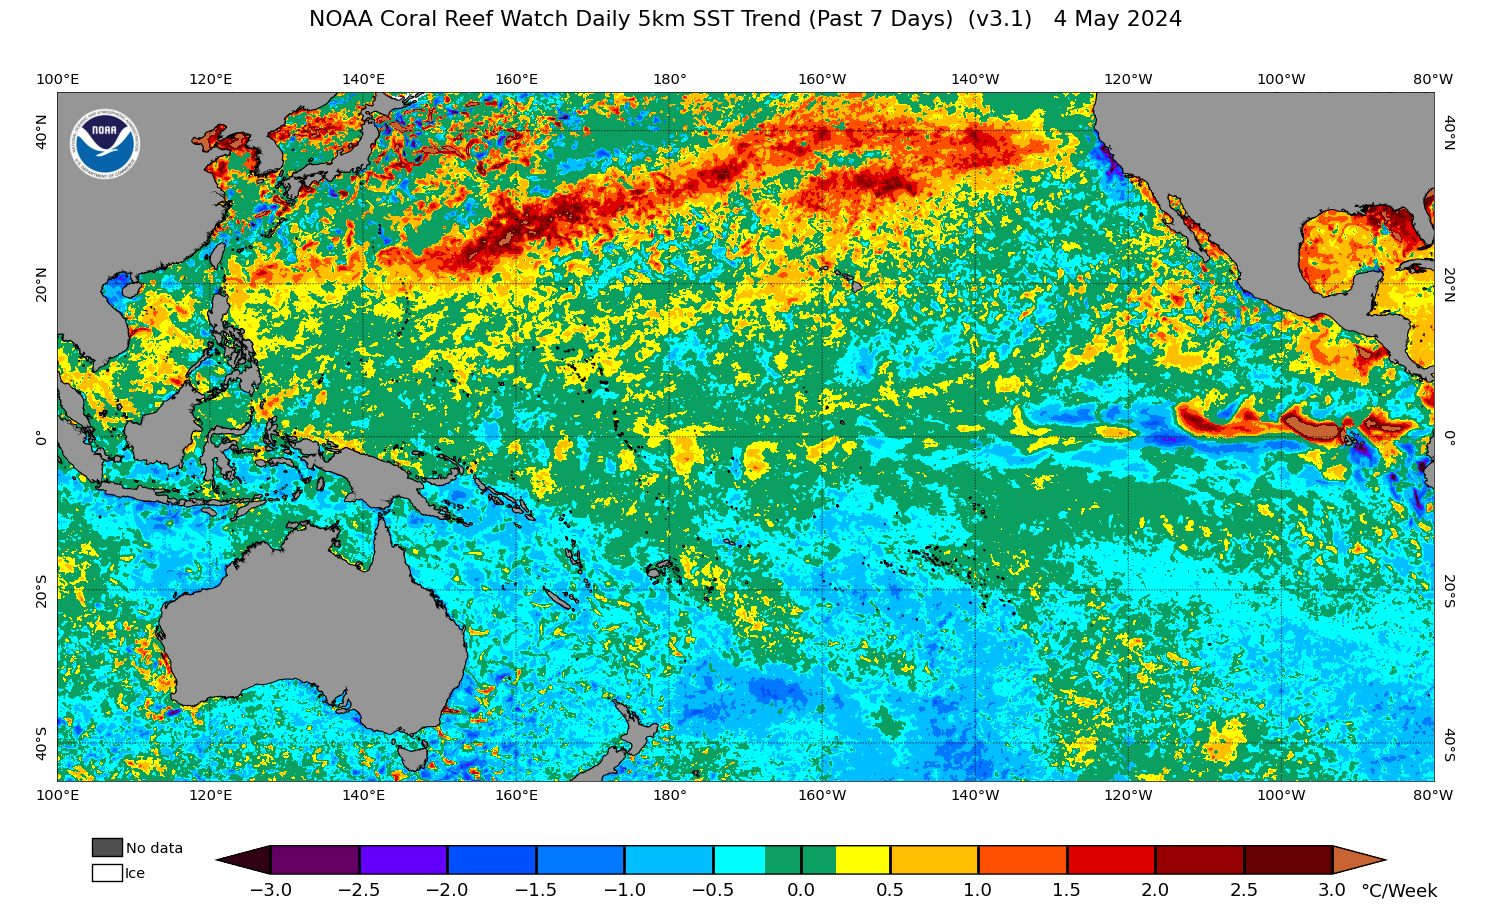
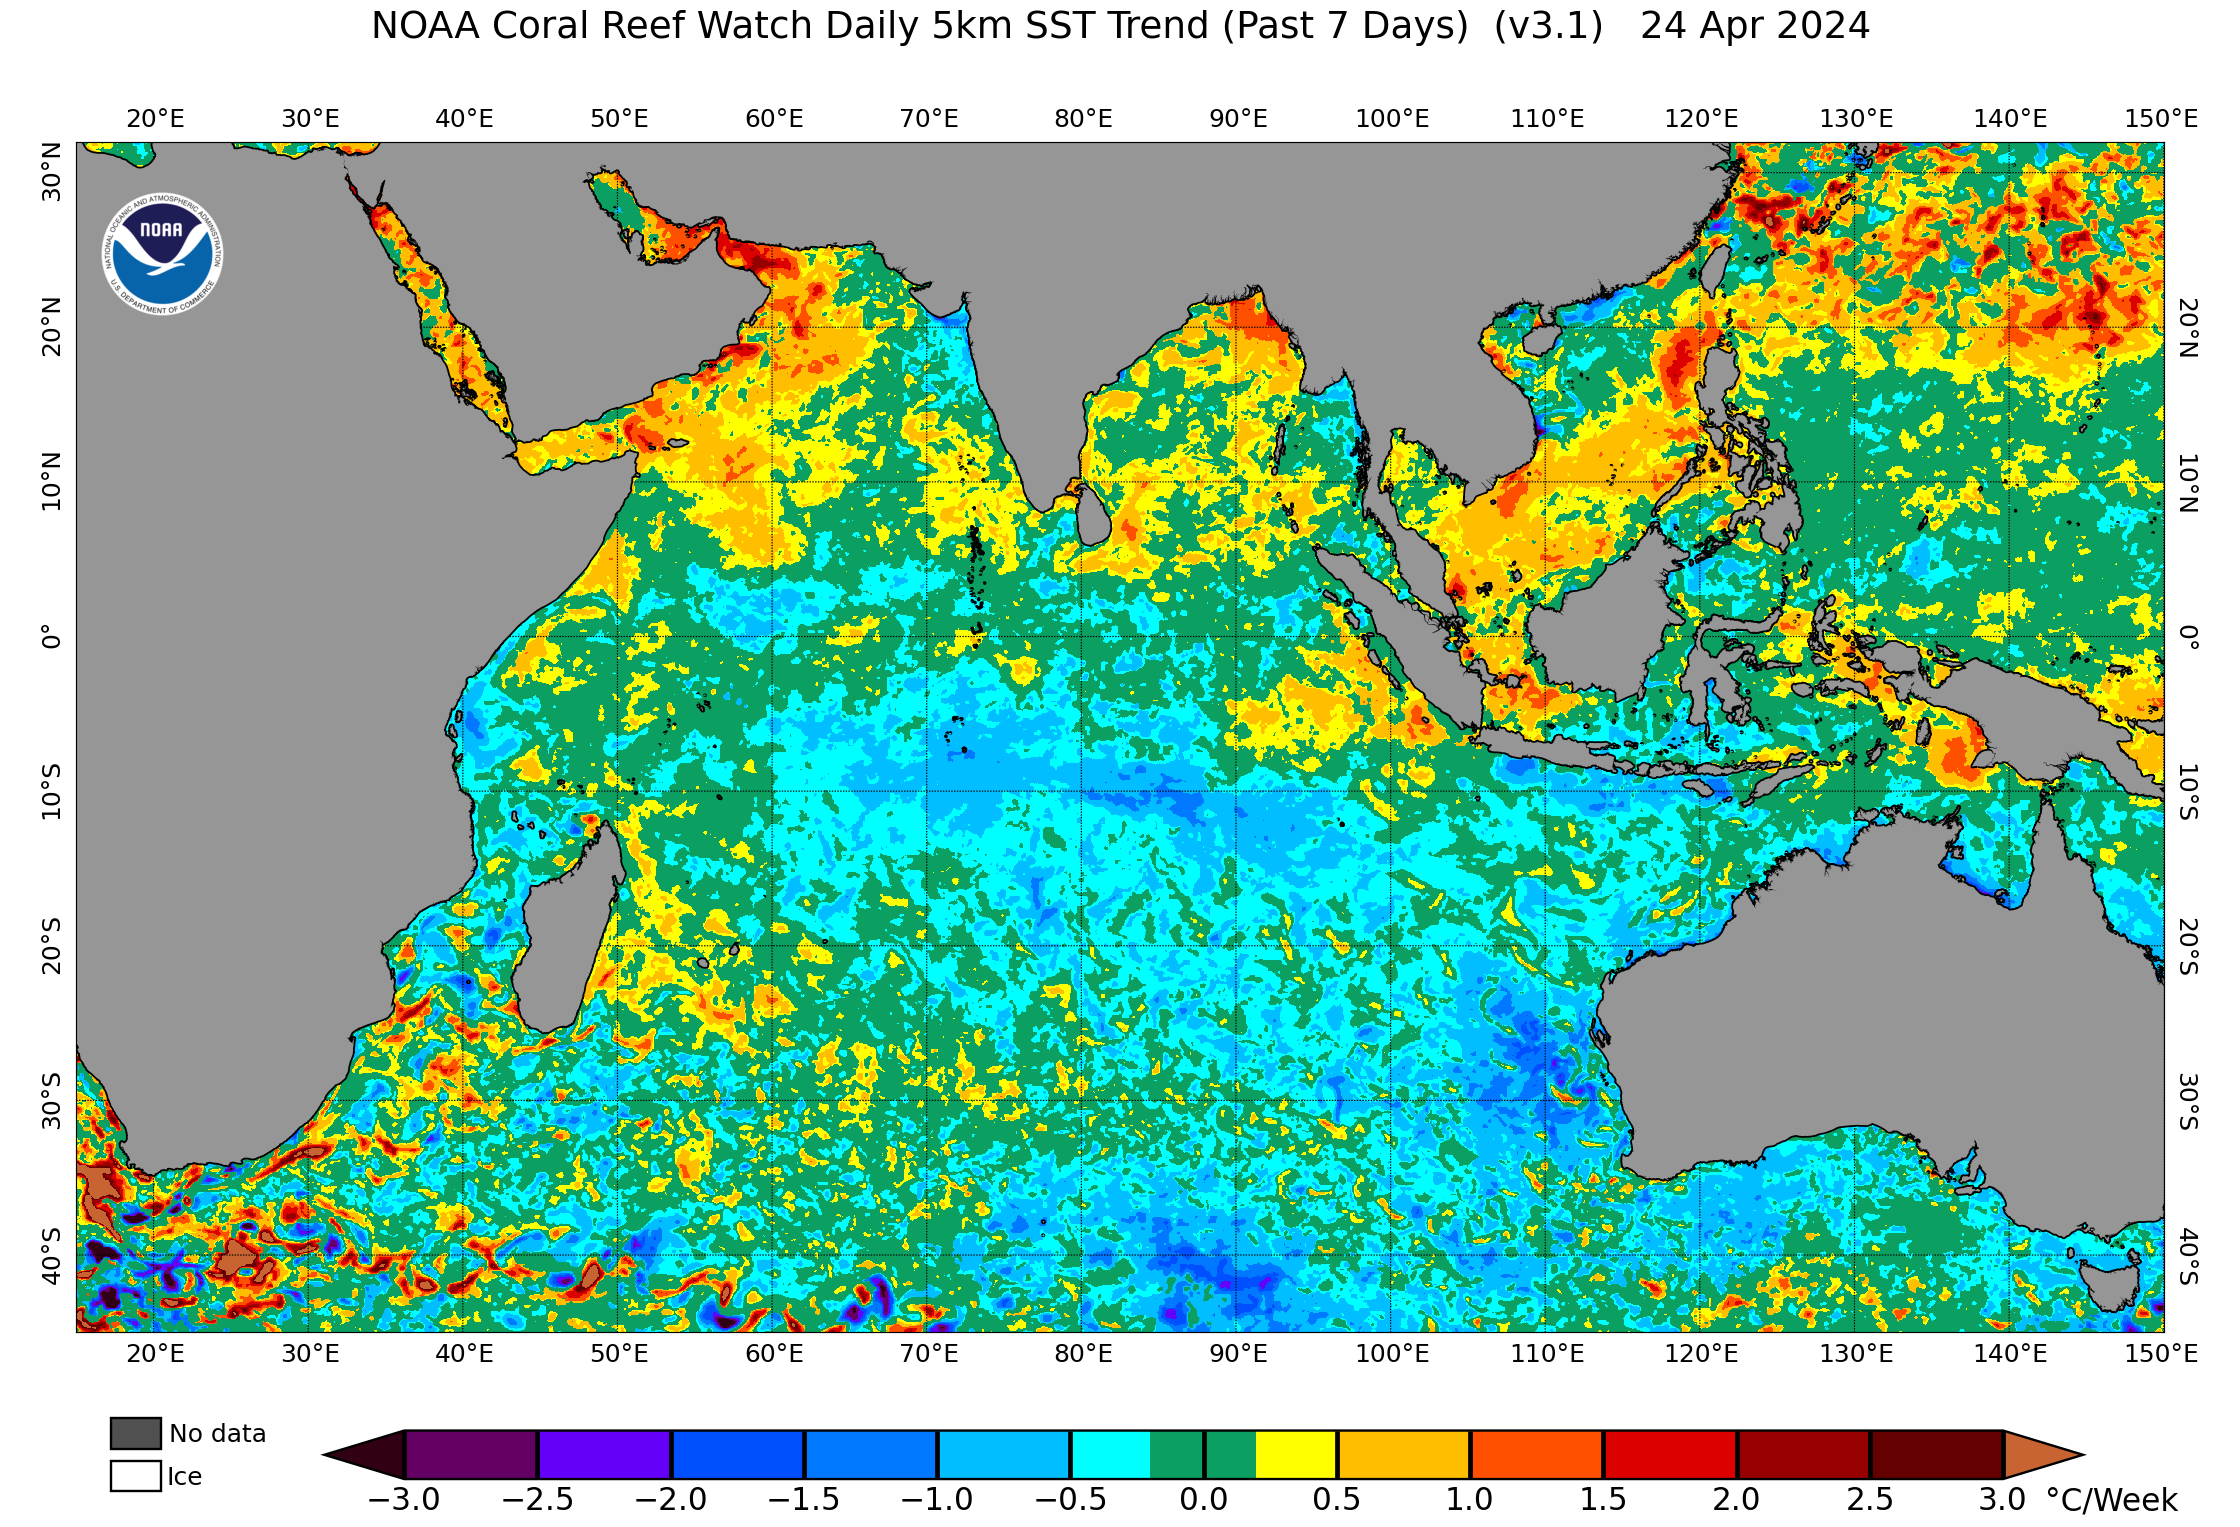
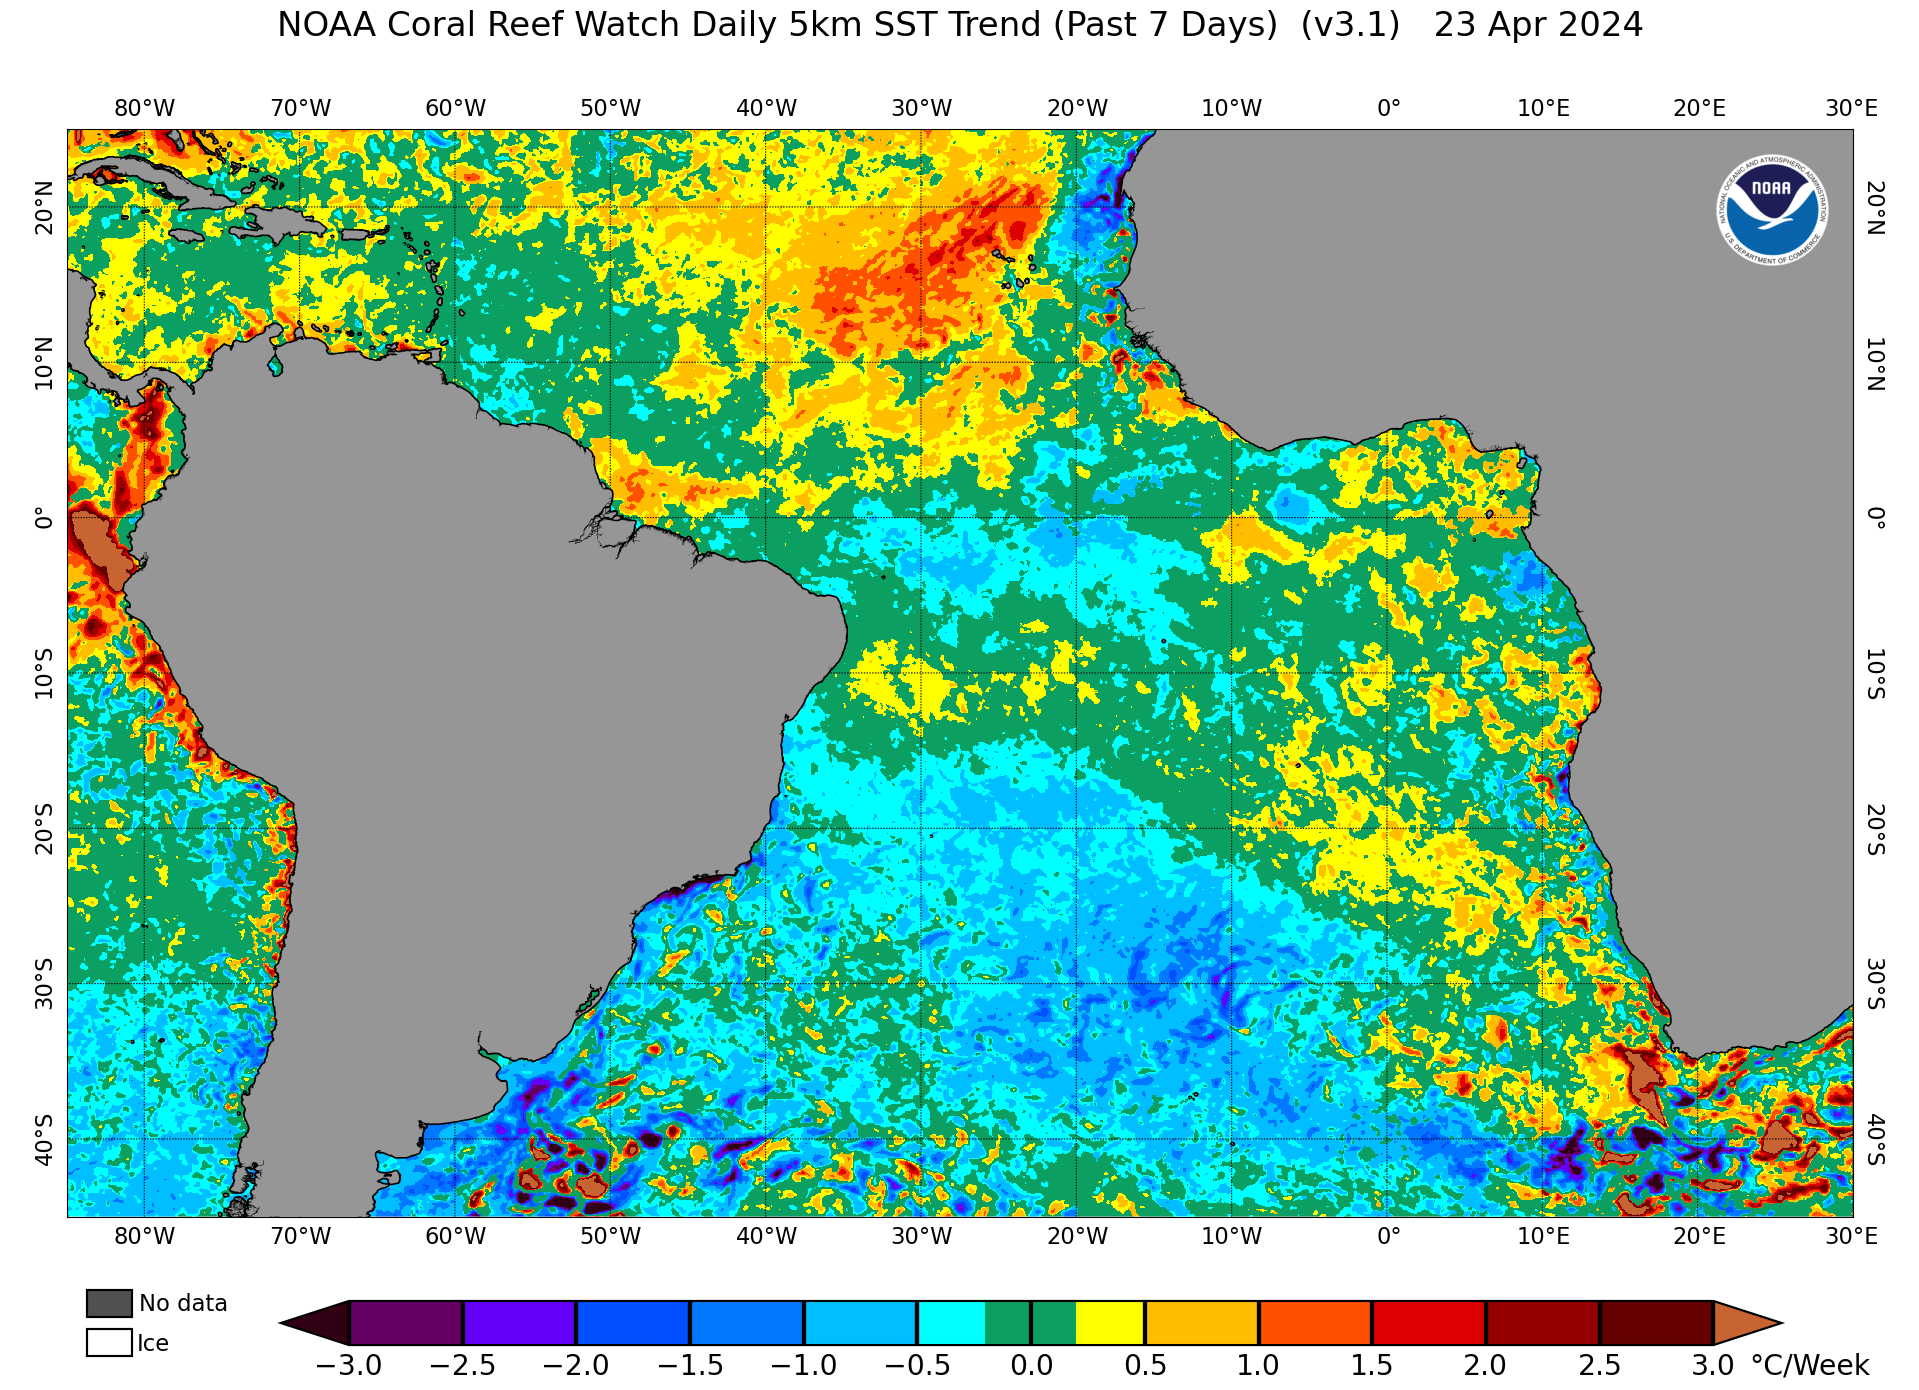
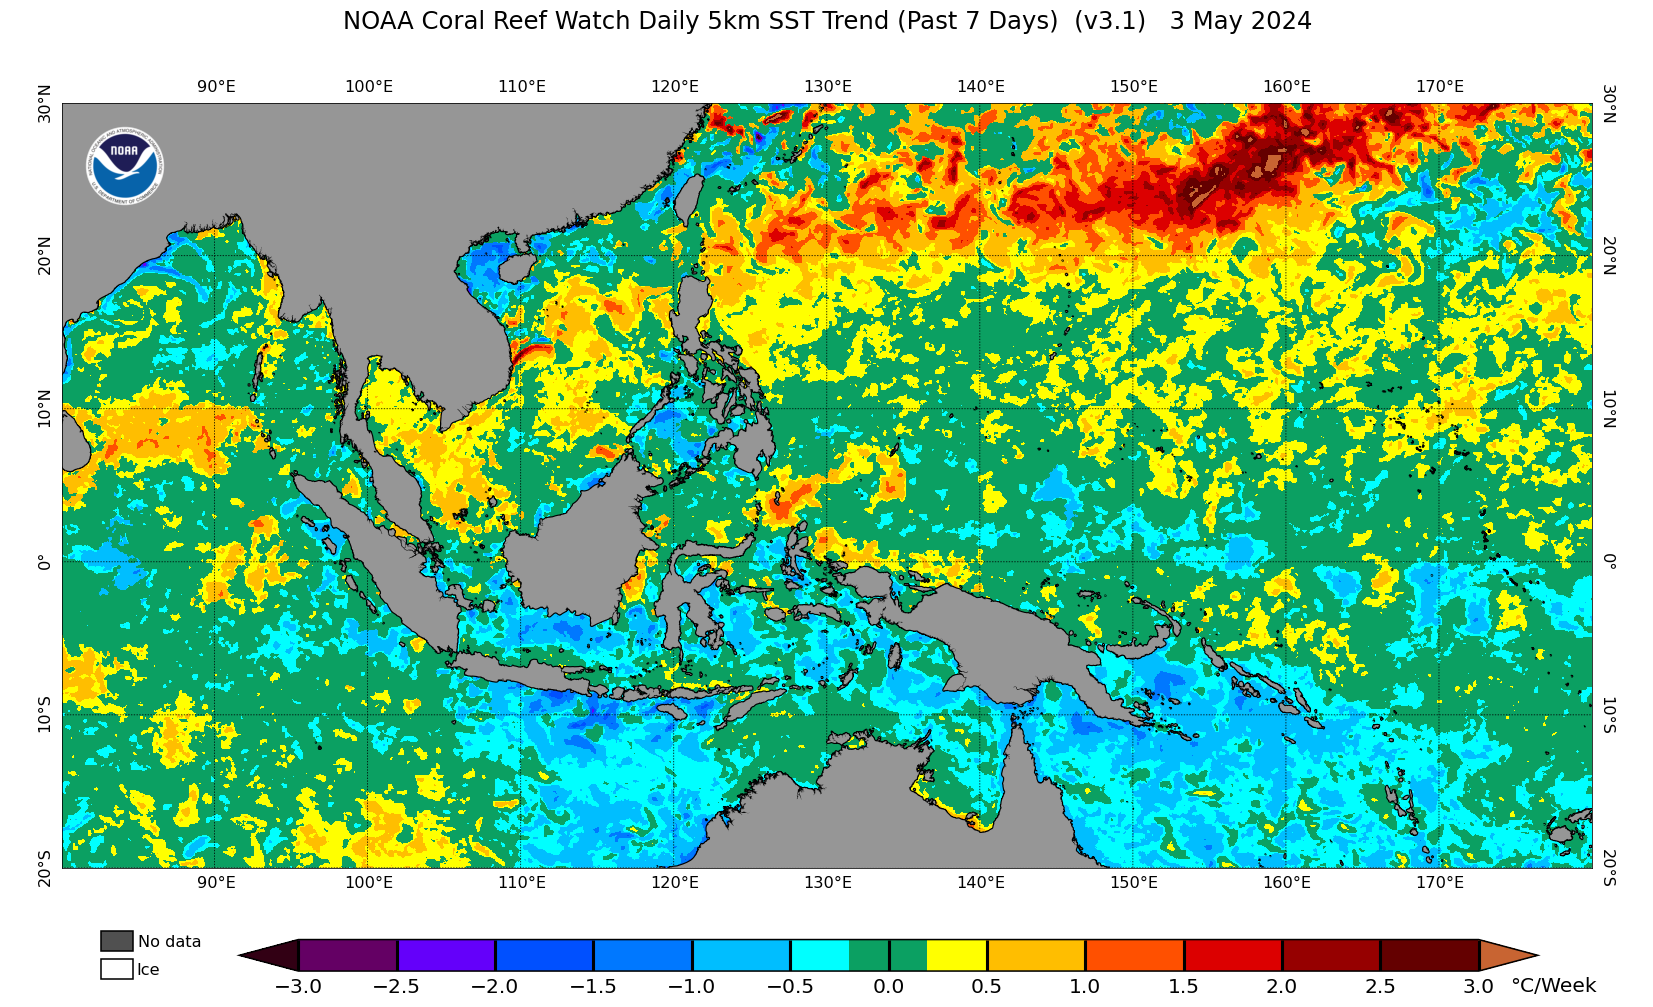
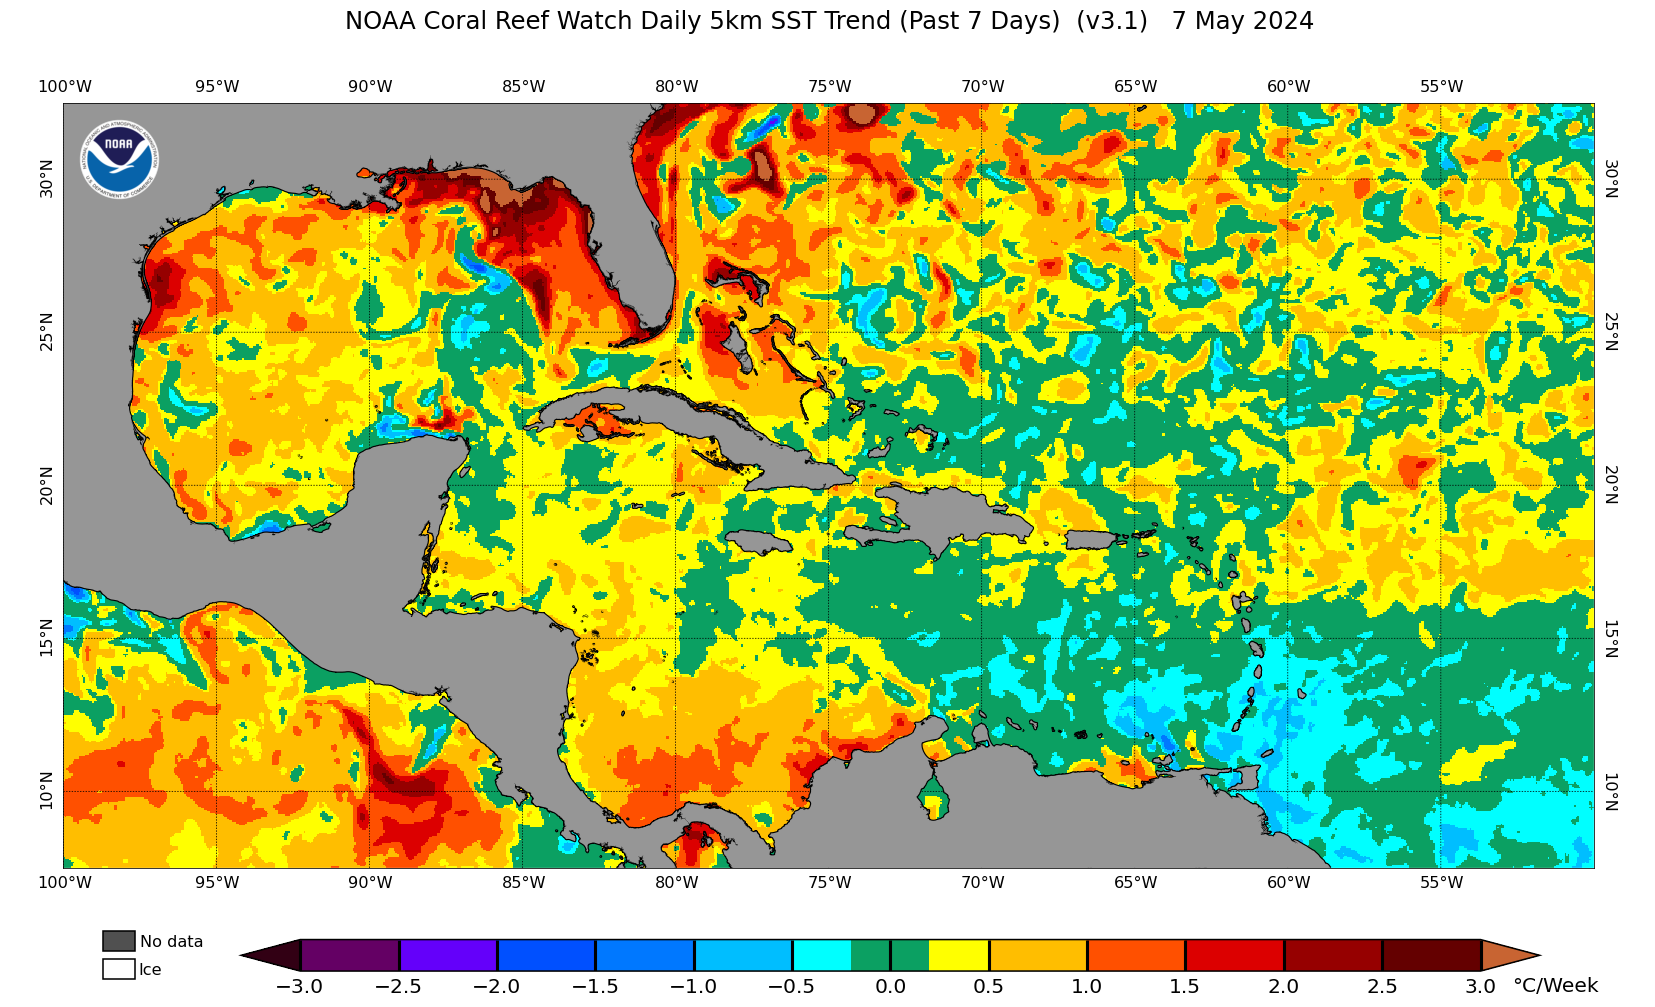
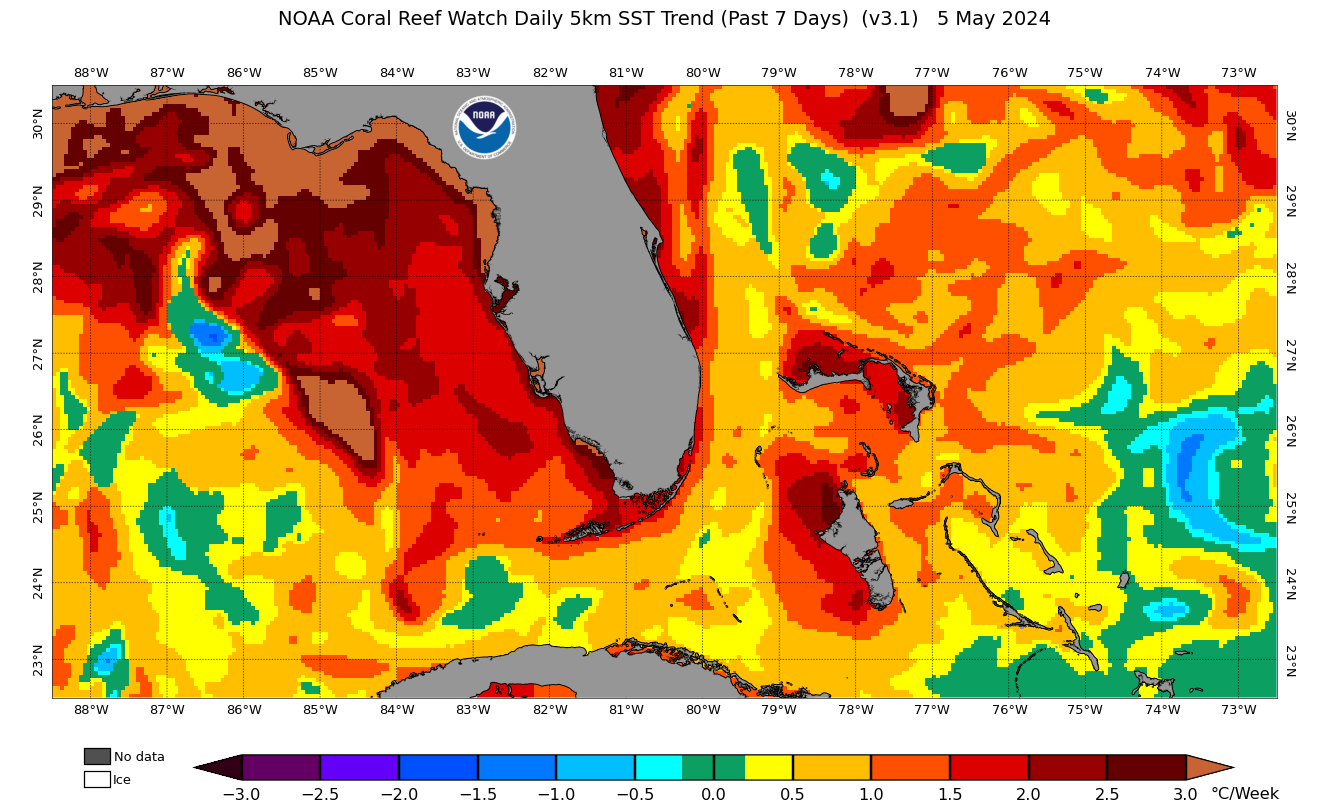
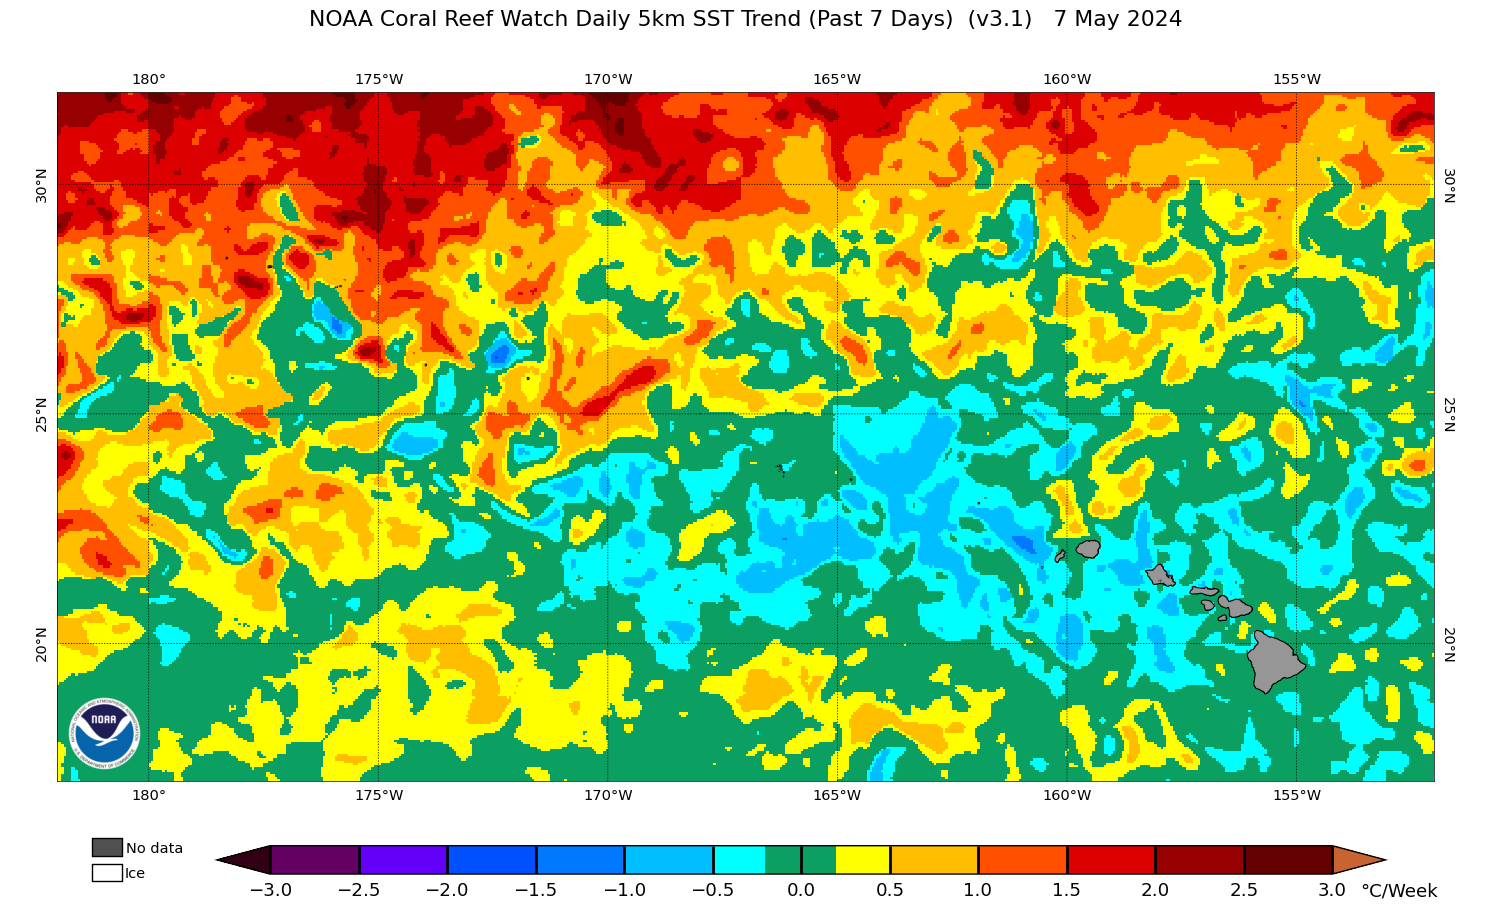
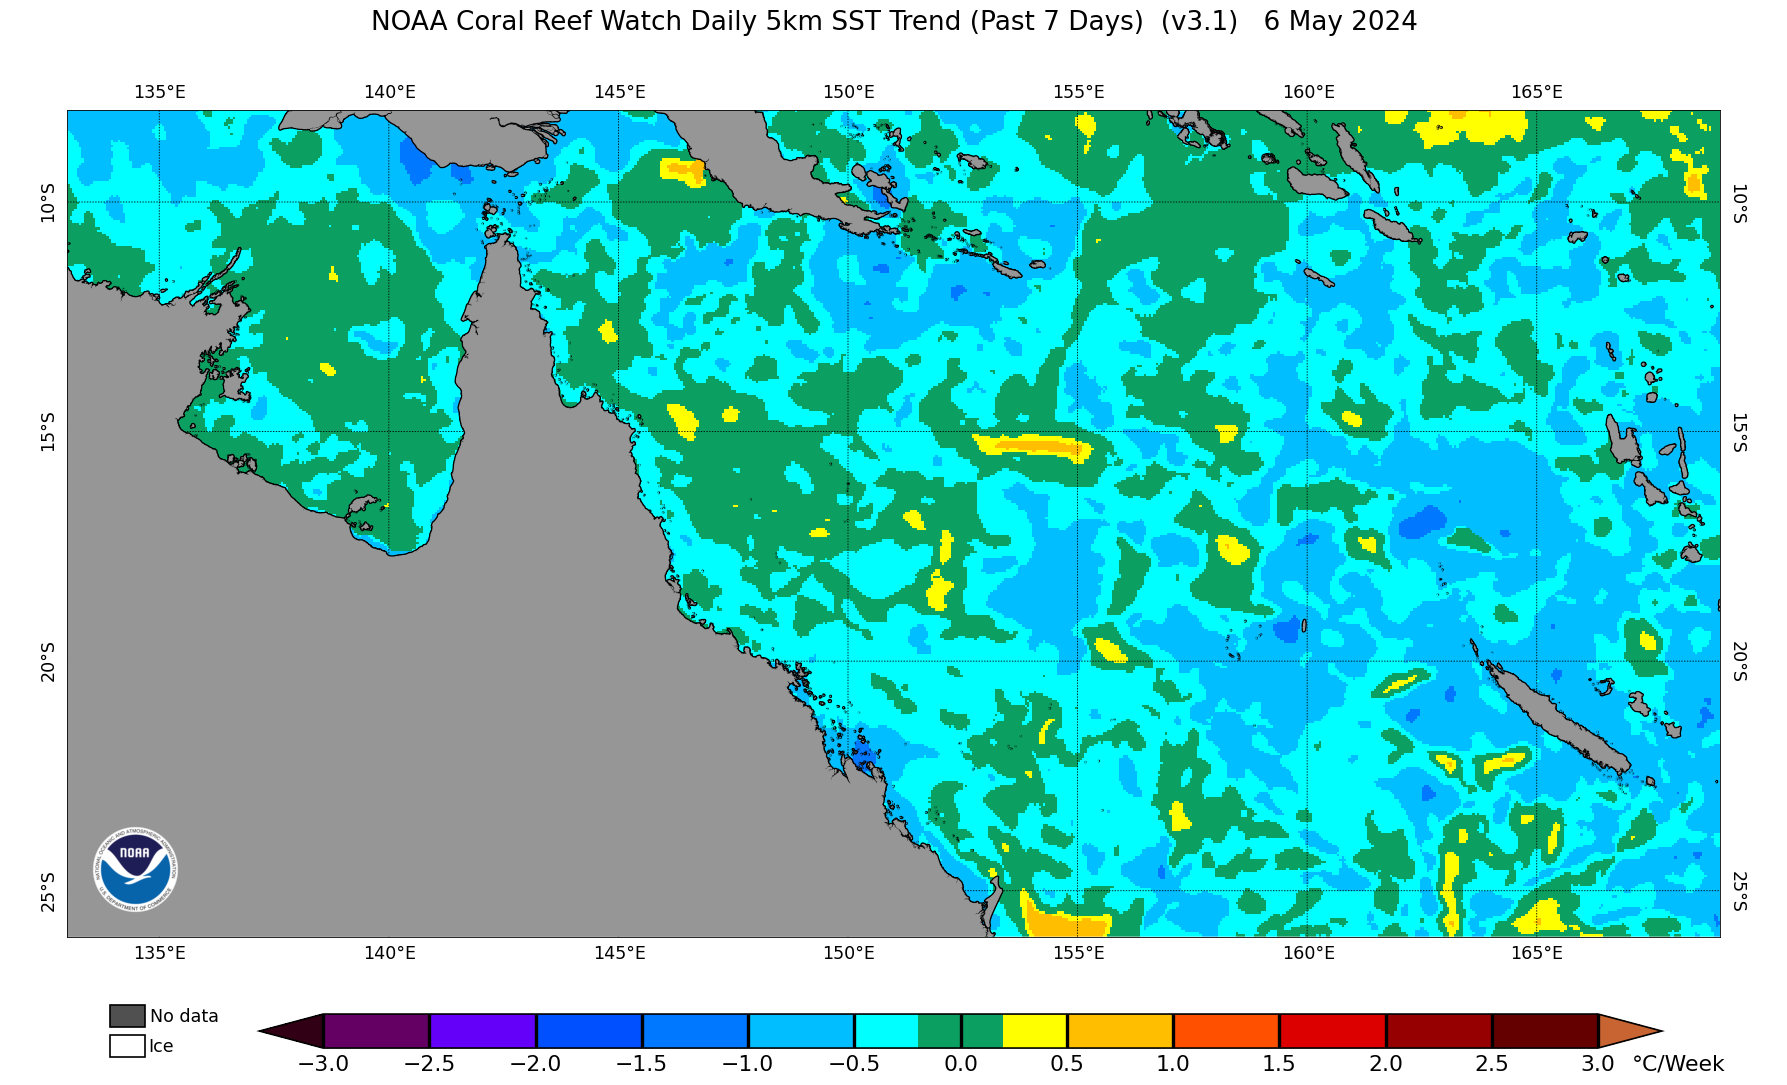
, as the 50km Bleaching Alert Area is based on a half-week (3 or 4 days) composite of 50km SSTs (but with much less SST variability due to its much coarser spatial resolution).For the 5km 7-day SST Trend product, which is updated daily, CRW provides information on the pace and direction of the SST variation and thus coral bleaching heat stress, if present, over the past seven days. Introduced in CRW's v2 product suite, and maintained here in v3.1, the composite SST Trend product includes seven daily global SSTs in its calculation. Pixels colored in green have insignificant trends, due either to small SST trends (within the range -0.2 to 0.2 °C) or trends that failed the two-tailed Student's-t test for the 20% significance level with five degrees of freedom.
All other v3.1 5km products presented here (excluding the monthly and annual composites) are single-day products, which are updated daily. Normally, processing of the current day's products, which occurs midday U.S. Eastern Time, produces the data for yesterday's date. For example, data processed on a Wednesday afternoon will include all observations made on Tuesday (independent of time zone) and will produce images that carry Tuesday's date.
More information on the NOAA CRW 5km satellite product algorithm and v3.1 product updates can be found in
Liu et al. 2014![]() and
Skirving et al. 2020
and
Skirving et al. 2020![]() , respectively.
, respectively.
Click here for CRW's methodology web page, detailing our v3.1 daily global 5km products, climatologies, composites, animations, and data.
Click here for CRW's tutorial about coral reefs, coral bleaching, satellite remote sensing of the marine environment, and our daily global and regional 5km satellite products.
CRW developed the v3.1 5km coral bleaching heat stress products with funding support from the NOAA Coral Reef Conservation Program. The first phase of the product release was completed April 11, 2018, with products spanning 1985-2017; the full release was completed August 1, 2018, with the addition of 2018-present data.
CRW's first-generation (heritage) near real-time twice-weekly global 50km satellite coral bleaching heat stress monitoring products were operational at NOAA until April 30, 2020, when they were offically retired, and succeeded by CRW's next-generation operational daily global 5km coral bleaching heat stress monitoring products (presented on this page). The heritage 50km products served the U.S. and international coral reef communities for more than 20 years (1997-2020). While the 50km products no longer update in near real-time, due to their retirement, since they served as vital tools for our users for so many years, archived 50km data and images are still available on the CRW website.
There are some differences between the 5km and 50km product suites in certain areas of the globe, and user discretion is advised. We have found the 5km product suite is more accurate due to our use of a next-generation, higher quality SST analysis; a next-generation SST algorithm based on multiple satellites/sensors; and an improved climatology.

