|
|
|
|
|
|
|
|
|
|
||
|
|
|
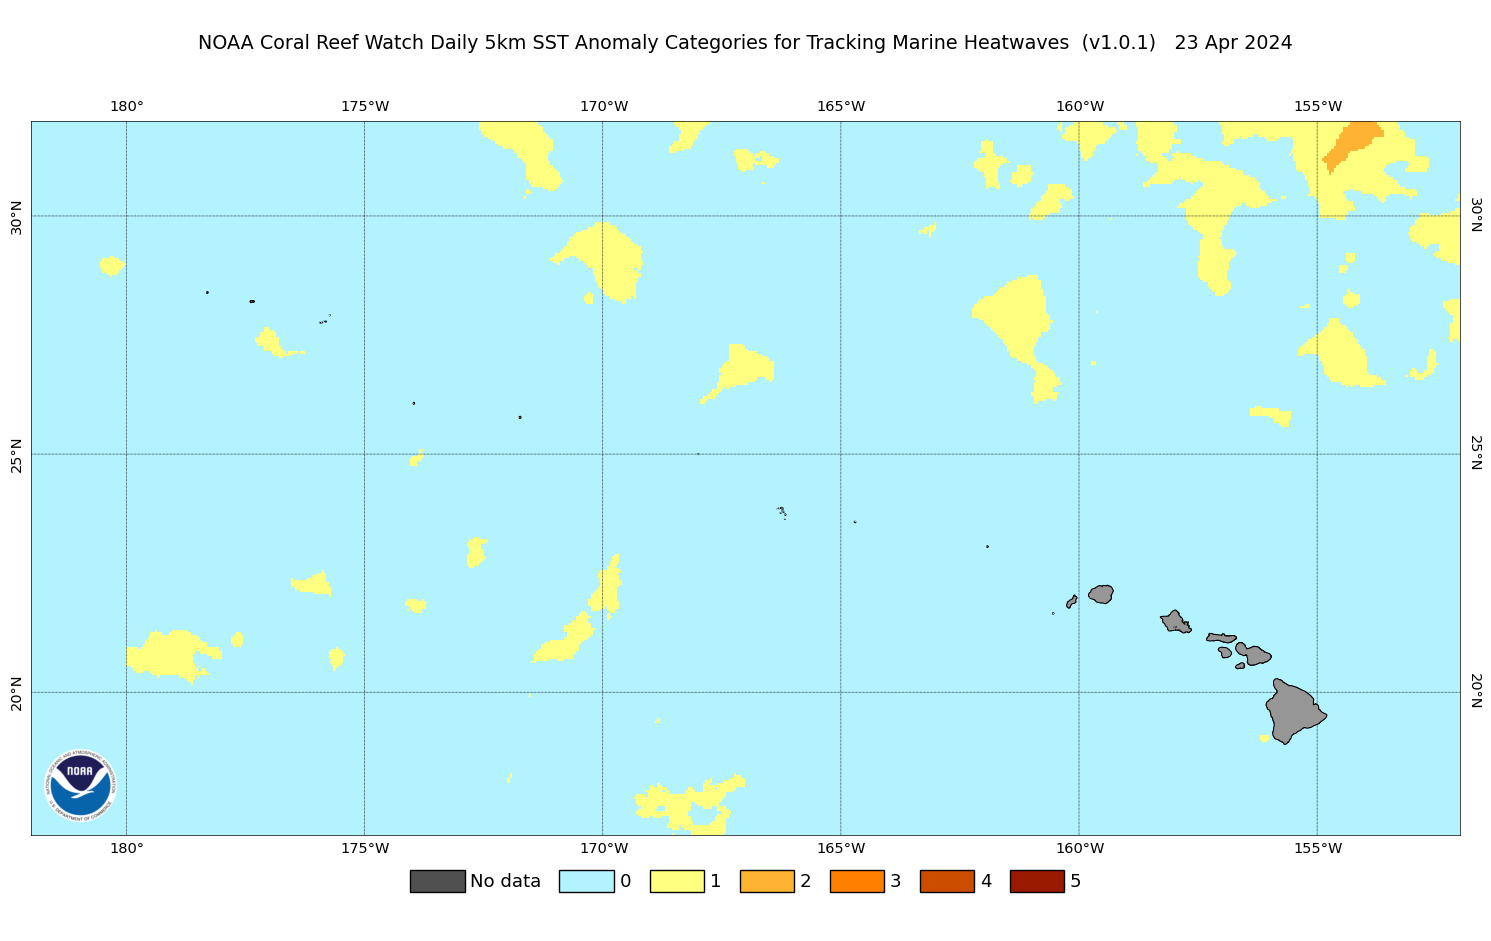
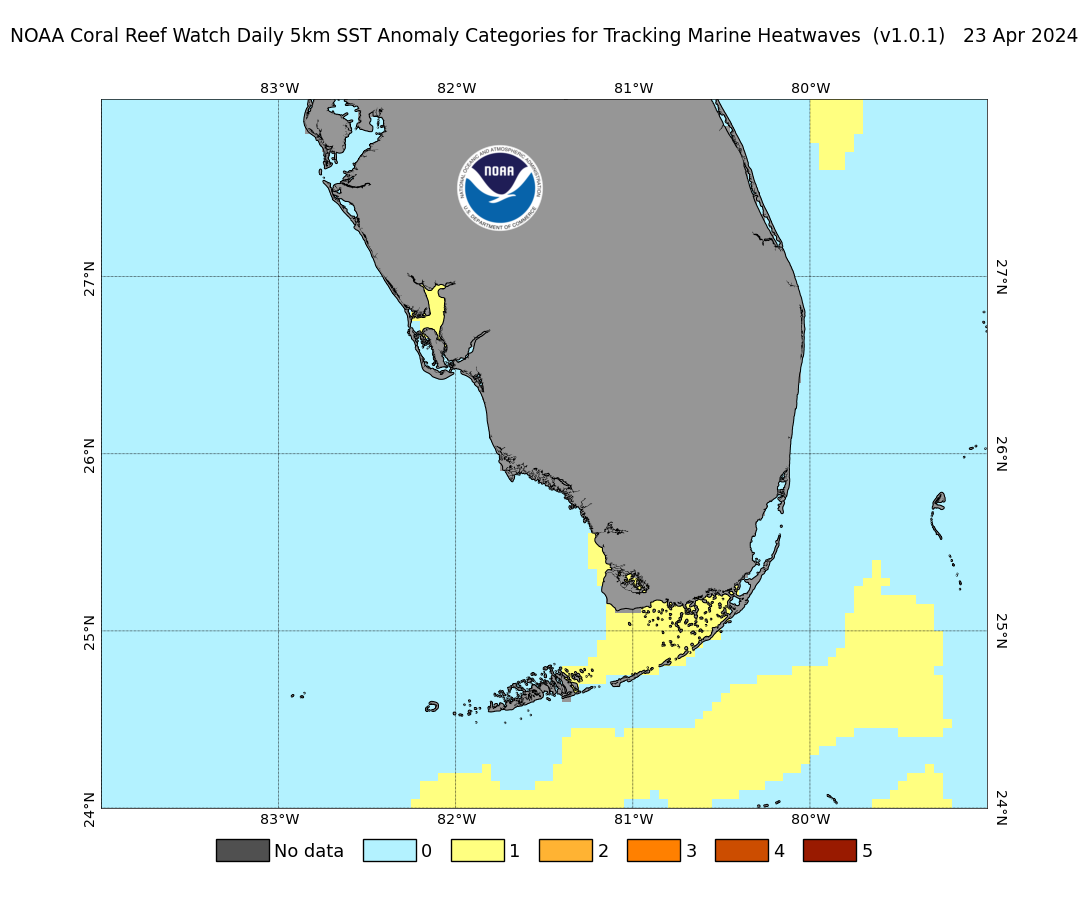
Product Description
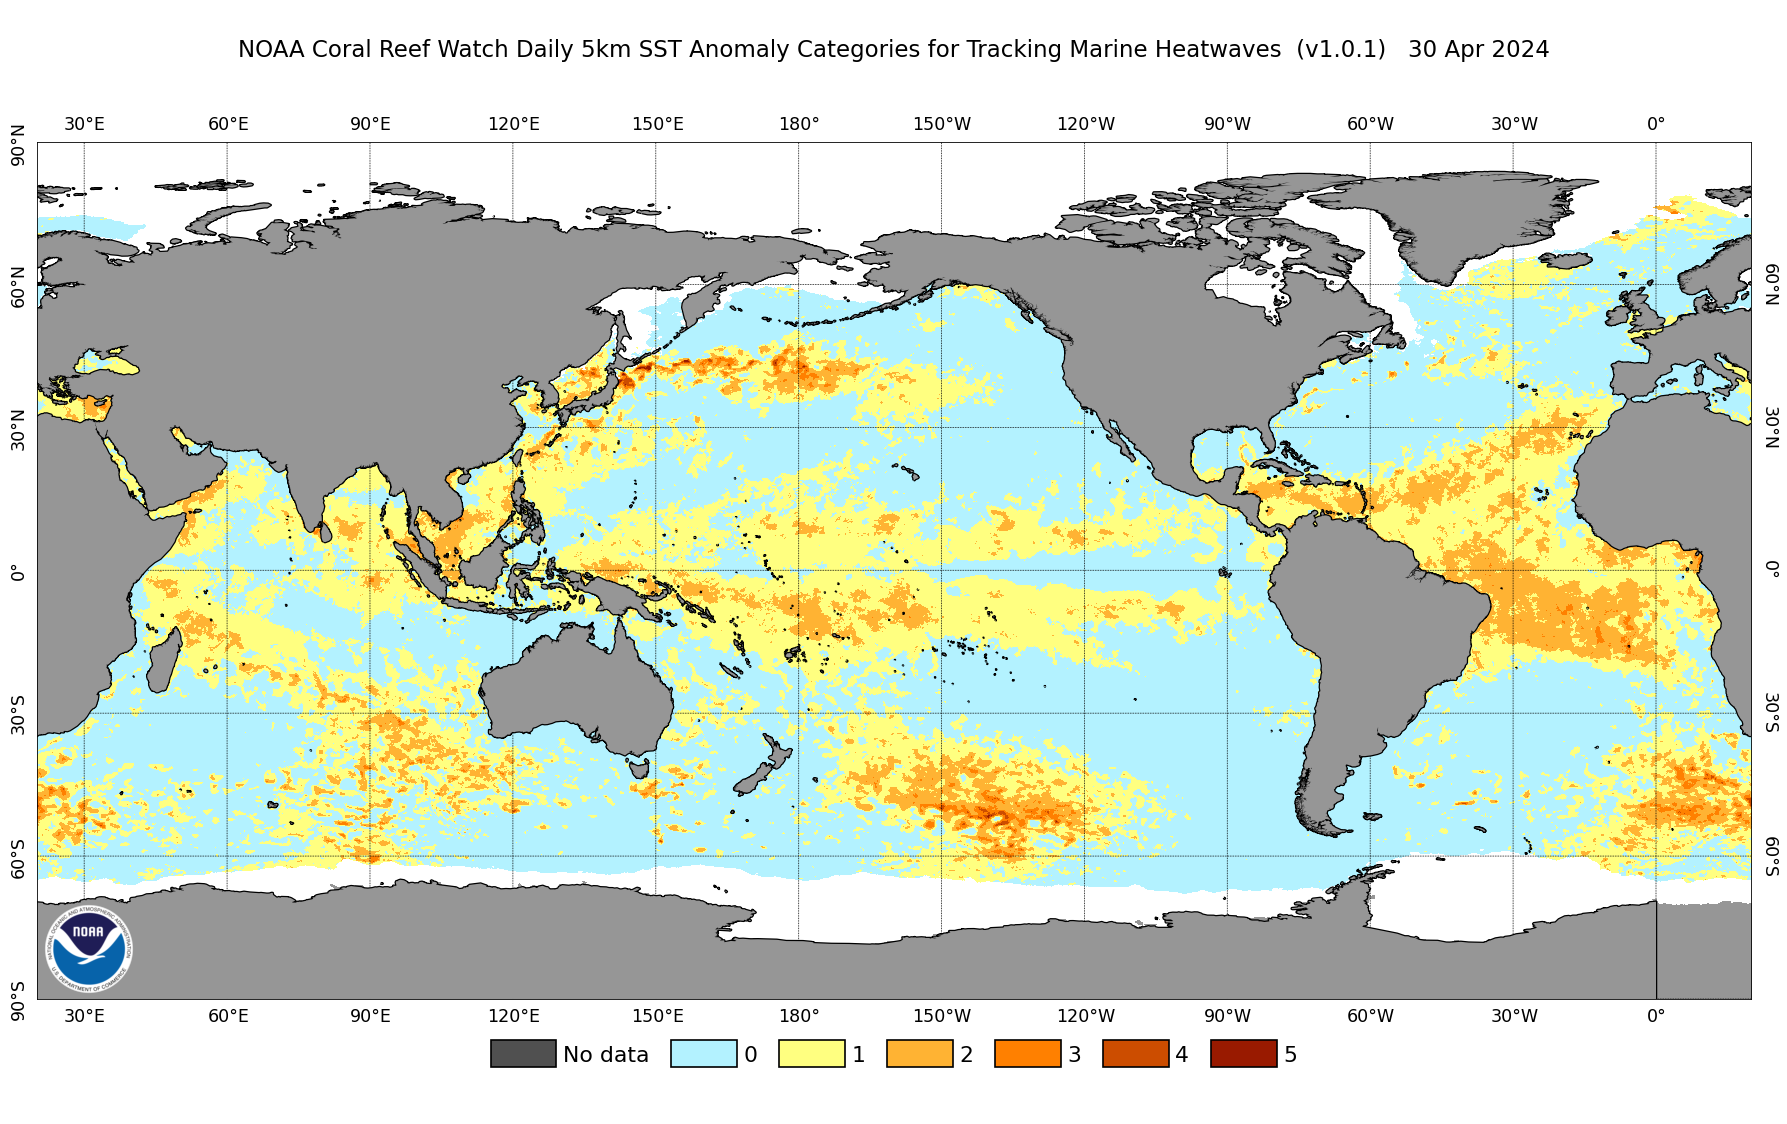
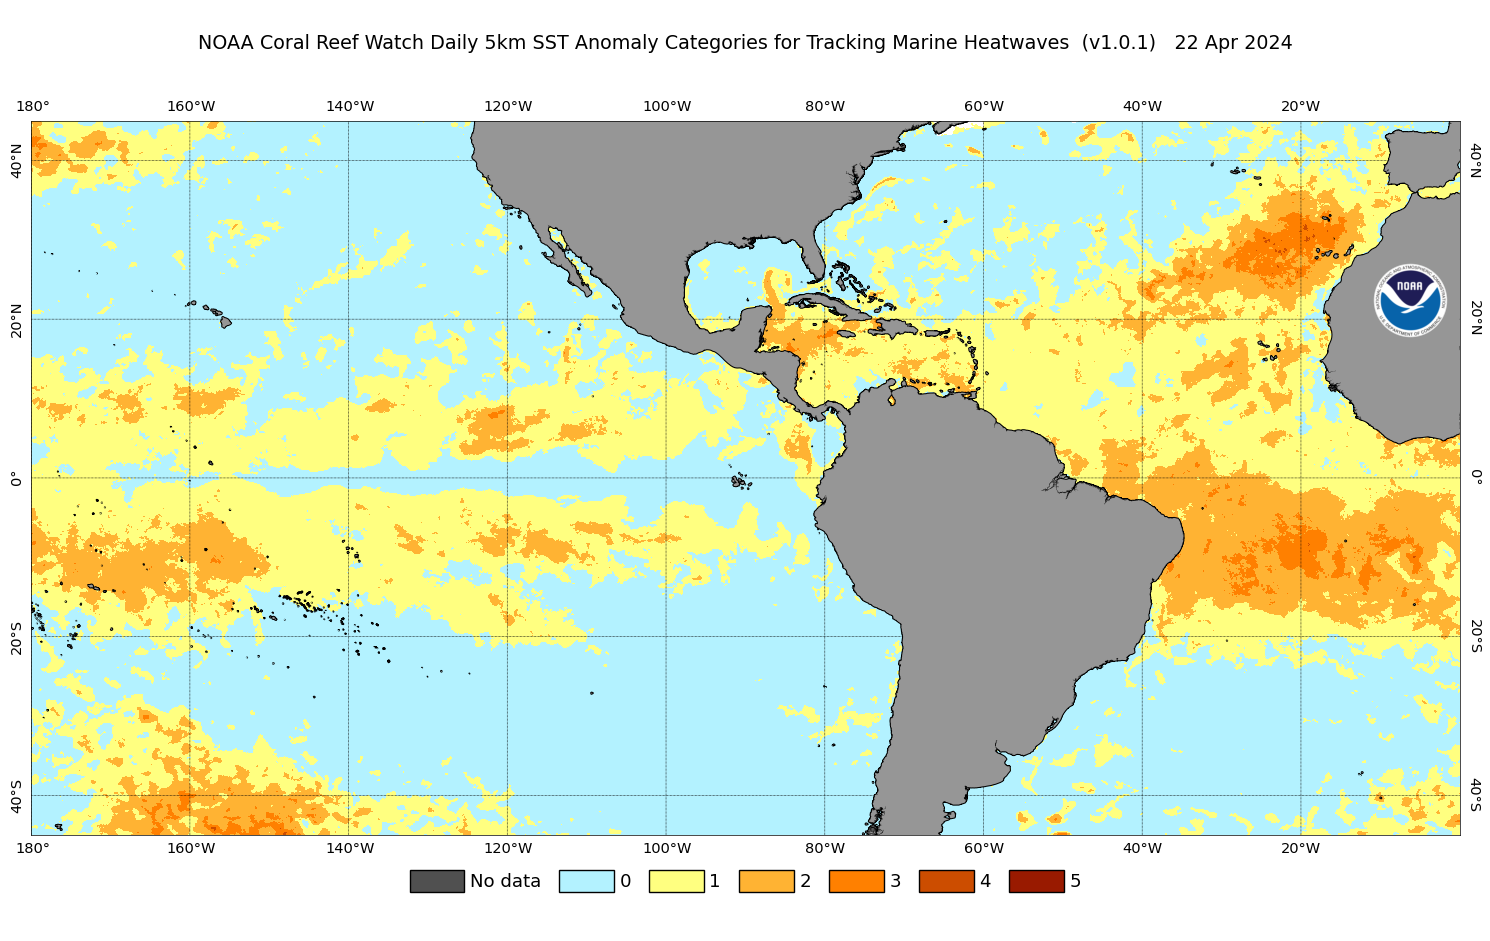
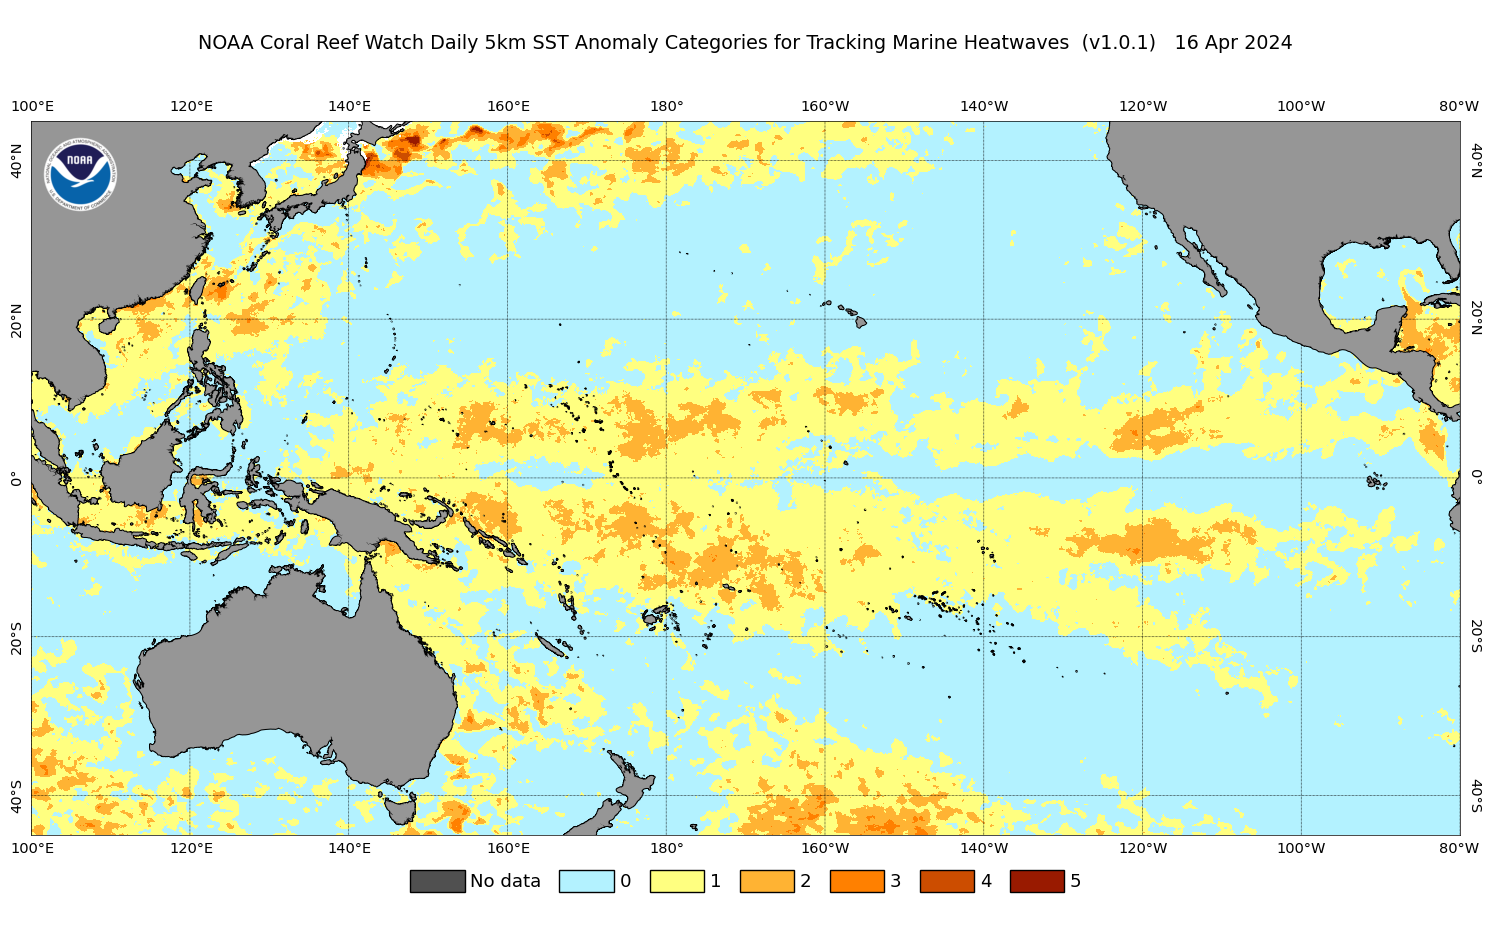
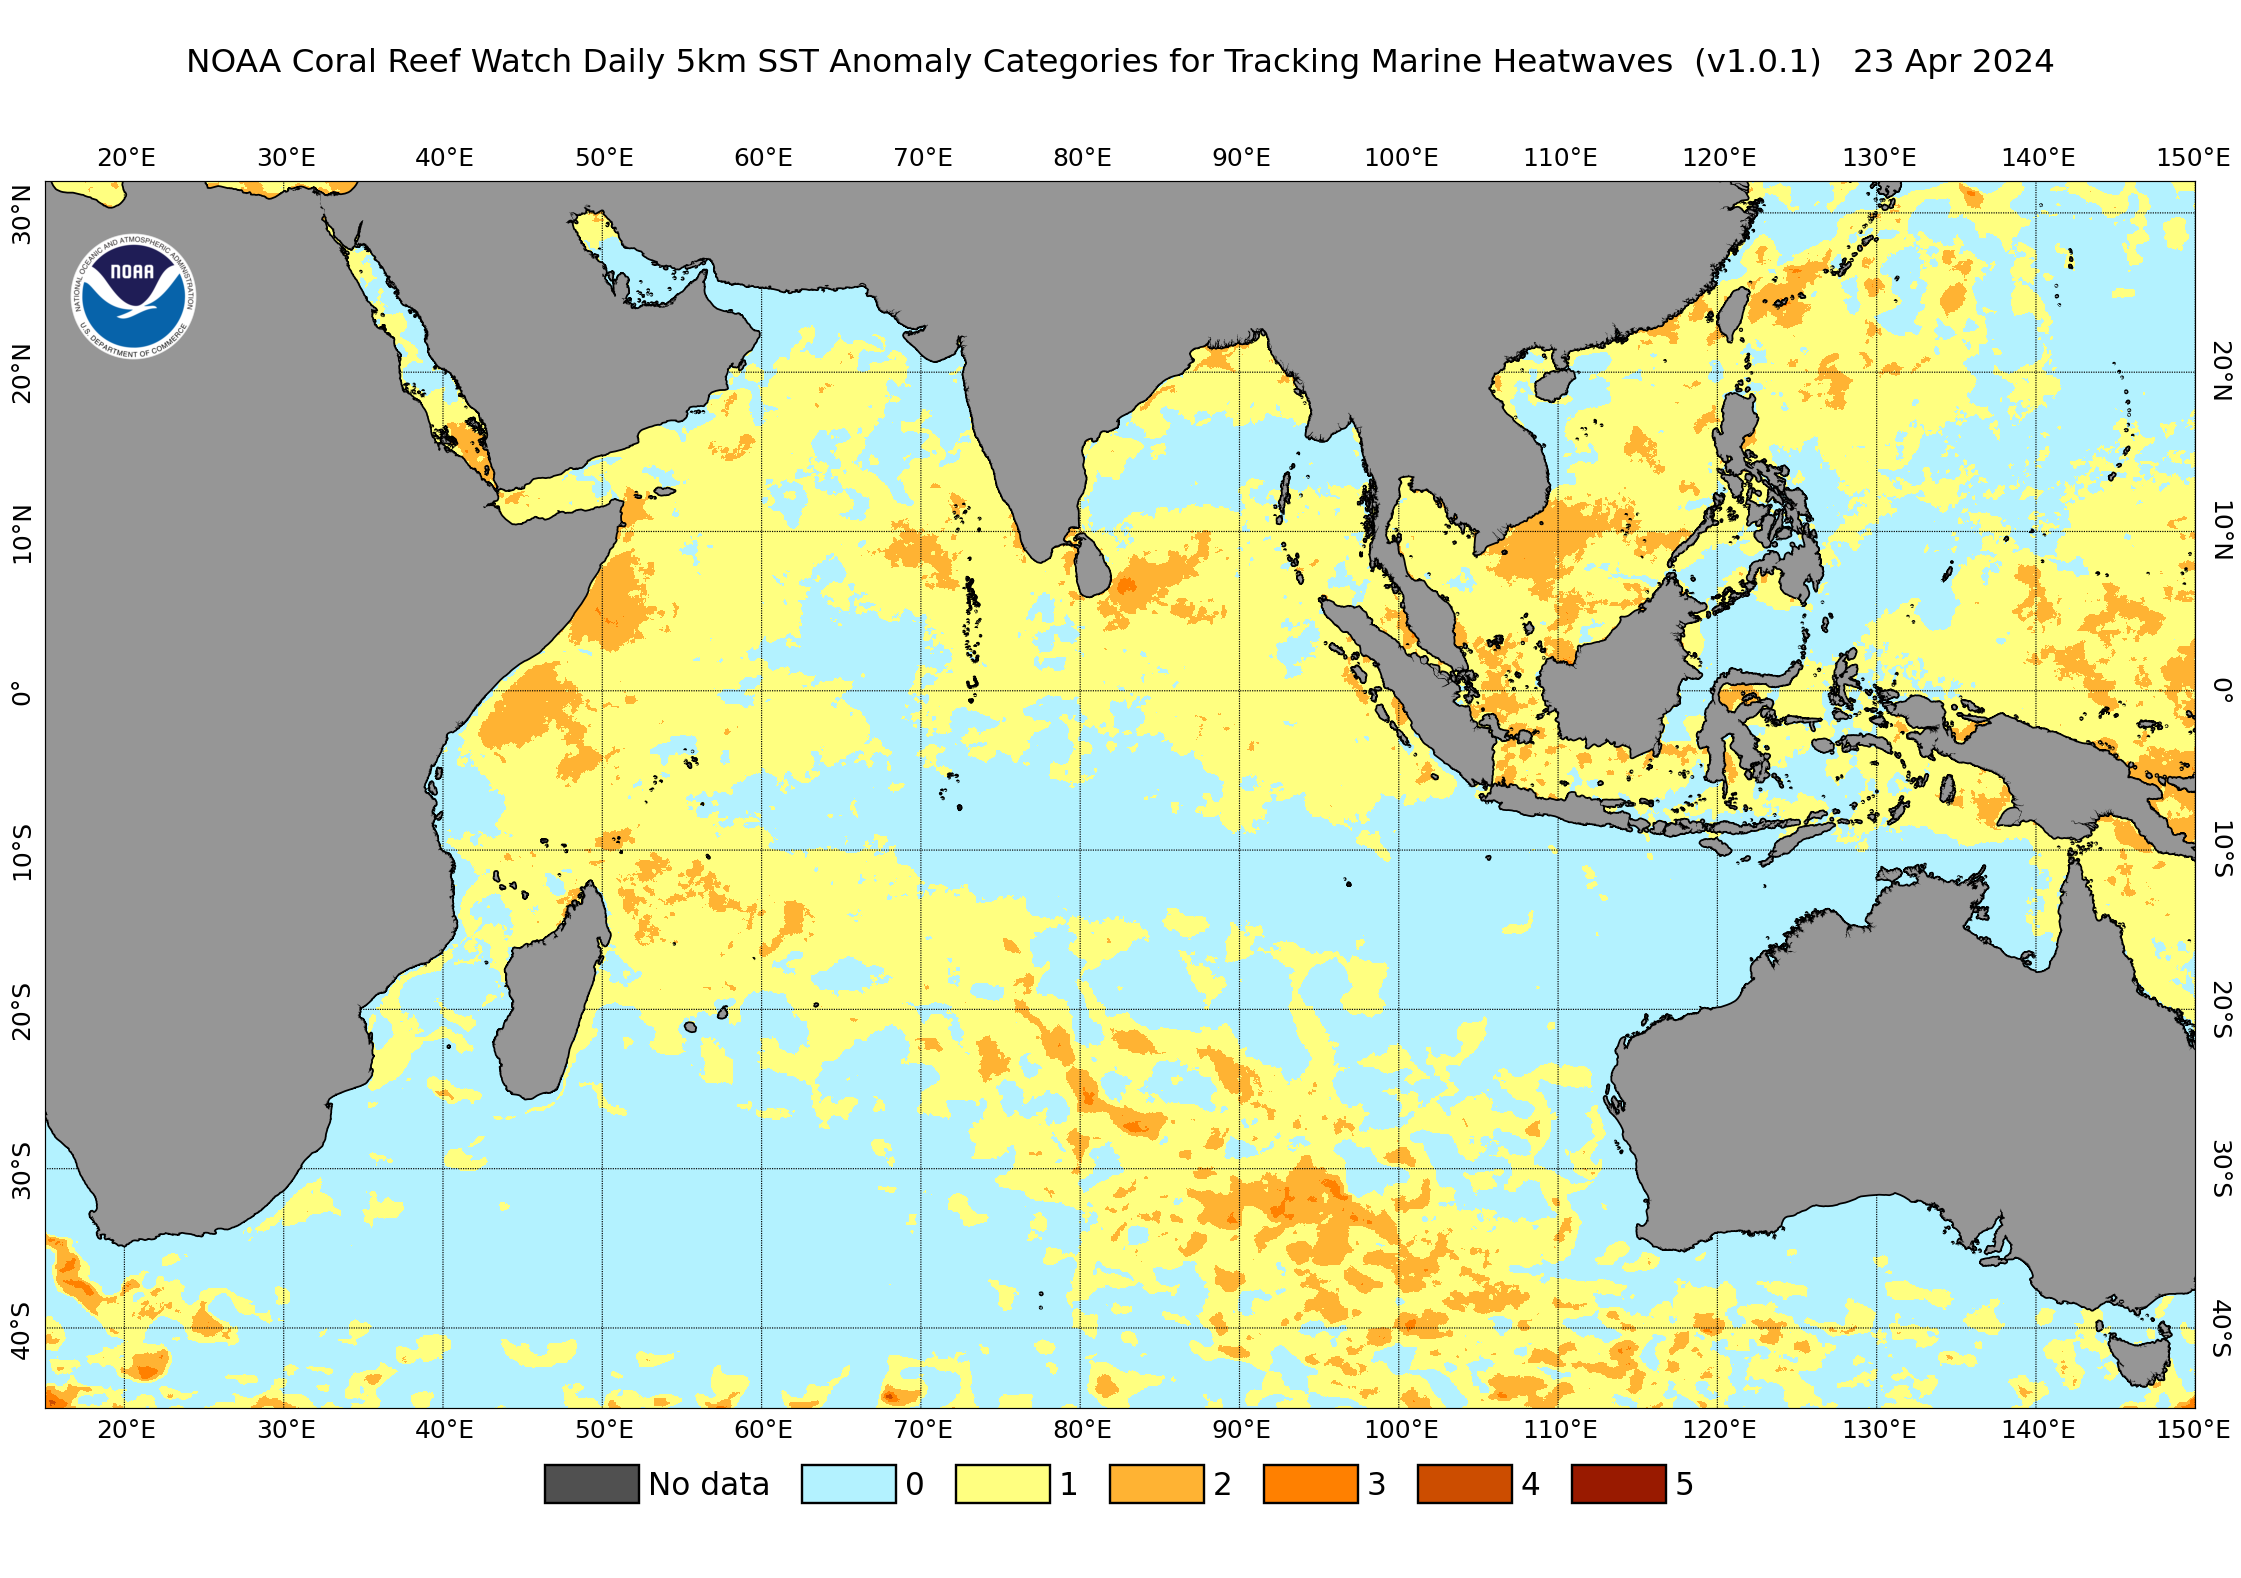
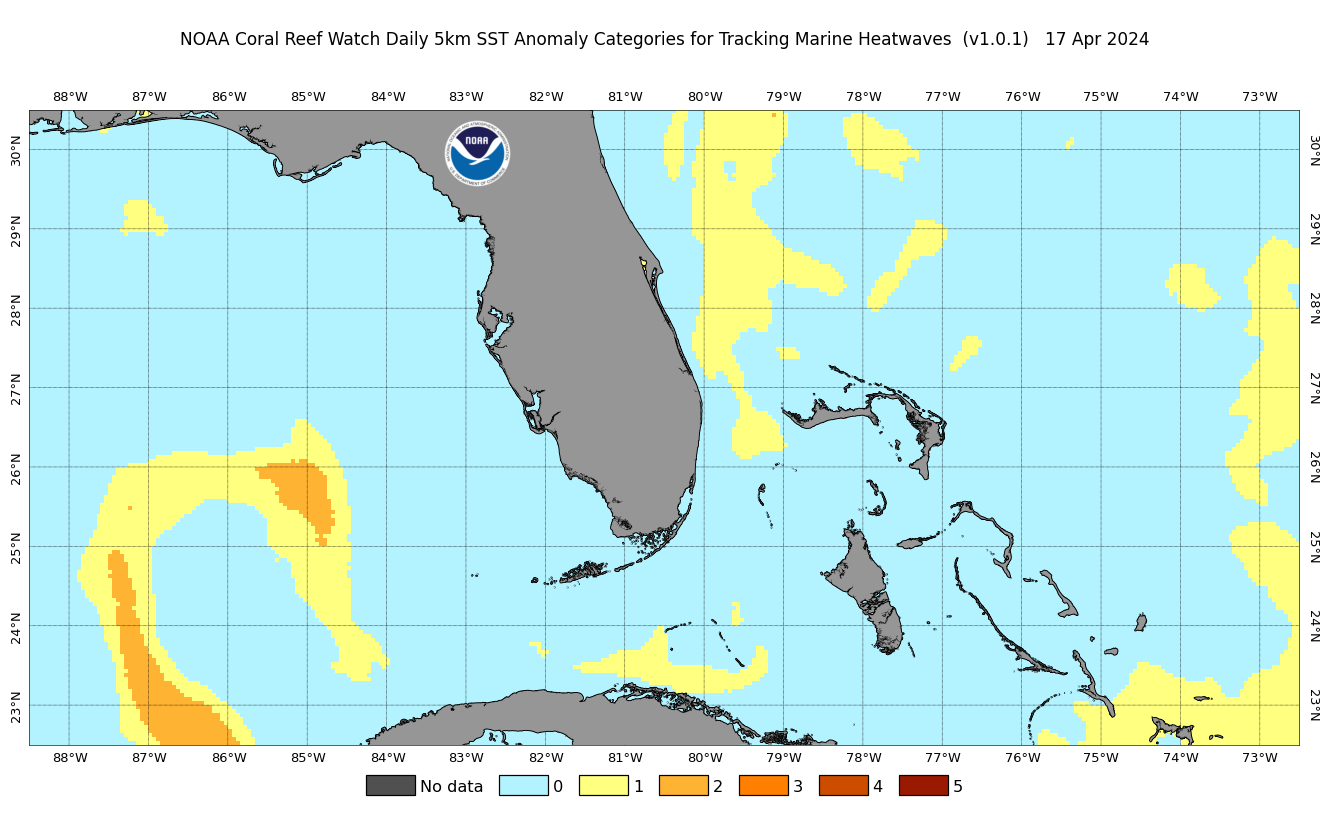
Marine Heatwaves are prolonged periods of anomalously high sea surface temperature (SST). In effect, they are categorized anomalies
of SST compared with a long-term, high, daily SST threshold. The daily global 5km-resolution Marine Heatwave Watch (MHW) product presented
here is a generalized version of the NOAA Coral Reef Watch (CRW)
daily global 5km satellite Coral Bleaching HotSpot product. It isn't aimed specifically
at corals and the warm season for each coral reef worldwide, but instead provides a general description of oceanic heat stress
that can occur at any time of year, at any given location, and is likely applicable to and impacting a broader range of marine life.
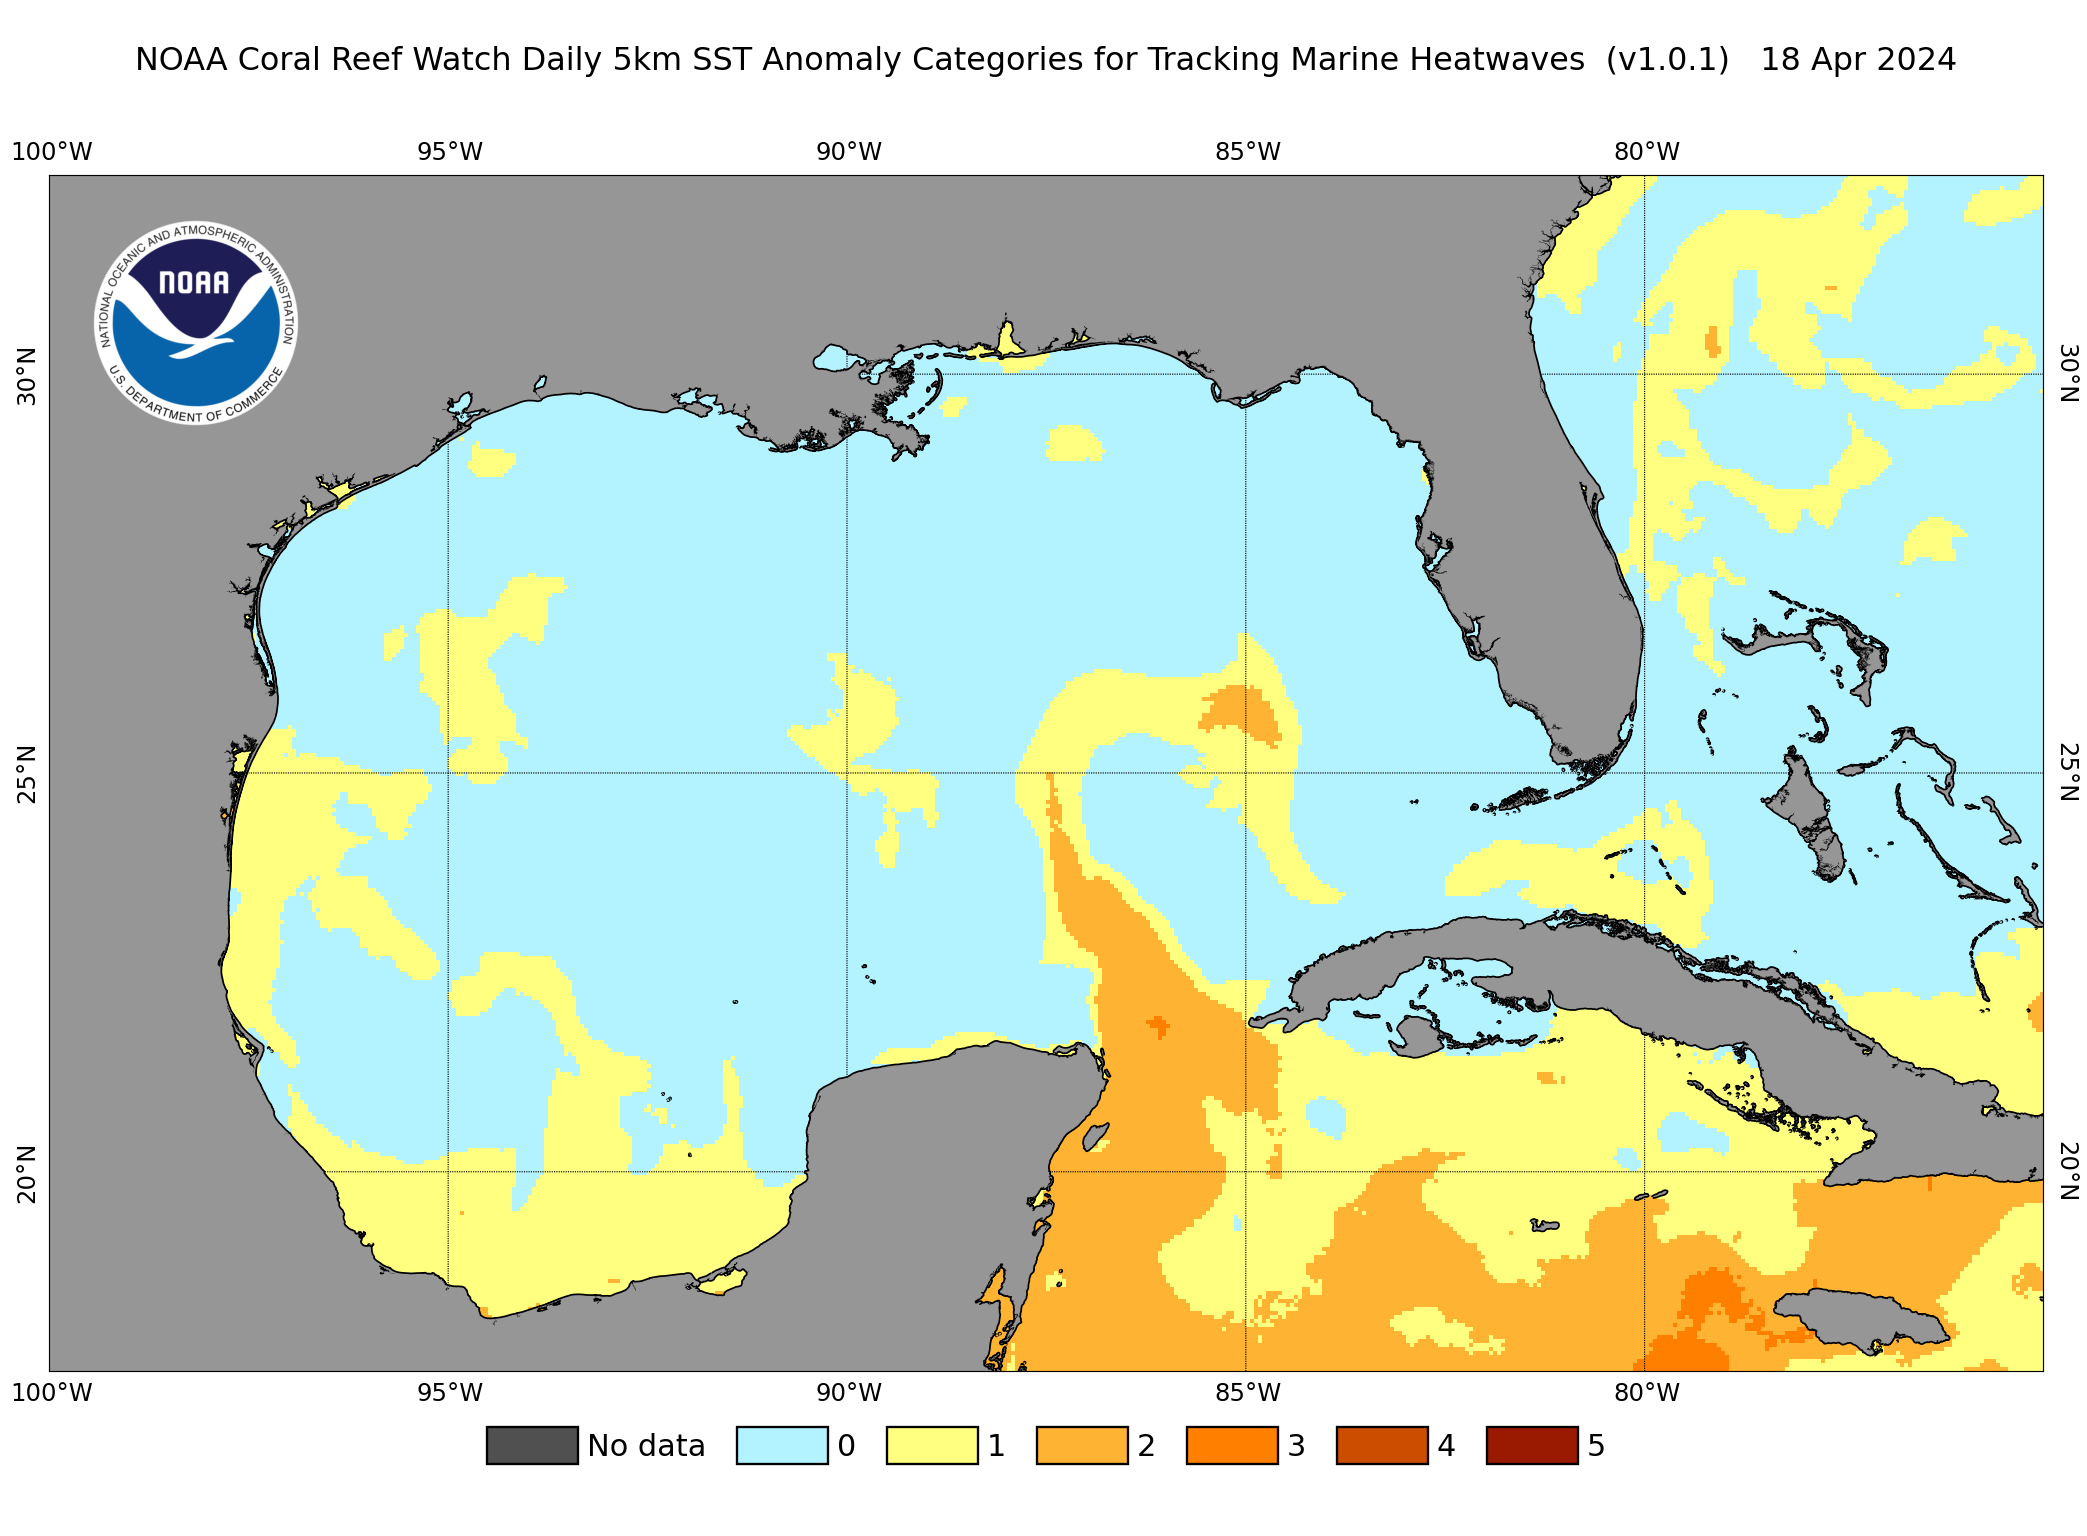
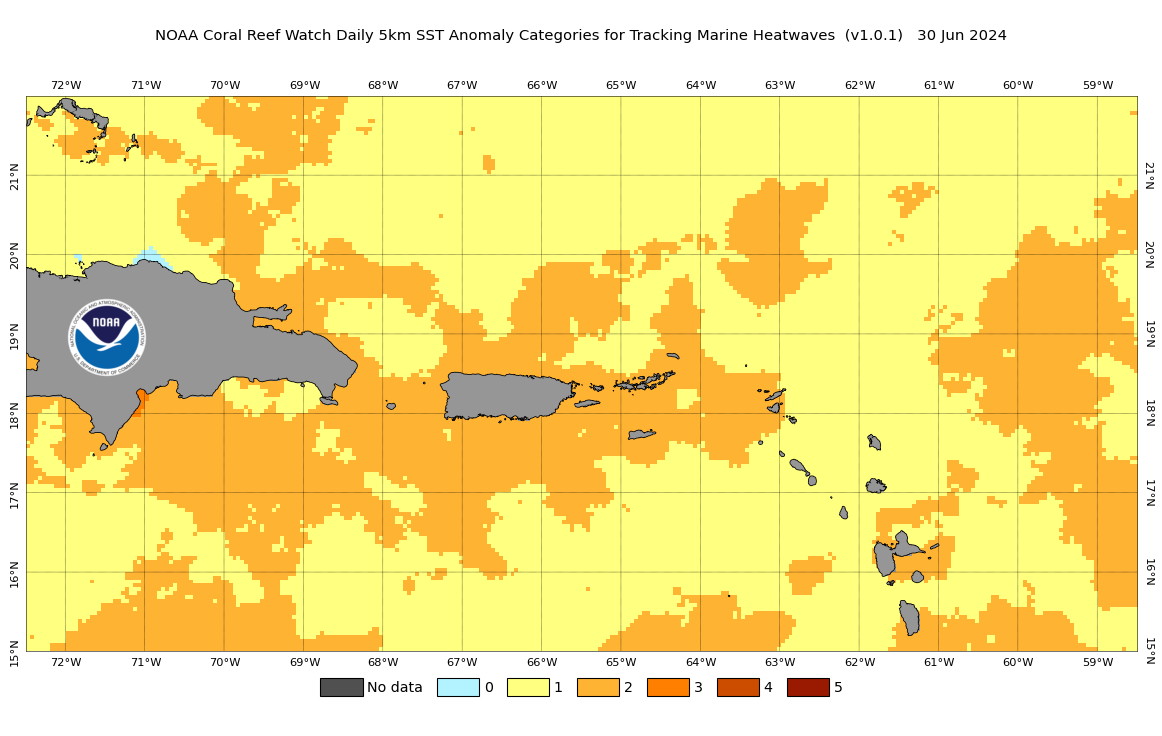
The MHW product is derived by applying the Marine Heatwave algorithm of Hobday et al. (2018)1 to the CRW
daily global 5km CoralTemp satellite SST data product.
It has near real-time and historic components and spans 1985 to the present.
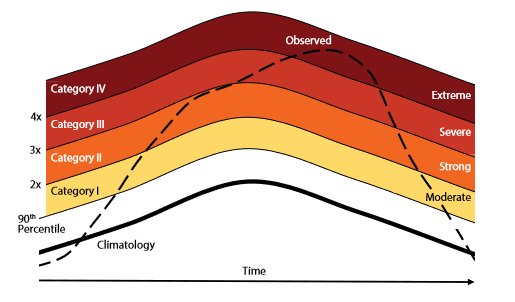
Methodology Climatology CoralTemp SST values from January 1, 1985 to December 31, 2012 were used to derive the climatology. For each day of the year, both an average and a 90th percentile SST value were created. These two values were calculated from the SST in an 11-day window centered on the day of the year, extended over the 28 years of the climatology. This means that each day's average and 90th percentile values were calculated from 308 values (i.e., 11 x 28). Note that the SST value for February 29 in each leap year was left out of the overall climatology calculation to simplify the daily climatology calculation. When needed, the climatology for February 29 is derived by averaging the climatology values for February 28 and March 1. Since January 1, 1985 is the first day of the dataset, special consideration was given to calculating the climatology average and 90th percentile values for January 1, 2, 3, 4, and 5 of that year. For example, the average and 90th percentile values for January 1, 1985 should have included the SST values from December 27 to January 6 (the 11-day window around January 1) for each year of the climatology. However, since there are no SST values available for December 27-31, 1984, the average and 90th percentile values for January 1, 1985 had to be calculated from the 303 values that are available (i.e., 6 values in 1985 and 11 values from each of the other 27 years of the climatology, giving n=303). It follows then that n=304 for January 2, 1985; n=305 for January 3, 1985; and so on, until n=308 for January 6, 1985 and for every other day of the climatological year. Calculation of Heatwave Category For each day from January 1, 1985 to the present, we calculated the Marine Heatwave category for each 5km satellite pixel grid in the v3.1 daily global CoralTemp SST dataset. We identified a Marine Heatwave if the SST for a particular day was greater than the 90th percentile value for that location. Once a Marine Heatwave was identified, it was categorized based on its intensity, after Hobday et al. (2018)1. Intensity categories were defined based on the difference between the average and 90th percentile values for each 5km pixel (diff). If the SST for a particular day was ≥ (average + diff) and < (average + 2diff), it was categorized as being Marine Heatwave Category 1. If the SST for a particular day was ≥ (average + 2diff) and < (average + 3diff), it was categorized as being Marine Heatwave Category 2; and so on (Figure 1).
Since the climatology does not have a value for February 29 in each leap year, when this value was needed, both the average
and 90th percentile SST values were calculated using an average of the SST values from February 28 and March 1.
Relevant references:
|