A climatology, by definition, is the long-term condition for a specified time period.
The climatology described here, for NOAA Coral Reef Watch's (CRW) Version 3.1 (v3.1) Daily Global
5km Satellite Coral Bleaching Heat Stress product suite has a baseline (or reference)
time period of 1985-1990 plus 1993 only (see below for more details).
This climatology was derived using daily satellite sea surface temperature (SST) values, from 1985-2012, of
CRW's v3.1 daily global 5km CoralTemp satellite SST data product.
This follows CRW's currently-established methodology1
for its daily global 5km satellite coral bleaching heat stress products. Note that although we used
data from 1985-2012 to derive the climatology, an adjustment (see below) made the resultant
climatology represent the baseline (reference) time period of 1985-1990 plus 1993 only.
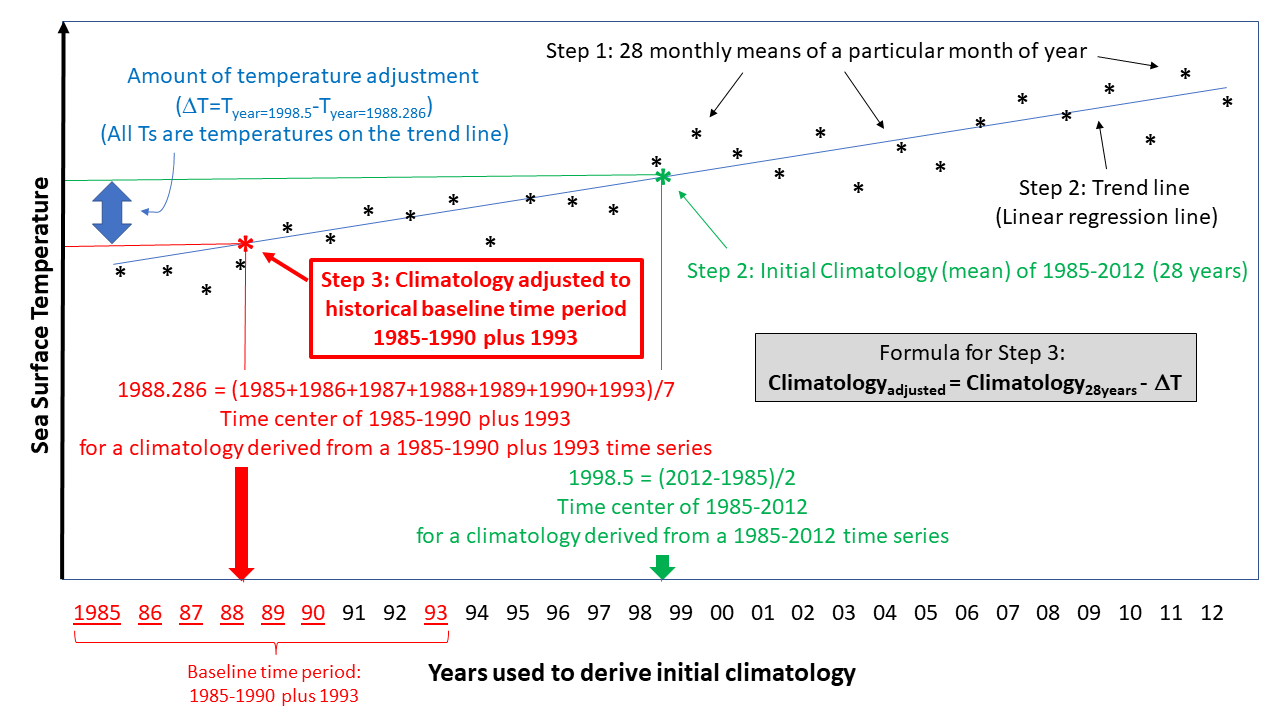
The climatology was created via the following steps (also displayed as 5 figures further down the page):
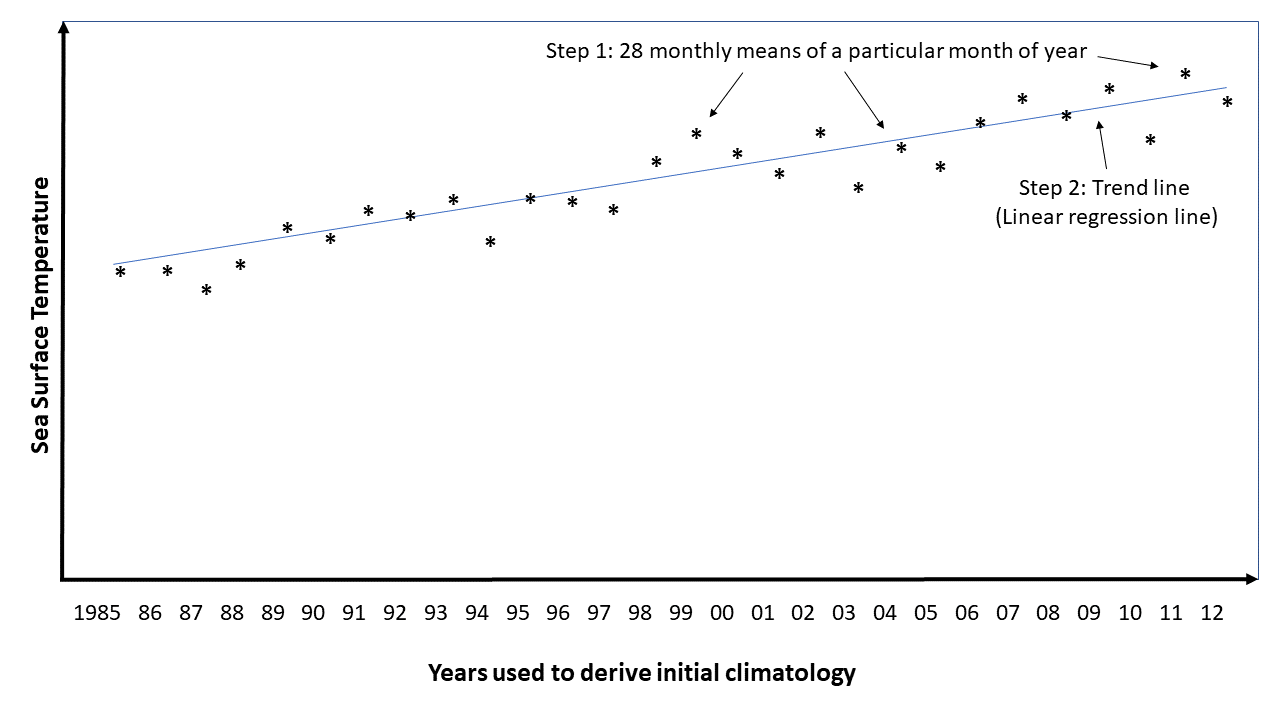
1) We calculated the average temperature for each individual month between 1985 and 2012 for each individual satellite pixel.
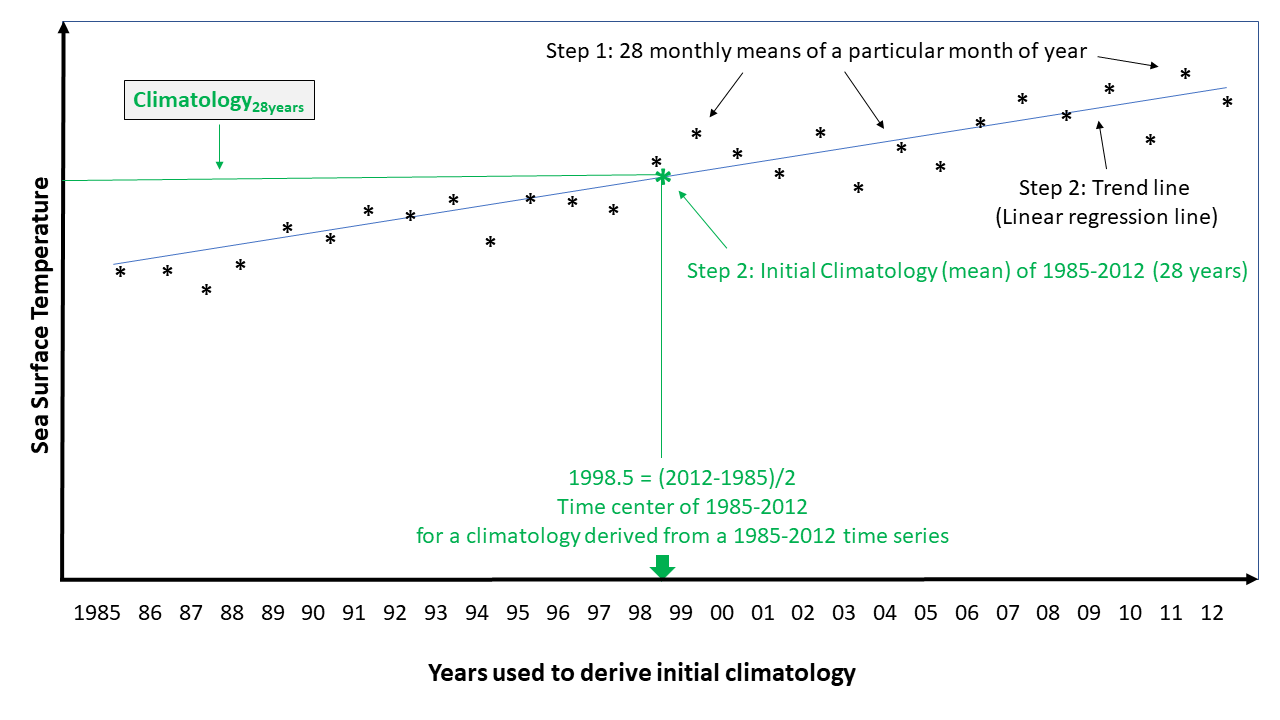
2) Next, for each calendar month, we computed both (a) an initial 28-year monthly mean climatology, and (b) the linear regression of
the monthly average temperatures over the 28-year period (1985-2012) of the CoralTemp SST dataset.
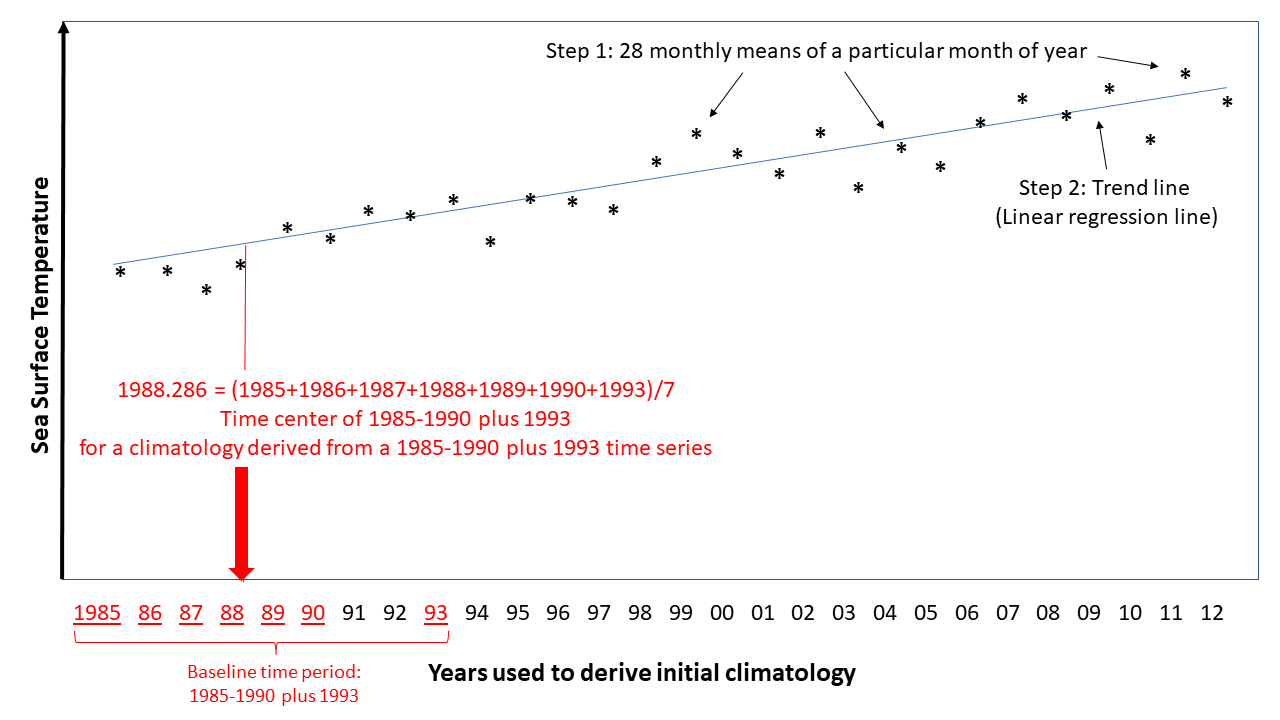
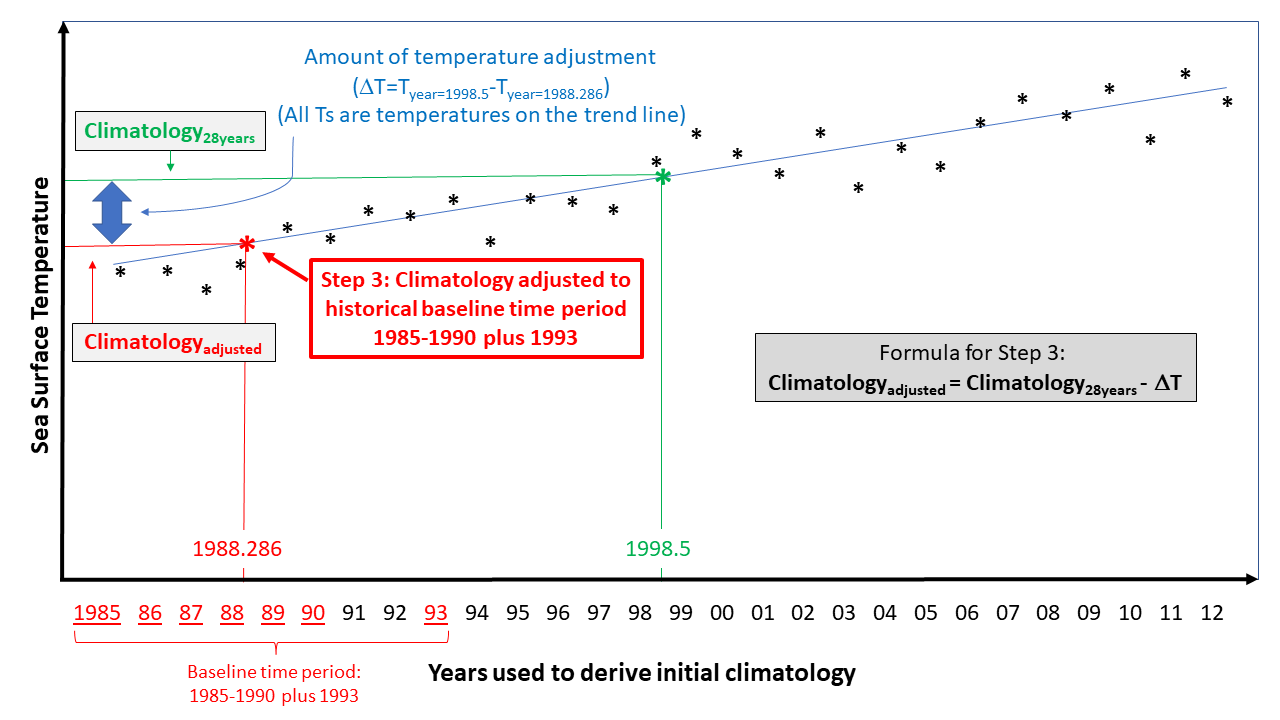
3) Finally, we re-centered the initial 28-year monthly mean climatology for a calendar month ---- from the time center
(temporal mid-point) of 1985-2012 (i.e., 1998.5), to the time-center of 1985-1990 plus 1993 (i.e., 1988.286).
The resultant, final climatology has a baseline (reference) time period of 1985-1990 plus 1993 only.
4) The 12 monthly mean SST climatologies described in (3) above are used to derive CRW's daily global
5km SST Anomaly product. The maximum pixel-based values from among the 12 monthly mean SST climatologies form the Maximum
Monthly Mean (MMM) SST climatology, which is then used to derive CRW's daily global 5km coral bleaching heat stress products.
The following 5 figures provide a pictorial description of the steps CRW used to create the 5km climatology. Note that the data values
and linear trend line are mock-ups, for demonstration purposes only. At a data pixel/grid, real data may show a positive, negative, or zero trend:
The climatology was derived in this way to allow us to:
-- use a sufficiently long time series (1985-2012) of daily satellite SST values to adequately capture inter-annual SST variability in the
initial climatology, but then
-- maintain, in the final climatology produced, the baseline (reference) time period of 1985-1990 plus 1993. This baseline time period
is used in CRW's heritage 50km climatology and subsequent 5km climatologies (both current and historical)1.
Special note on the climatology baseline (reference) time period:
When CRW first developed its coral bleaching heat stress monitoring algorithm and implemented the derived coral bleaching heat
stress products in near real-time, satellite SST data were only available for the time period 1985-1993. From the available
data to build a climatology, data from 1991-1992 were omitted from the climatology baseline time period, due to their low
accuracy (significant cold bias). Data inaccuracies were caused by intervening aerosol contamination following the eruption
of Mt. Pinatubo on June 15, 1991. Its aerosol cloud spread rapidly around the earth in about three weeks and attained global
coverage by about one year after the eruption. Later, when longer time series of higher-quality satellite SST data became available,
CRW tested whether adding data from 1991-92 and/or more recent years (after 1993) to its climatology baseline time period
would impact the coral bleaching heat stress monitoring algorithm. Addition of these data caused dysfunction of the algorithm
and subsequent coral bleaching heat stress monitoring. Very recently, the quality of reprocessed SST data for 1991-92,
including those used in CoralTemp, has improved significantly. For that reason, we incorporated the v3.1 daily global 5km CoralTemp
SST data from 1991-92 into the derivation of our initial climatology from 1985-2012 (see the processing steps described above). However,
for the final climatology, we adjusted its mean to correspond to the baseline (reference) time period of 1985-1990 plus 1993,
to maintain consistency with our heritage products and to avoid inferring an assumption that corals are able to adapt as quickly as the climate is warming.
1Heron SF, et al. (2014)
Climatology development for NOAA Coral Reef Watch's 5-km product suite. NOAA Technical
Report NESDIS 145. NOAA/NESDIS. College Park, MD. 30pp.