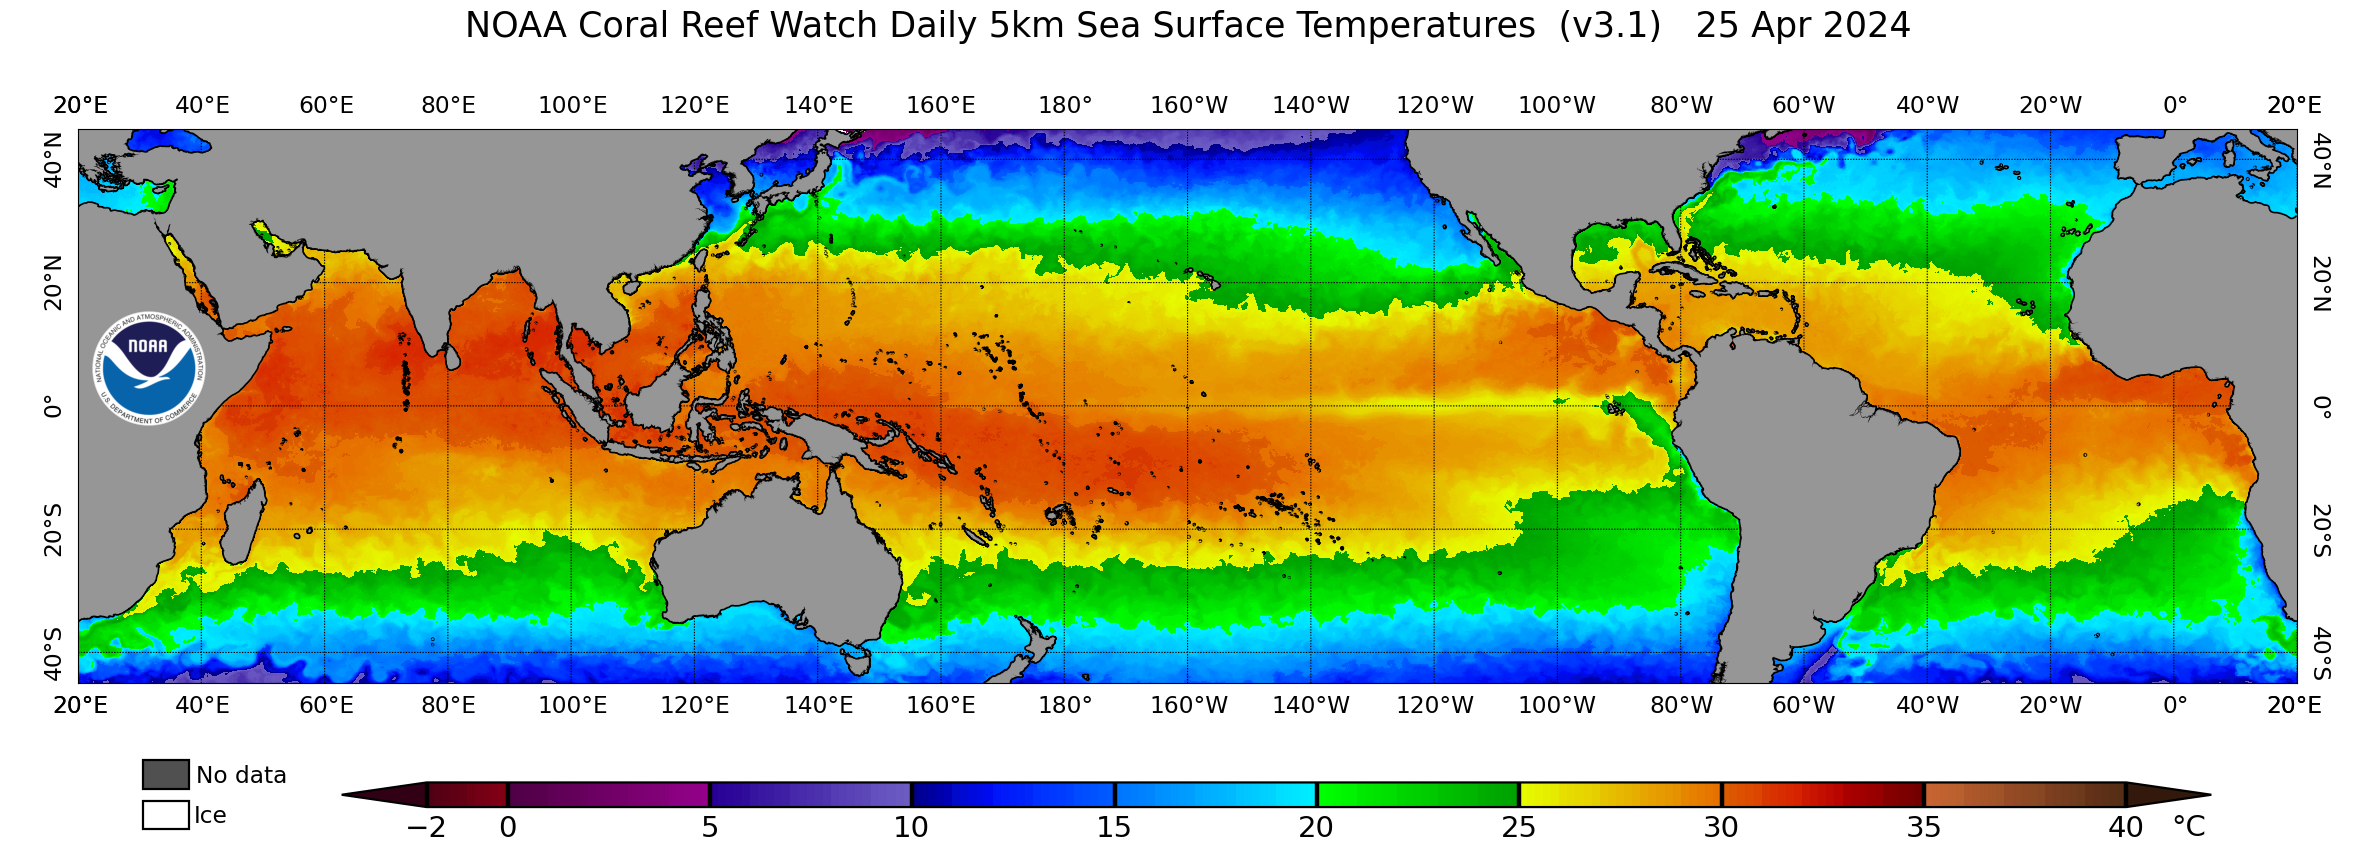
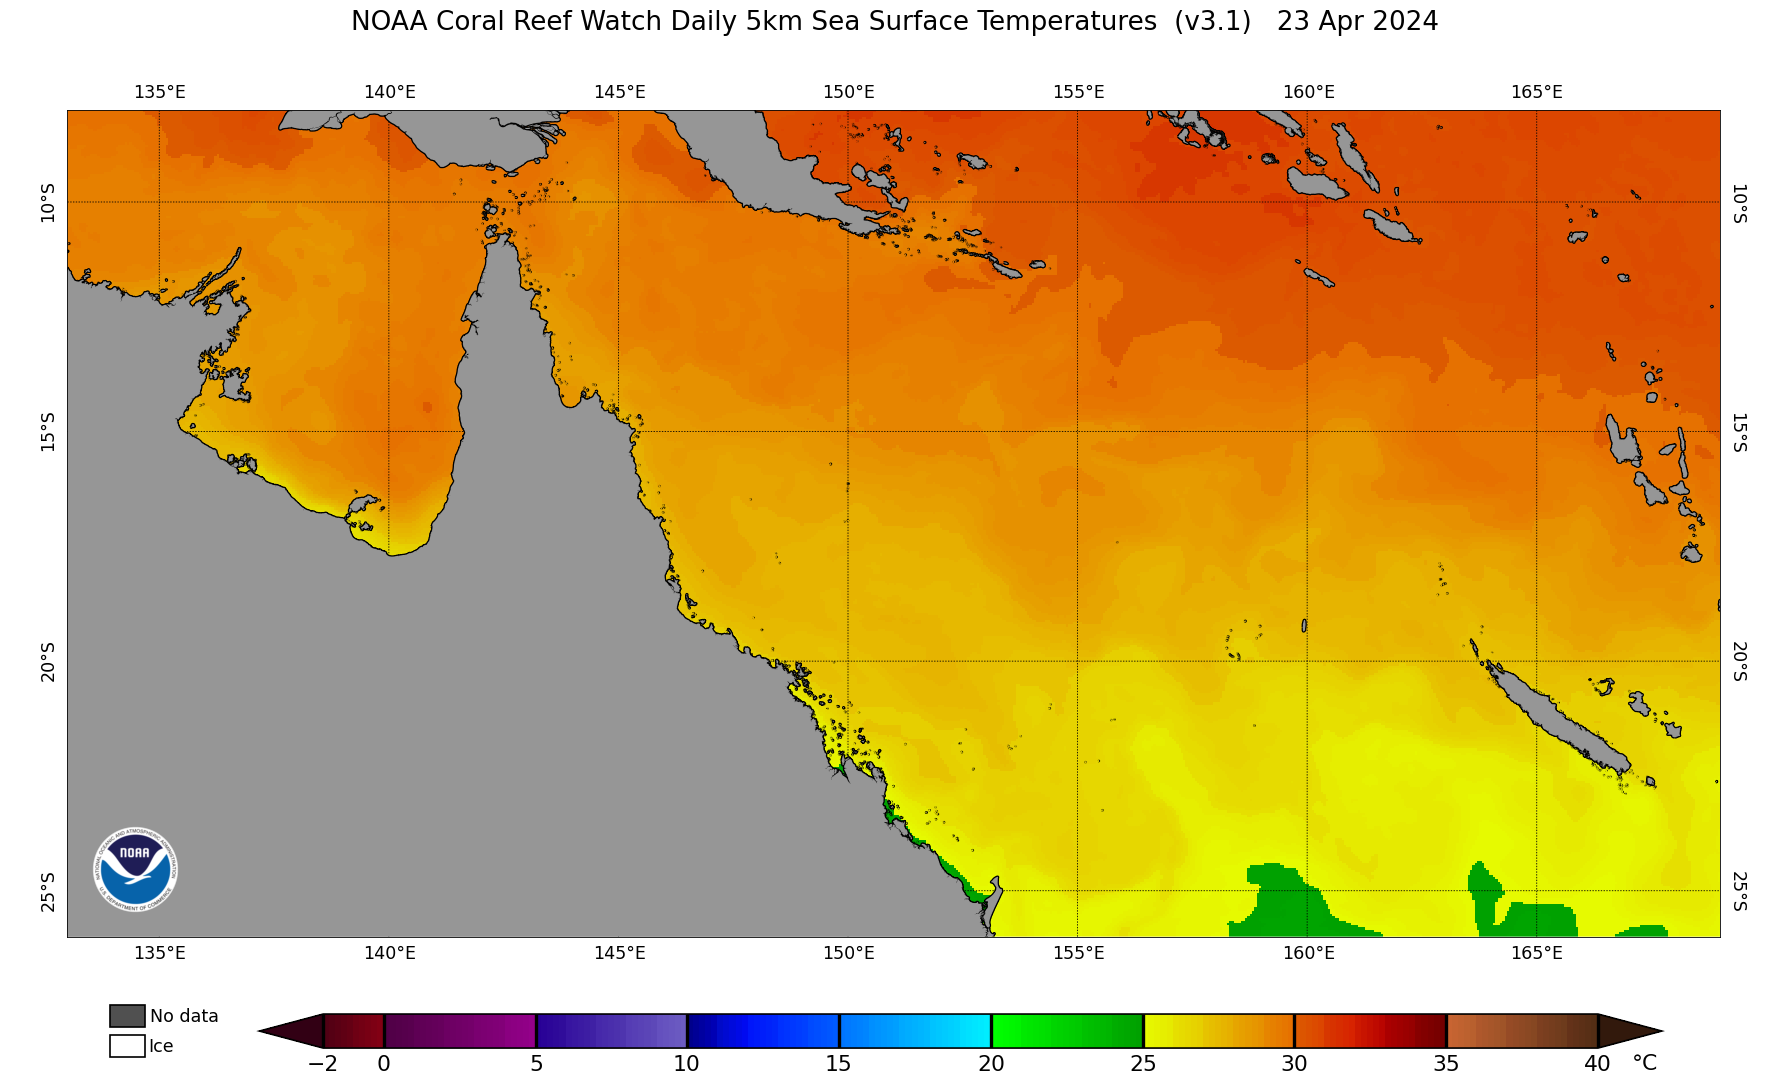
The NOAA Coral Reef Watch (CRW) daily global 5km Sea Surface Temperature (SST)
product, also known as CoralTemp, shows the
nighttime SST and provides an estimate of sea surface foundation
temperature. The GHRSST group provides
a set of definitions of satellite SST![]() .
.
The CoralTemp SST data product was developed from two, related reanalysis (reprocessed) SST products and a near real-time SST product. Spanning January 1, 1985 to the present, the CoralTemp SST is one of the best and most internally consistent daily global 5km SST products available.
Additional product details:
The CoralTemp SST product is currently Version 3.1. Originally called CoralTemp SST Version 1.0, it was renamed, with no change to the overall product, to CoralTemp SST Version 3.1 on March 21, 2019. It now conforms to the versioning of the CRW satellite coral bleaching heat stress product suite.
The source data for the CoralTemp SST product are from a combination of the:
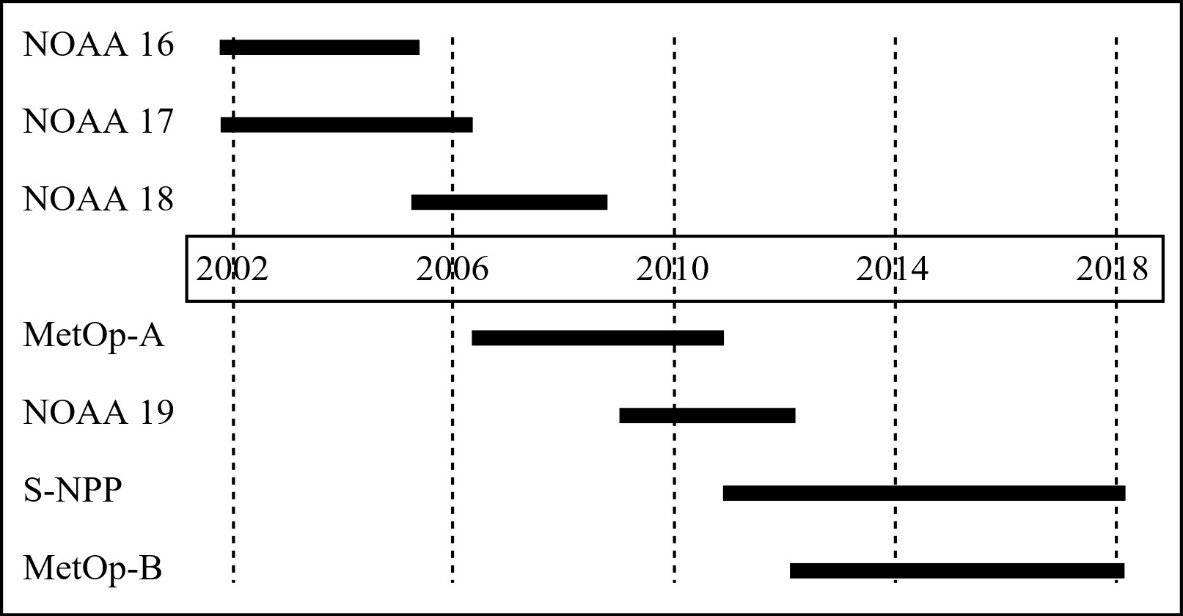
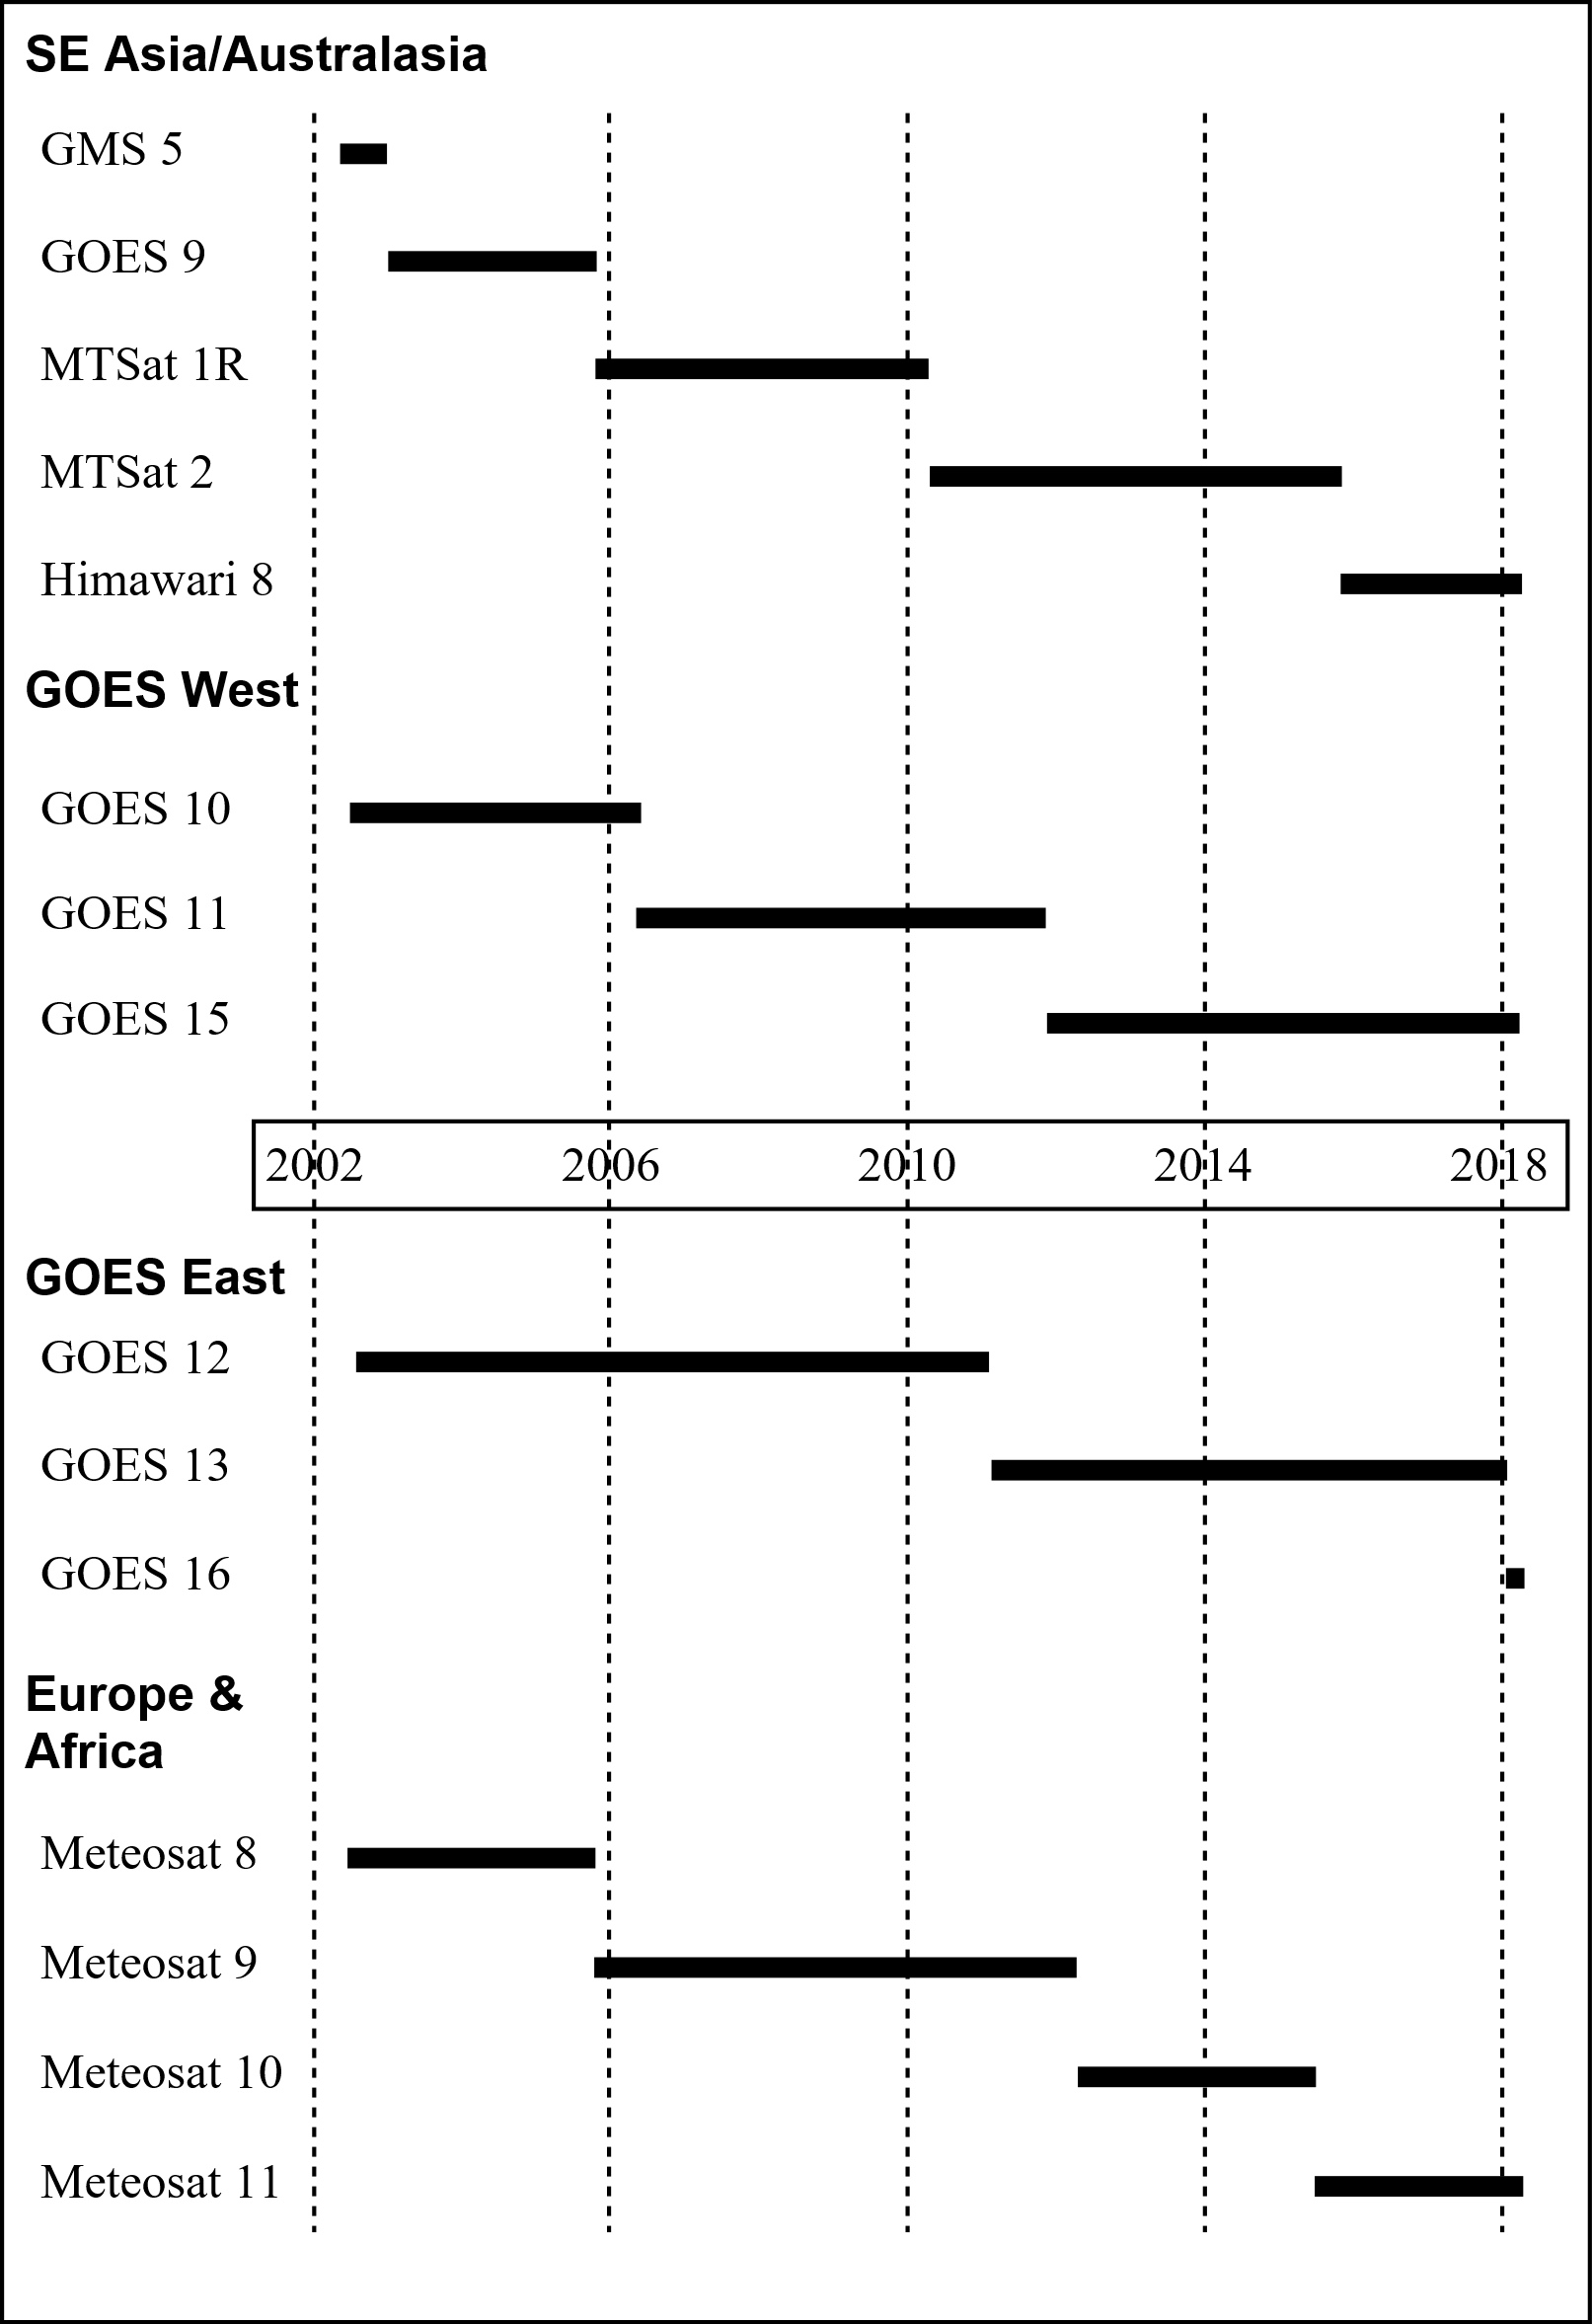
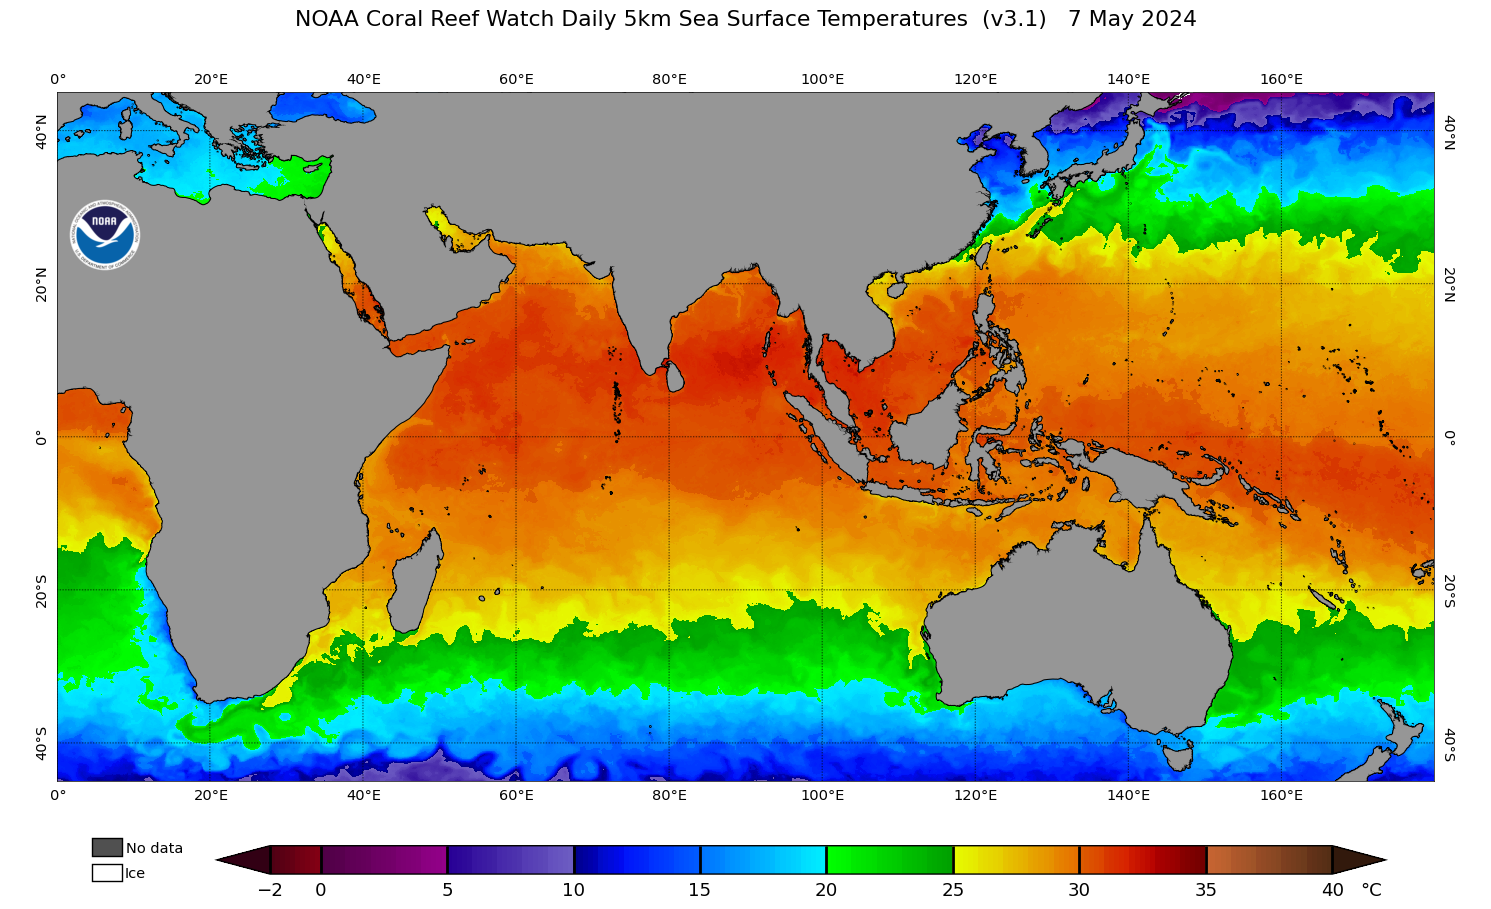
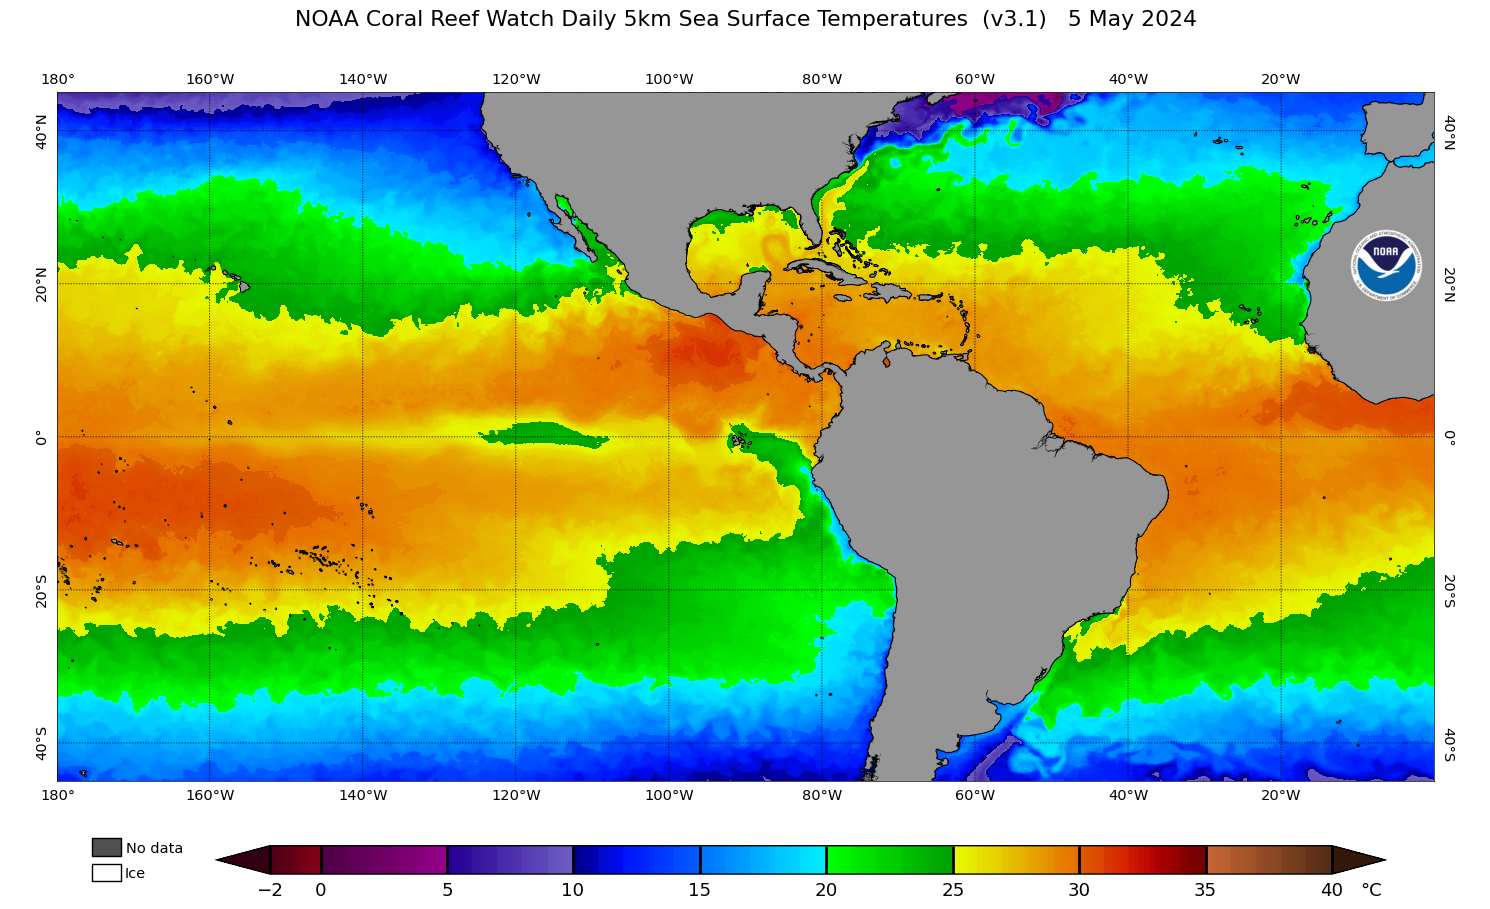
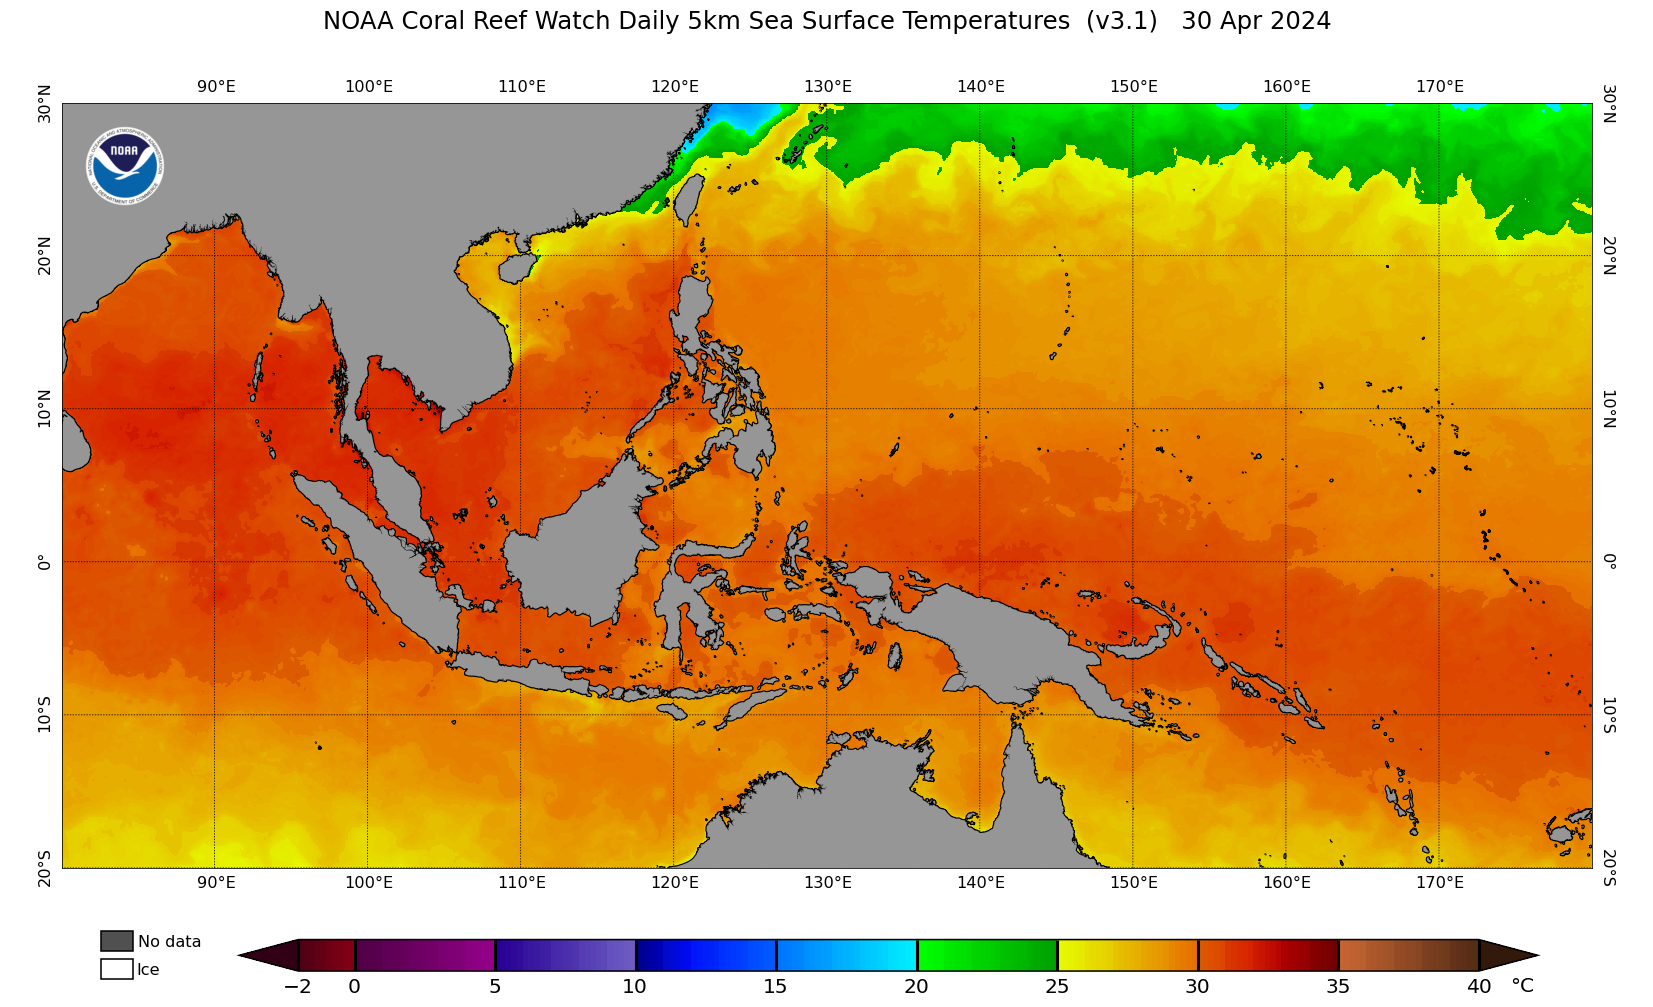
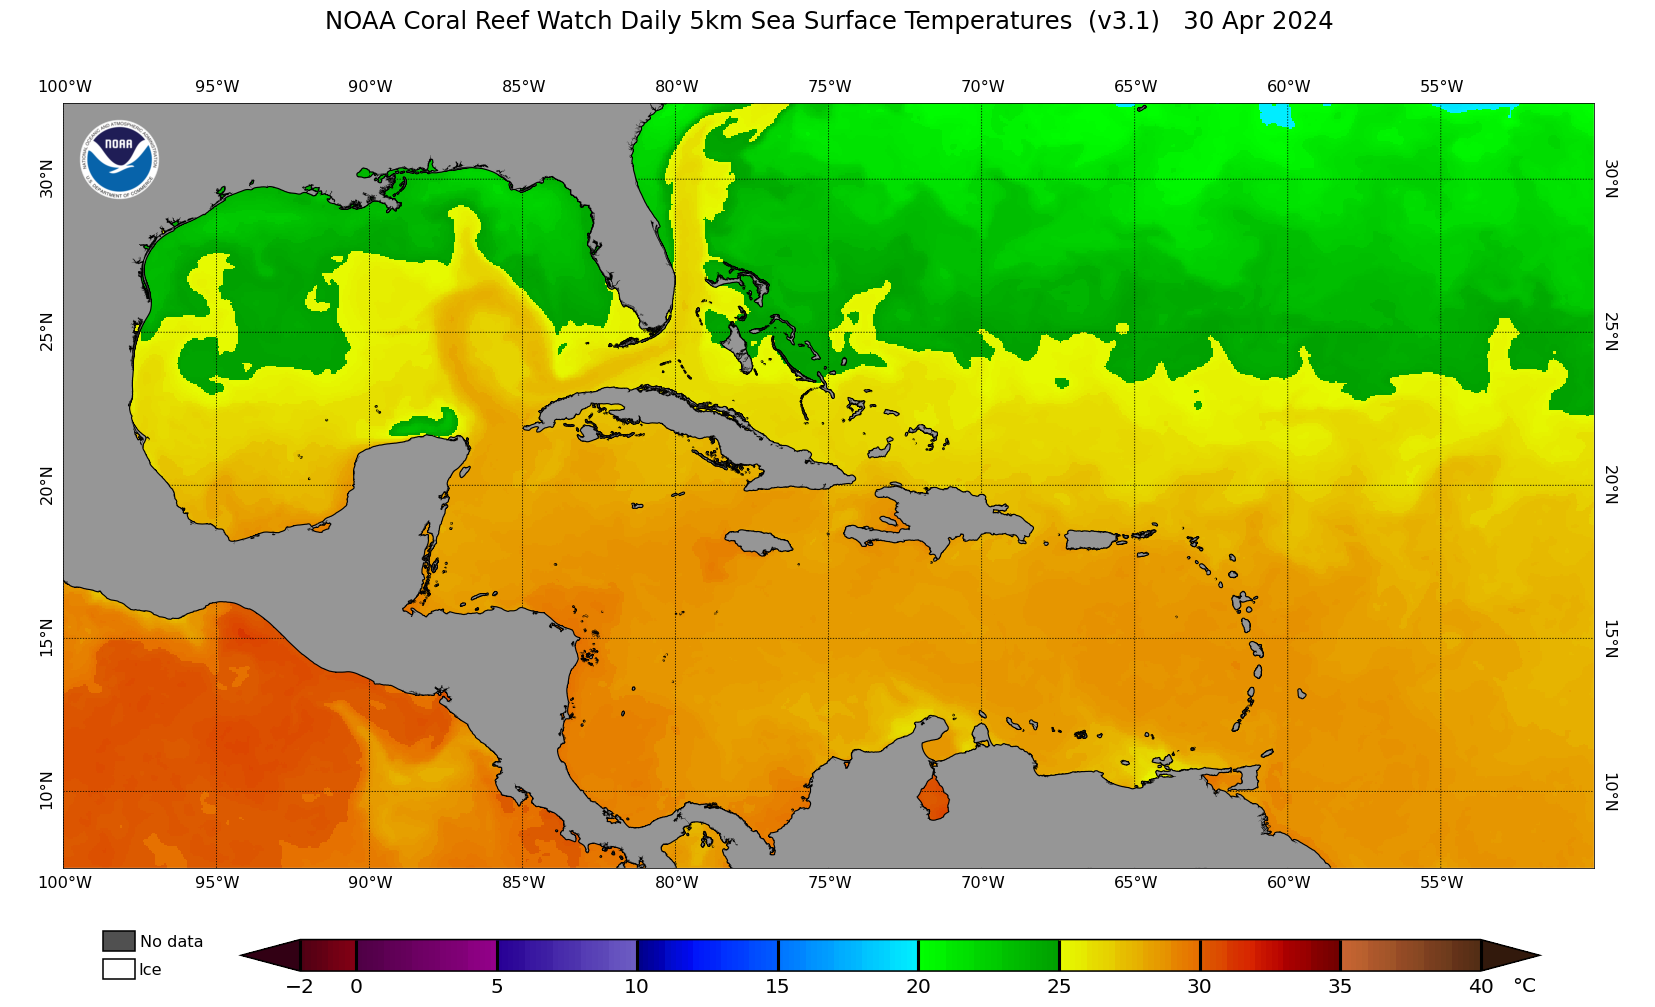
1) NOAA/National Environmental Satellite, Data, and Information Service's (NESDIS') operational near real-time daily global 5km Geostationary-Polar-orbiting (Geo-Polar) Blended Night-only SST Analysis (the source data for which are shown in Figures 1 and 2);
2) NOAA/NESDIS' 2002-2016 reprocessed daily global 5km Geo-Polar Blended Night-only SST Analysis (the source data for which are shown in Figures 1 and 2); and the
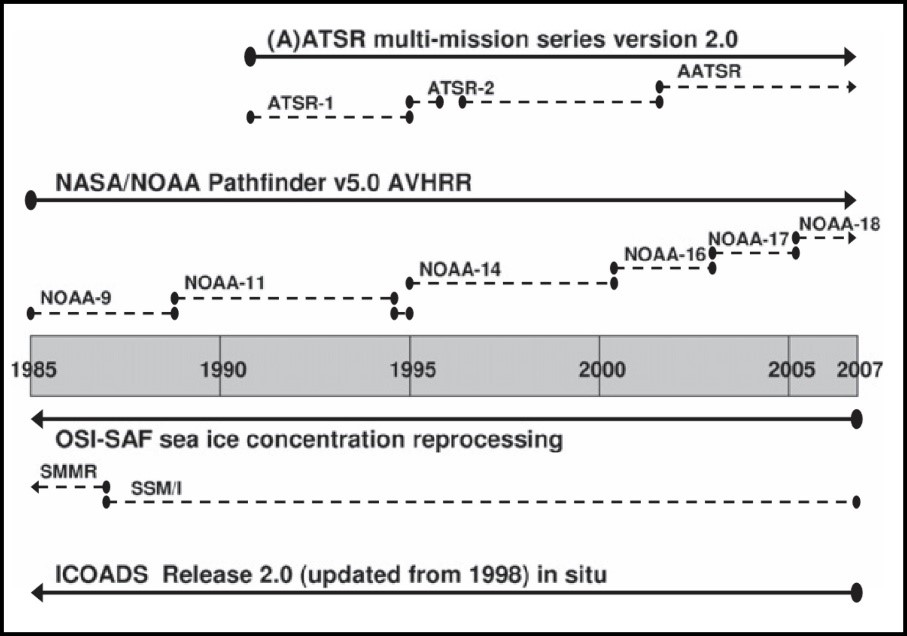
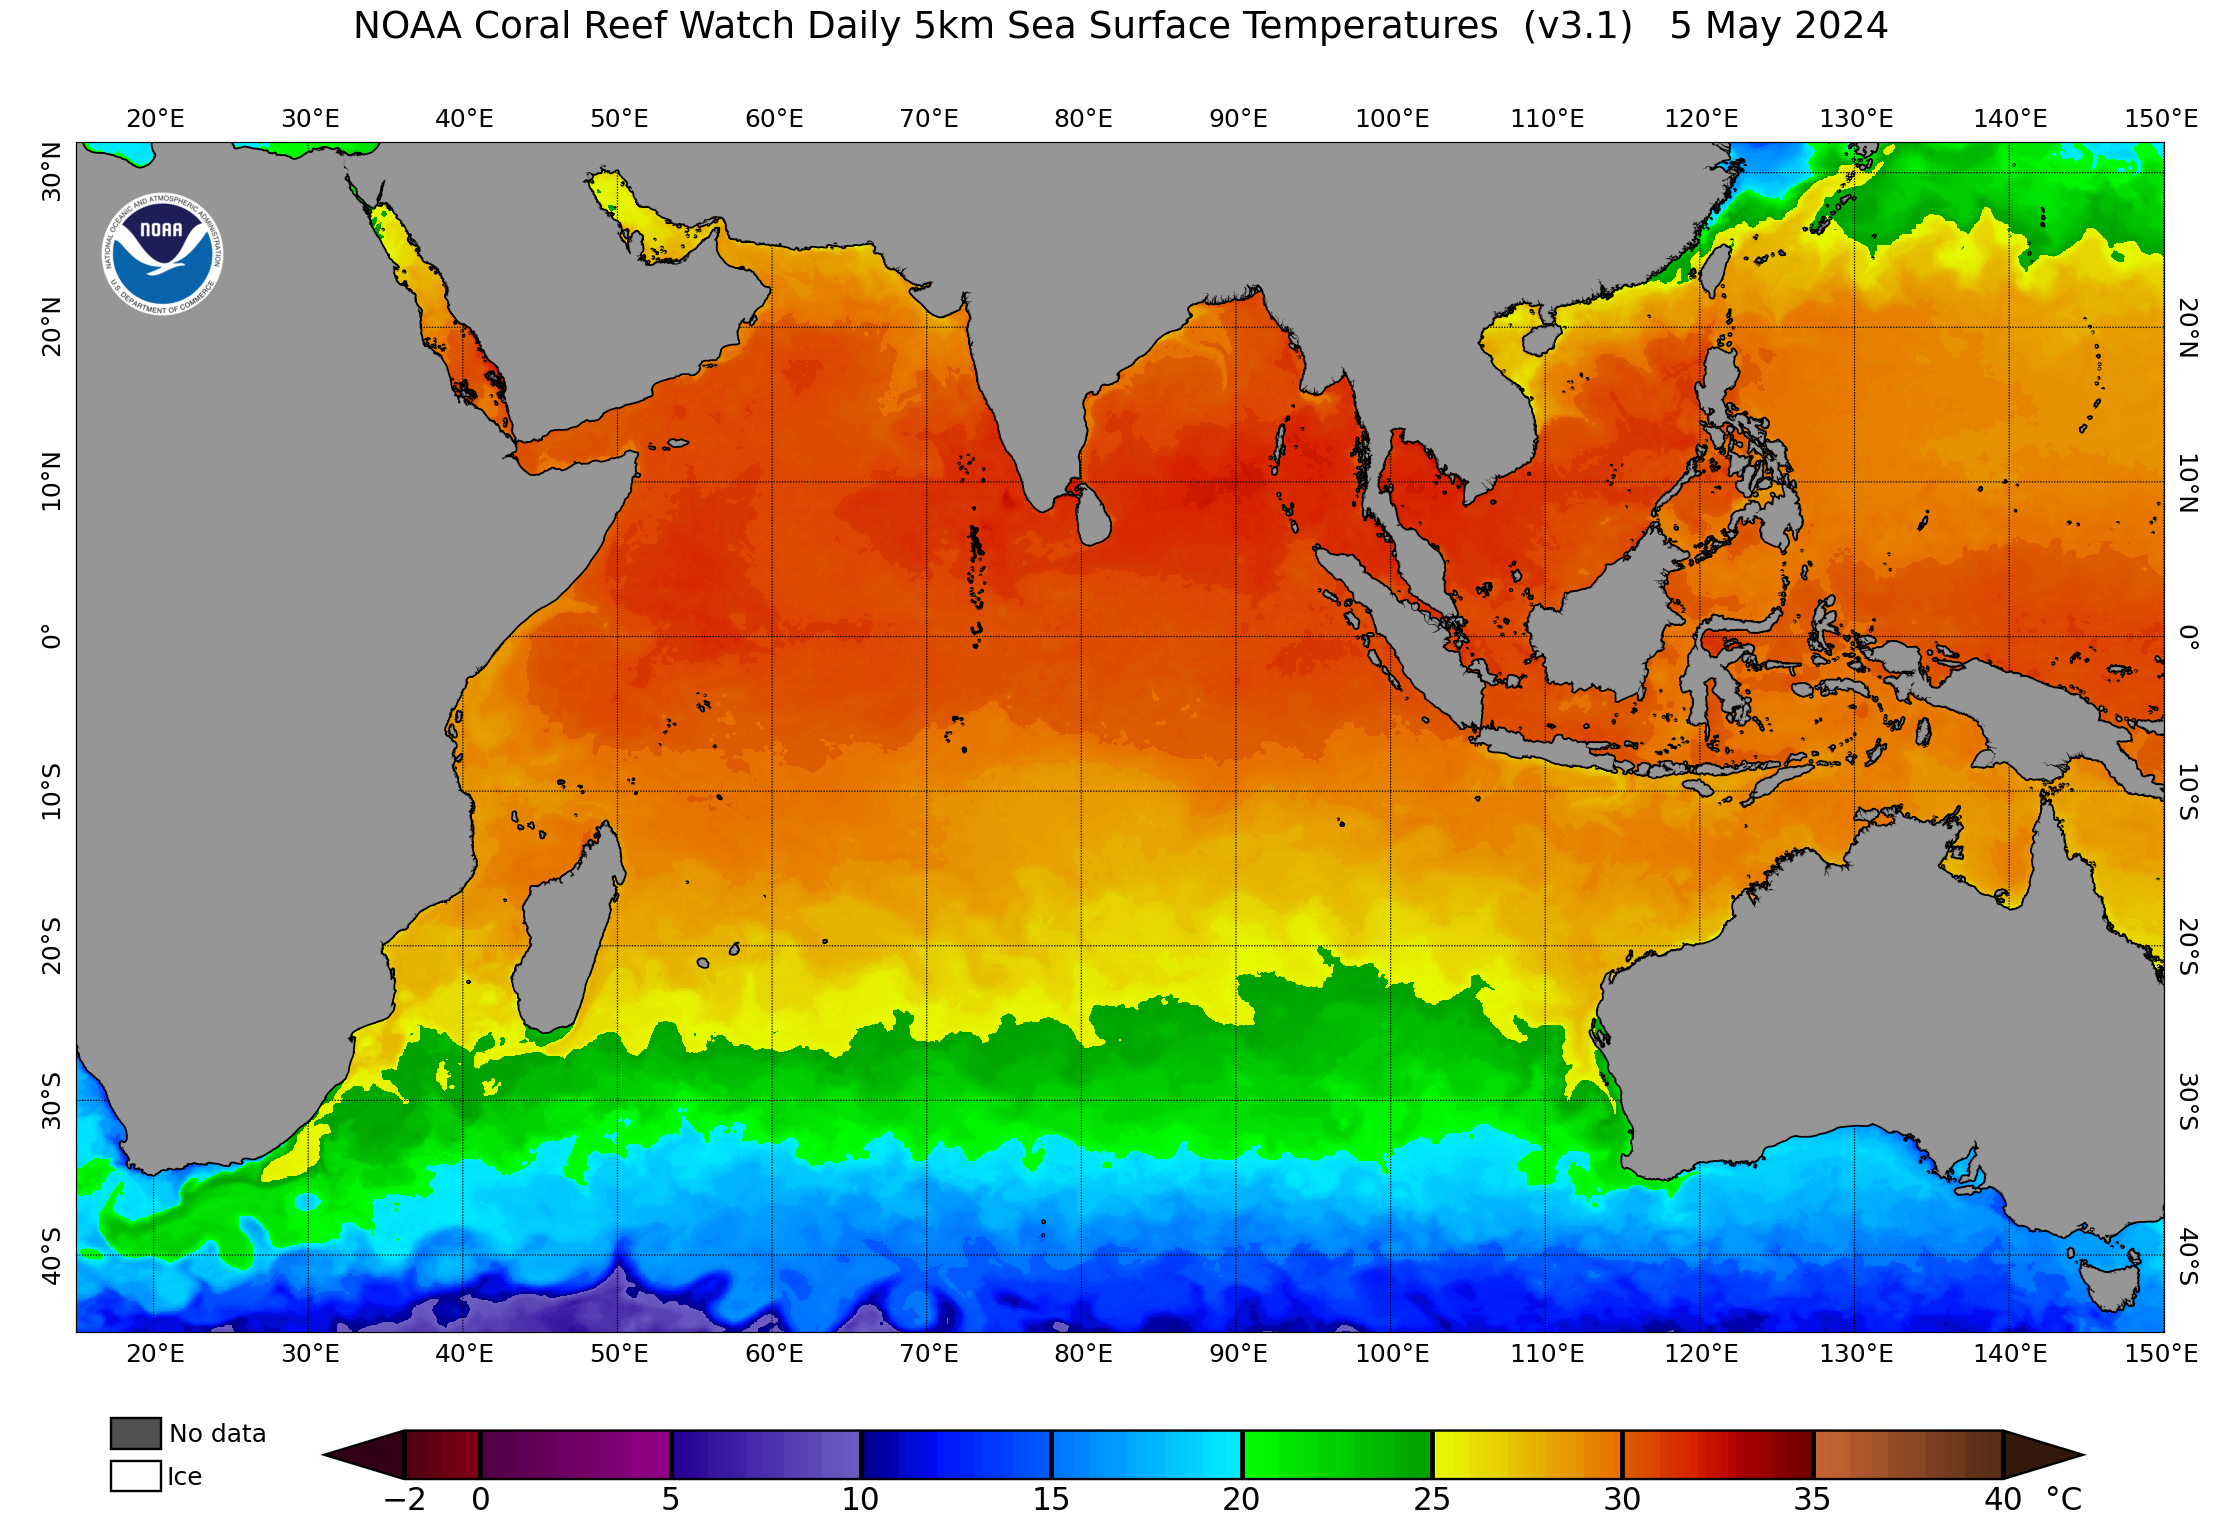
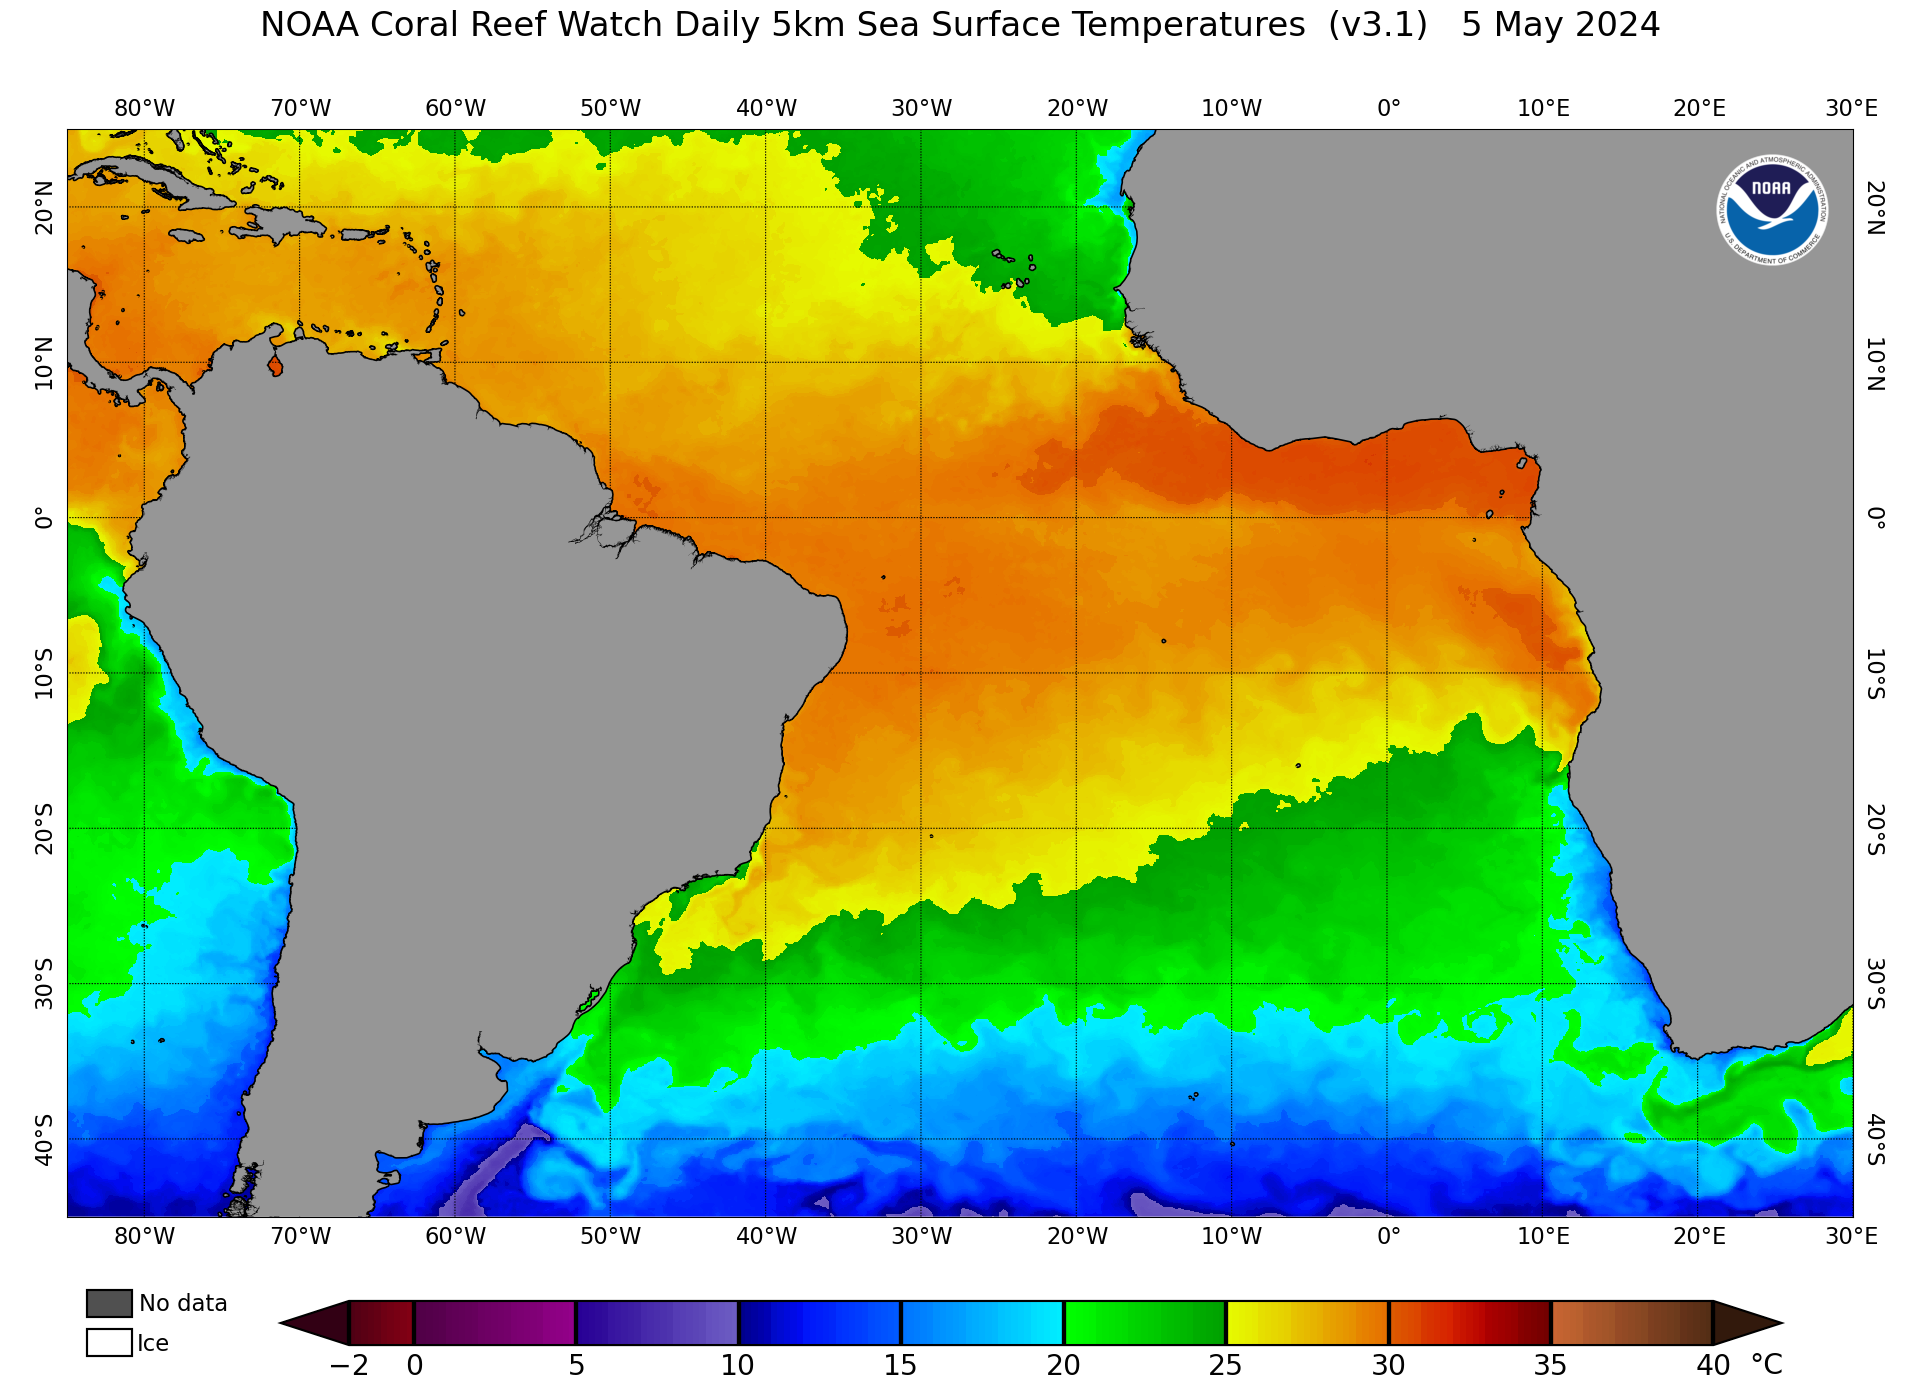
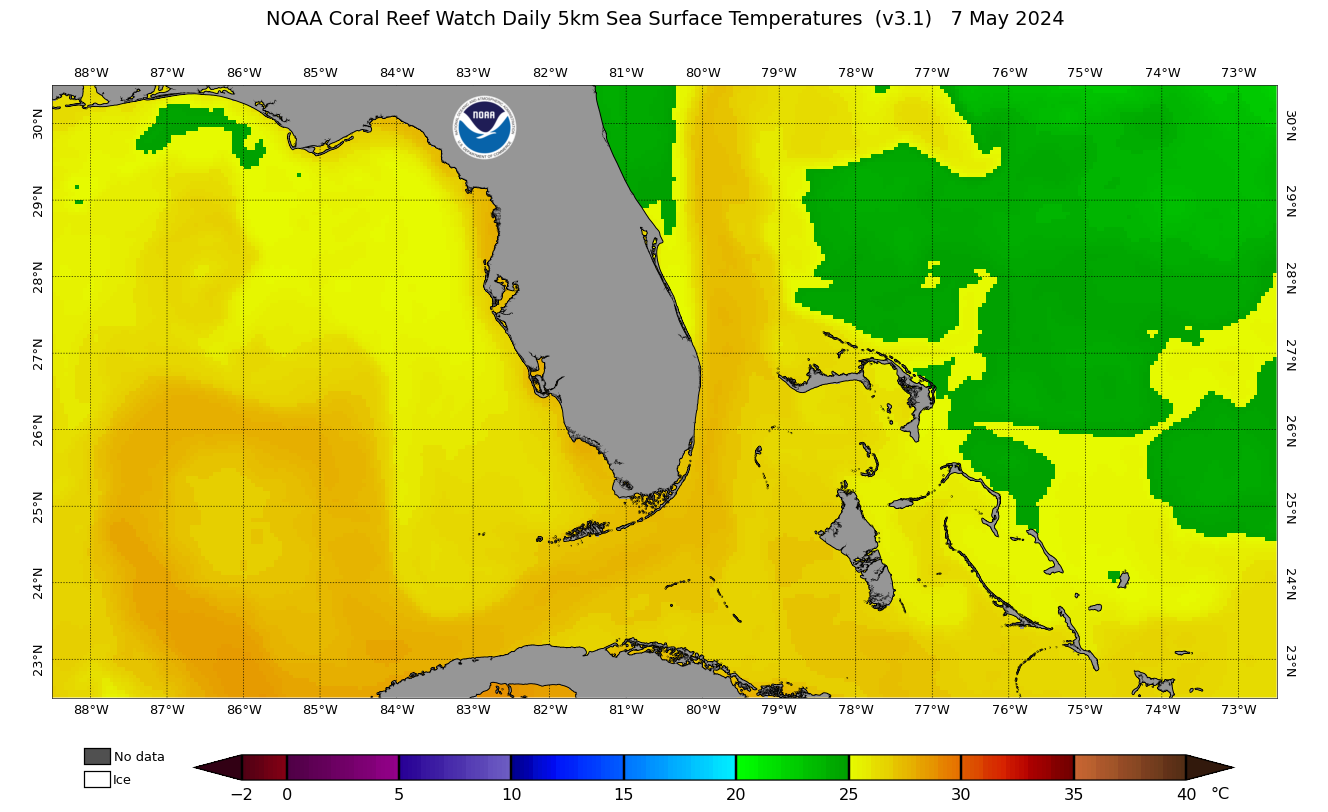
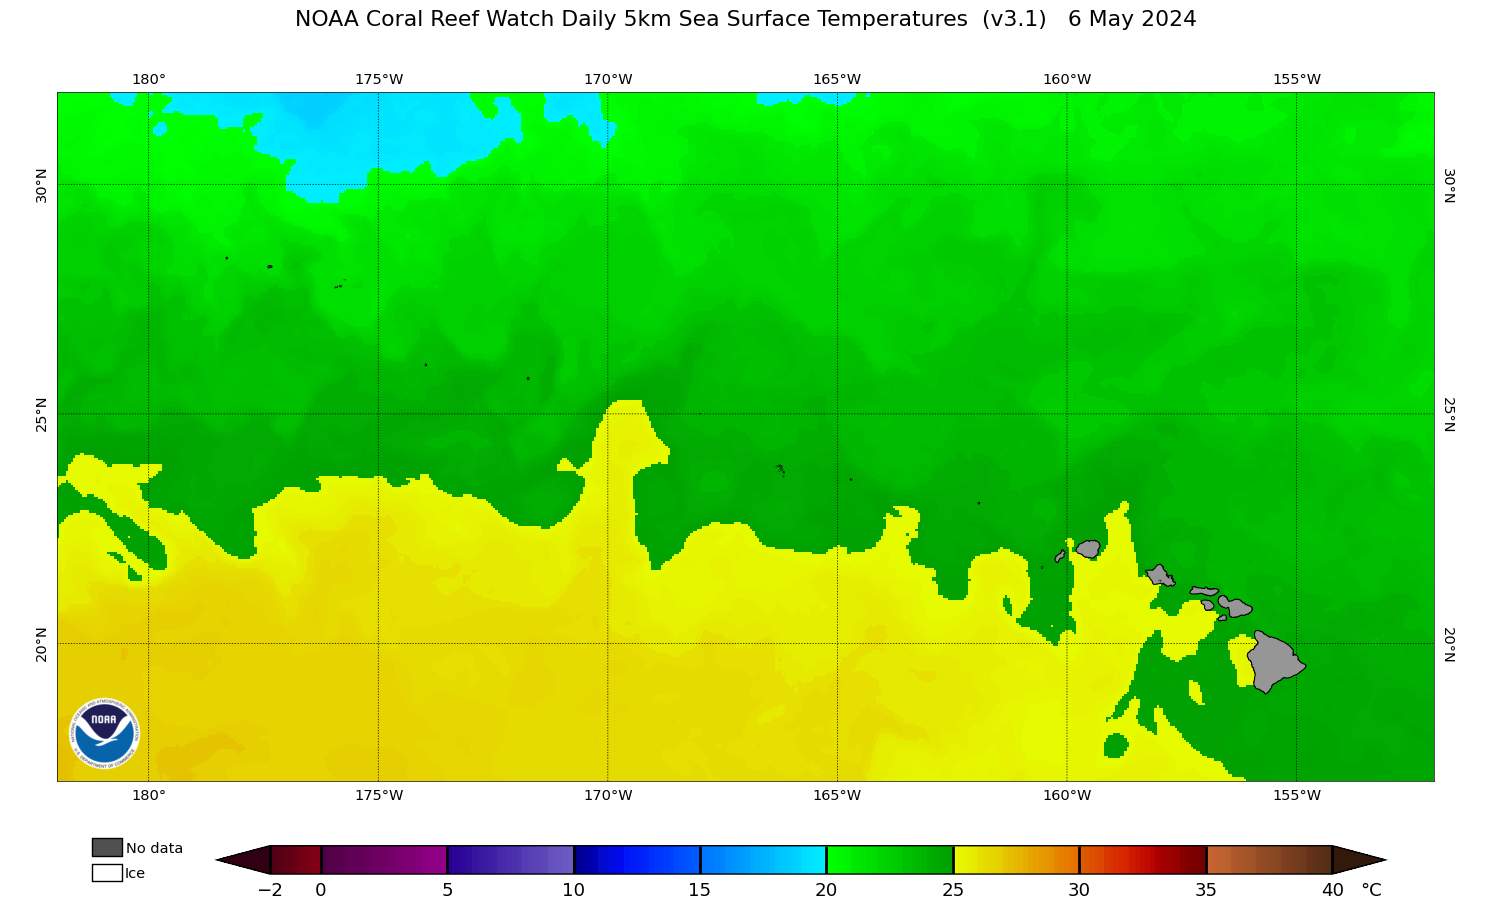
3) 1985-2002 daily global 5km night-only foundation SST reanalysis produced by the United Kingdom Met Office, on the Operational SST and Sea Ice Analysis (OSTIA) system (the source data for which are displayed in Figure 3).
NOAA's daily global 5km Geostationary-Polar Blended Night-only SST Analyses (both the near real-time and reprocessed products) utilize sensors from multiple geostationary and polar-orbiting satellites to derive a global SST data field at a resolution of 5km (0.05 degree). The few remaining gaps are filled using optimal interpolation through space and time (Maturi et al. 2017). Bias corrections originally used the NOAA National Centers for Environmental Prediction (NCEP) real-time global SST. However, in 2016, the NOAA 5km Geo-Polar Blended SST product (which CRW's 5km satellite monitoring for coral reefs is based on) switched to using OSTIA as the bias correction.
In addition, NOAA reprocessed the 5km Geo-Polar Blended SST back to 2002, thereby providing good overlap with the OSTIA reanalysis dataset, negating the need to use the near real-time OSTIA product to bridge the gap between NOAA's near real-time 5km Geo-Polar Blended SST product and the OSTIA reanalysis. The OSTIA reanalysis and NOAA's reprocessed 5km Geo-Polar Blended SST dataset were linearly merged over a period of 29 days, from November 1-29, 2002. Since this is a full tidal cycle, by gradually merging the two datasets over this period, any local differences between the two datasets were minimized. The merge point between NOAA's reprocessed and near real-time 5km Geo-Polar Blended SST datasets was performed over a 29 day period as well, from October 1-29, 2016.
The CoralTemp SST data are presented in degrees Celsius, with a land mask of -32,768 embedded within the data. An additional array is included in the data files that provides sea ice concentration values, so those users who wish to process SST in the ice prone high latitudes have the ability to choose an appropriate sea ice mask for their purpose(s). The NOAA 5km Geo-Polar Blended SST products derive their sea ice concentrations from the NCEP sea ice analysis (Maturi et al. 2017), whereas the OSTIA products derive their sea ice concentrations from the European Organisation for the Exploitation of Meteorological Satellites (EUMETSAT) Ocean and Sea Ice Satellite Application Facility (OSI SAF) sea ice concentration dataset. The OSTIA reanalysis and NOAA's reprocessed 5km Geo-Polar Blended SST dataset do not differ for the period of overlap.
These efforts provide consistency between the NOAA 5km Geo-Polar Blended SST Analyses (both the near real-time and reprocessed products), the OSTIA reanalysis, and CRW's daily global 5km satellite coral bleaching heat stress products. This allowed for the creation of the CoralTemp SST data product, one of the best and most internally consistent daily global 5km SST products available.
Note that the daily CoralTemp SST data of 1985-2012 was used to derive a special set of climatologies for the Version 3.1 daily global 5km satellite coral bleaching heat stress monitoring products. The resulting climatologies were created after being re-centered to the time-center of the operational 50km climatology (1985-1990 plus 1993). This was done to maintain consistency with the former Version 2 5km climatology (which was based on NOAA's 4km Advanced Very High Resolution Radiometer Pathfinder Version 5.2 SST dataset) and CRW's heritage 50km products. Click here to learn more about the climatology.
References
Maturi, E.; Harris, A.; Mittaz, J.; Sapper, J.; Wick, G.; Zhu, X.;
Dash, P.; Koner, P.
A New High-Resolution Sea Surface Temperature Blended Analysis
![]() .
BAMS, 2017, 98(5), 1015 – 1026.
DOI: https://doi.org/10.1175/BAMS-D-15-00002.1.
.
BAMS, 2017, 98(5), 1015 – 1026.
DOI: https://doi.org/10.1175/BAMS-D-15-00002.1.
Roberts-Jones, J.; Fiedler, E.K.; Martin, M.J.
Daily, Global, High-Resolution SST and Sea Ice Reanalysis for
1985-2007 Using the OSTIA System![]() .
J. of Climate, 2012, 25(18), 6215 – 6232.
DOI: https://doi.org/10.1175/JCLI-D-11-00648.1
.
J. of Climate, 2012, 25(18), 6215 – 6232.
DOI: https://doi.org/10.1175/JCLI-D-11-00648.1