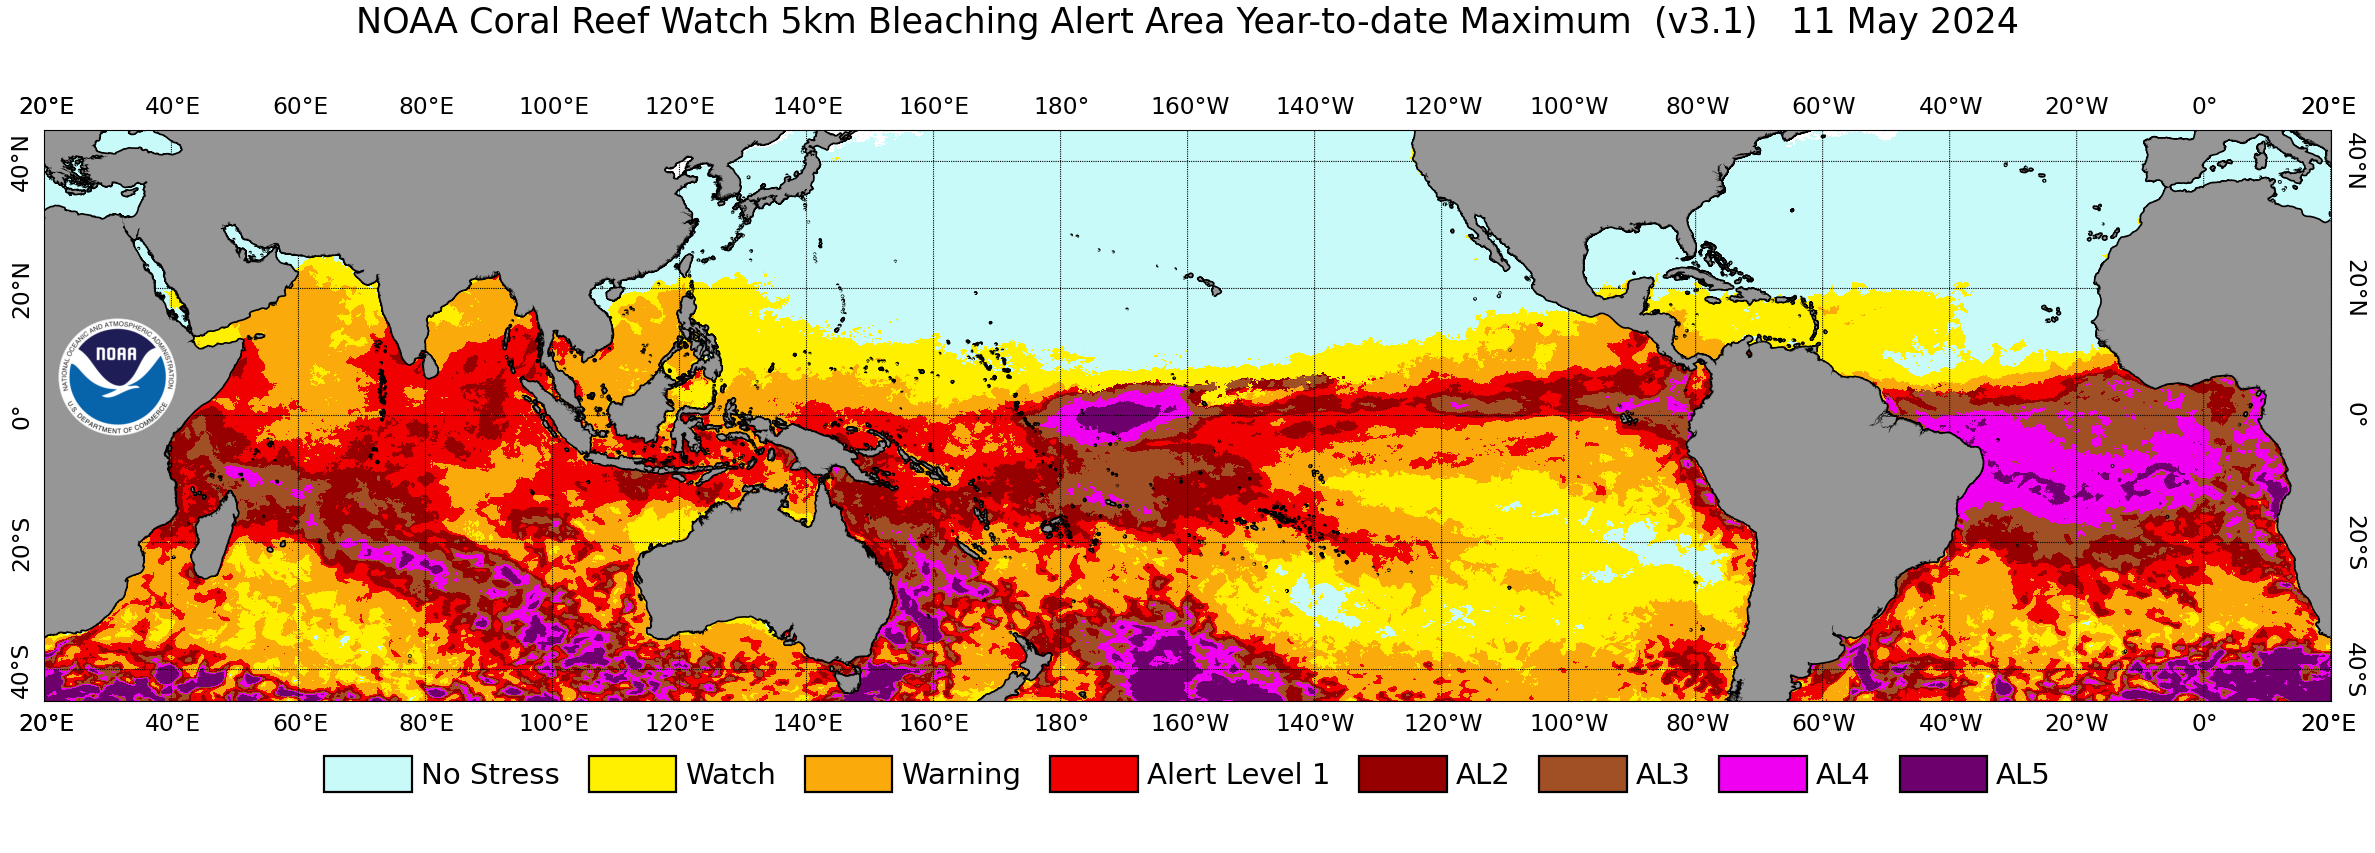
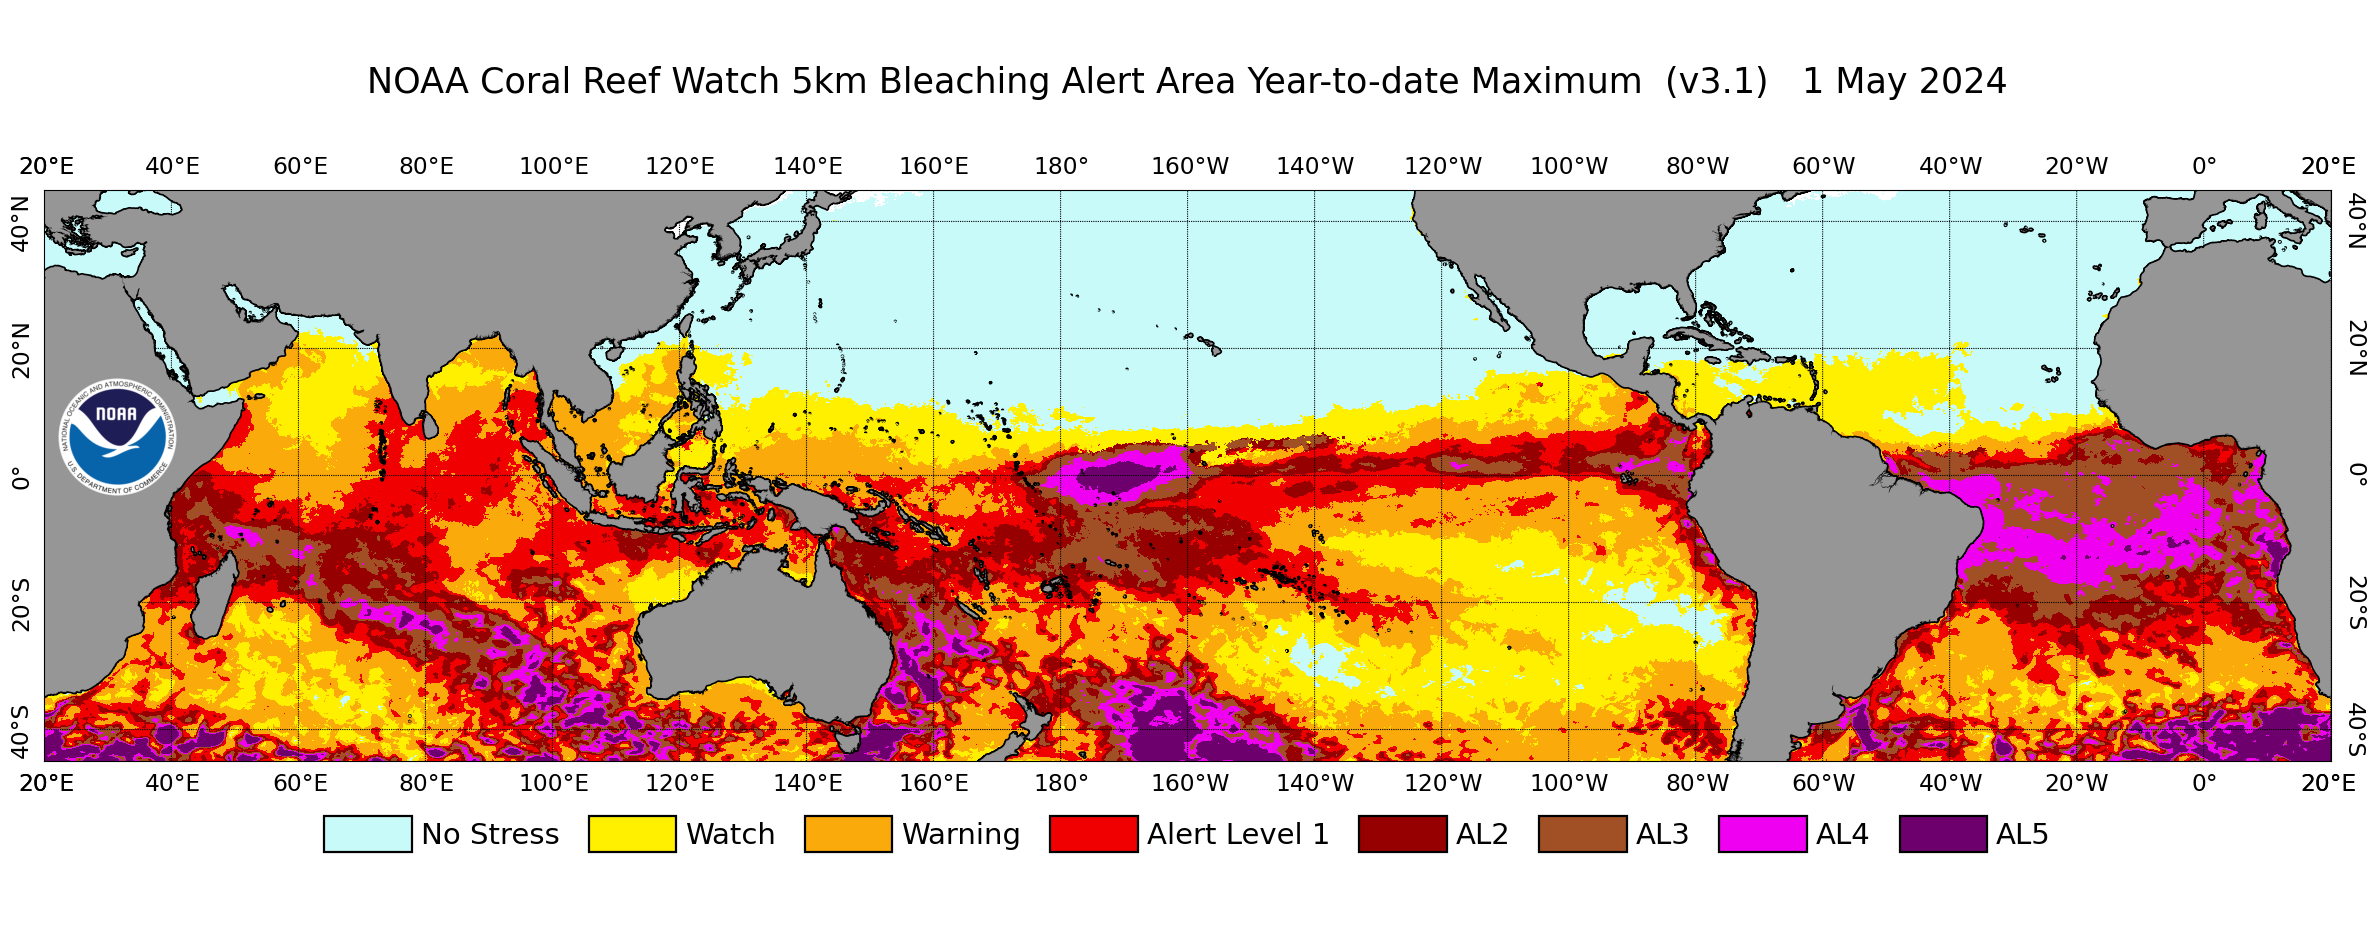
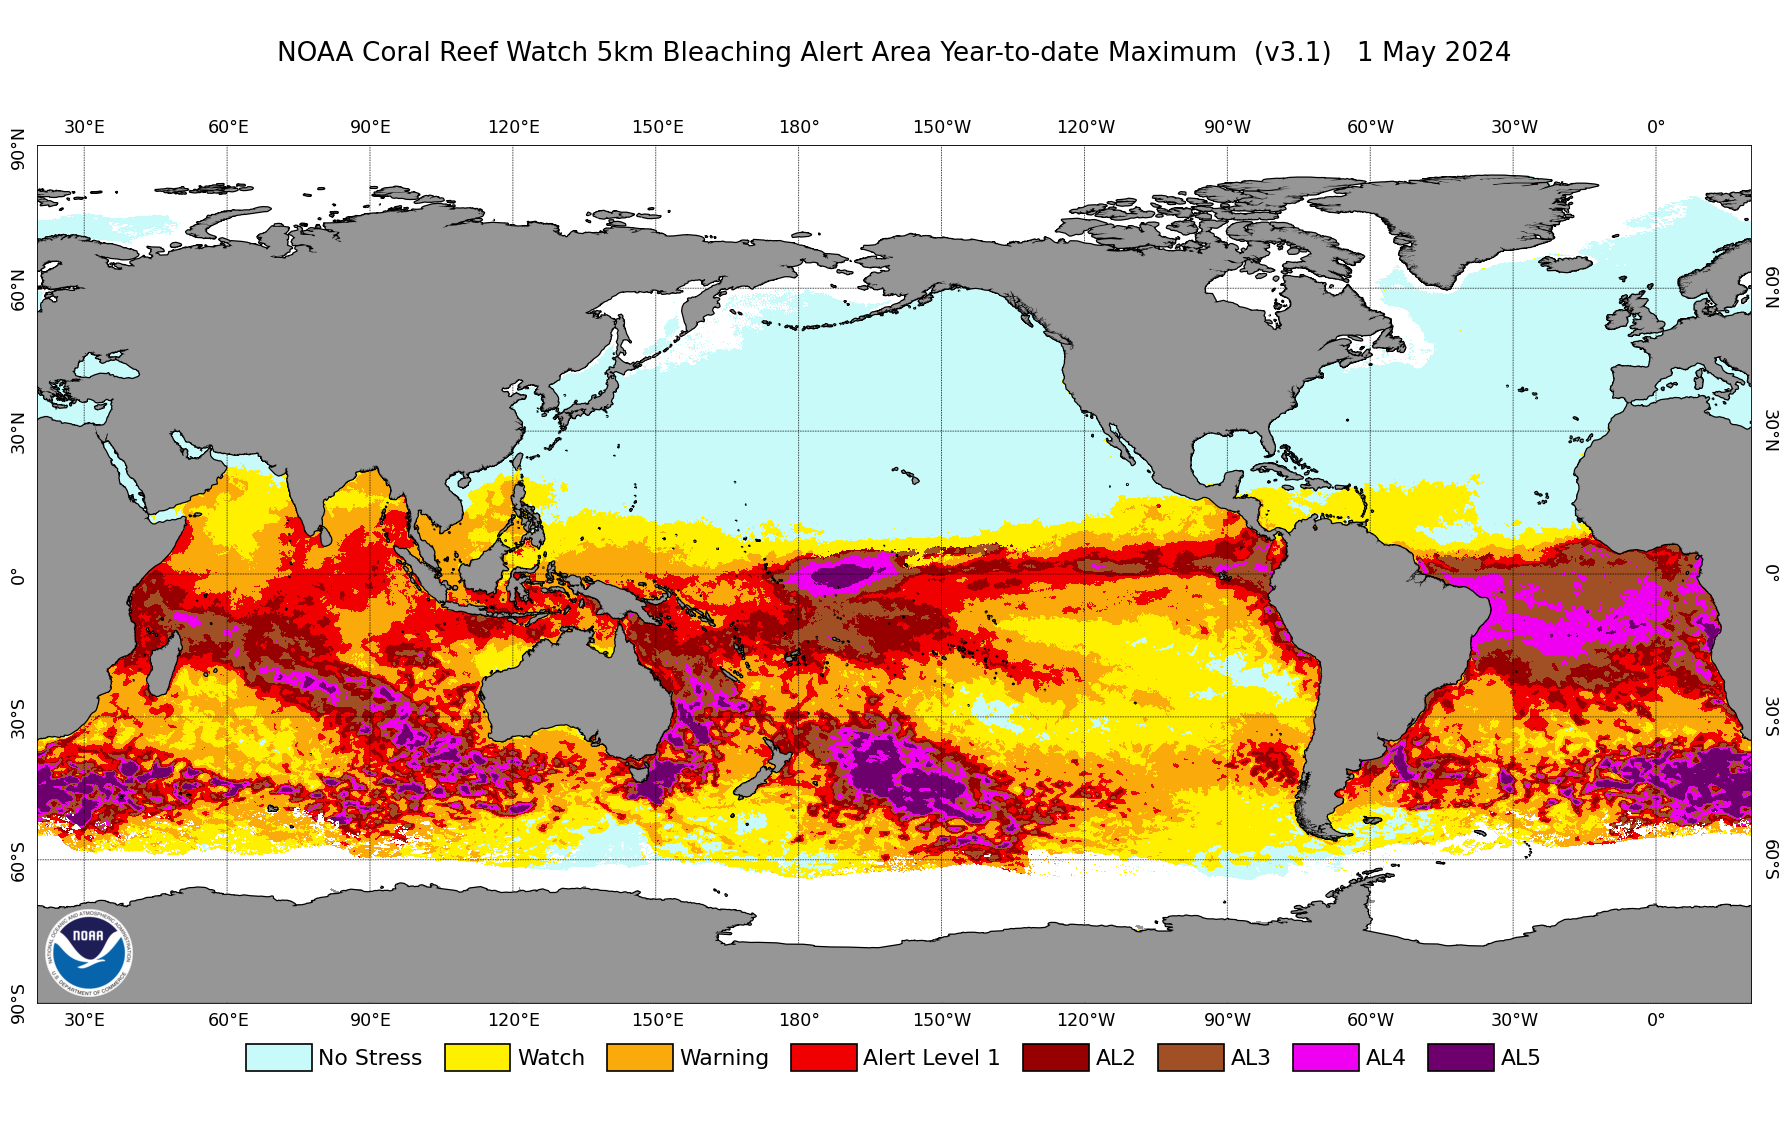
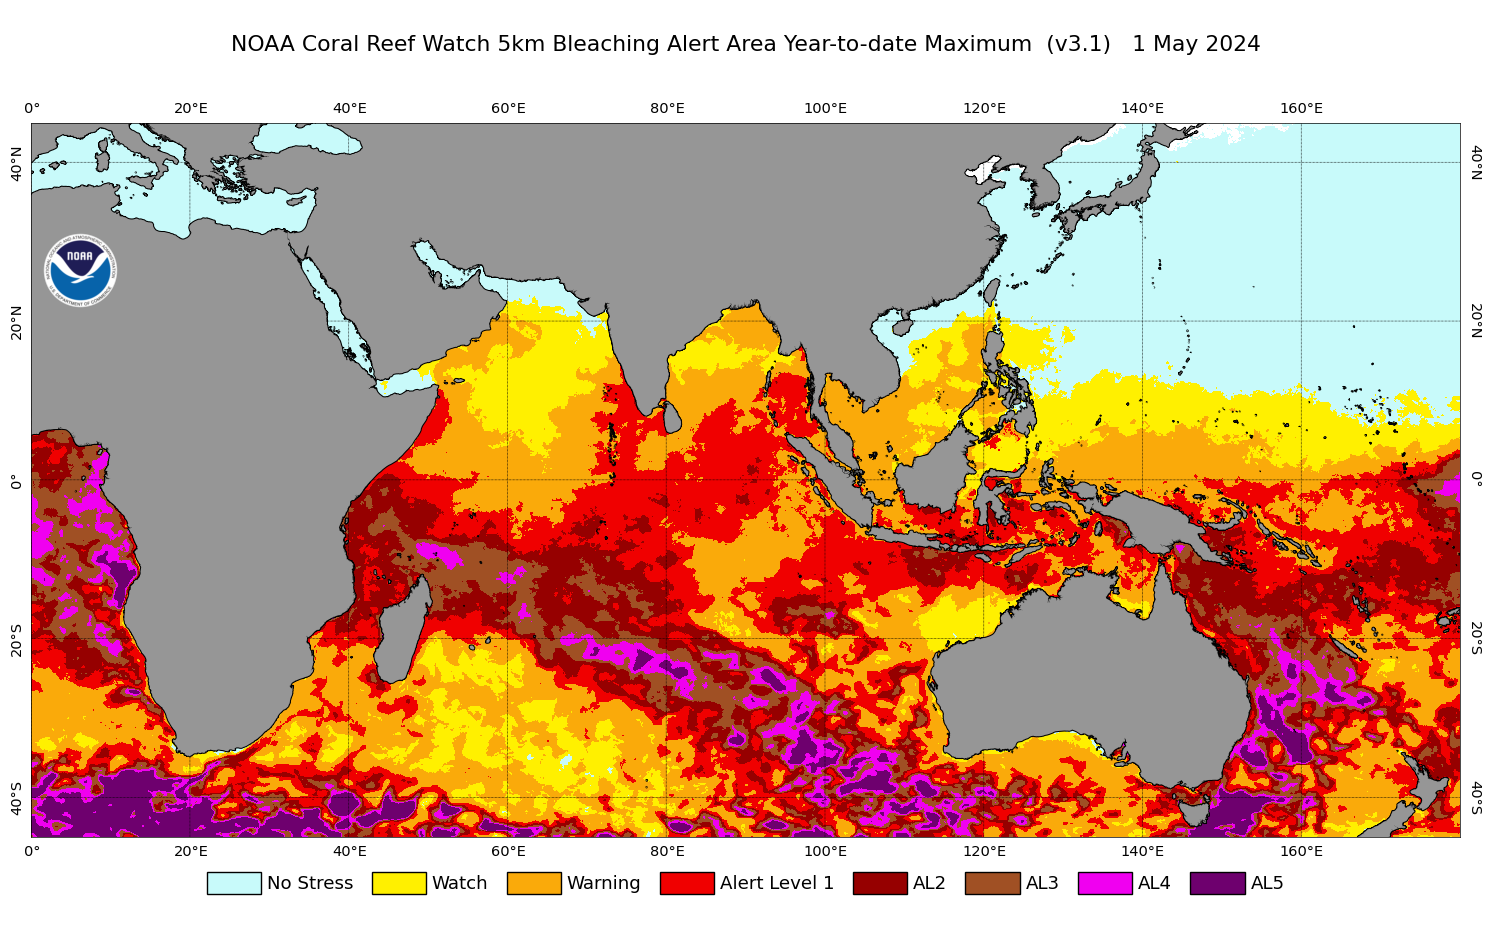
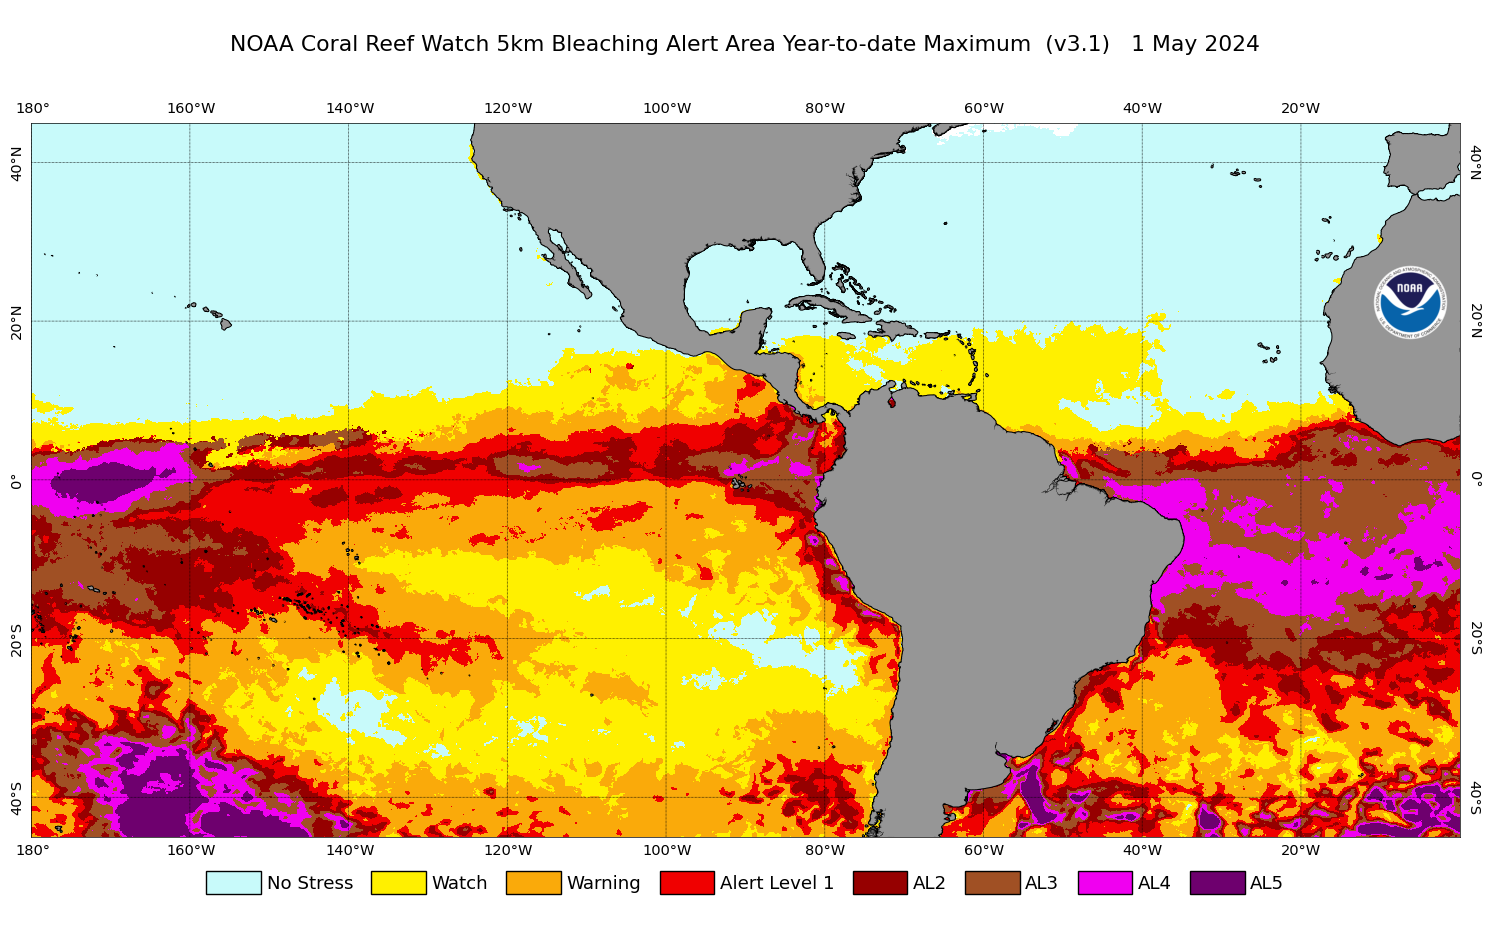
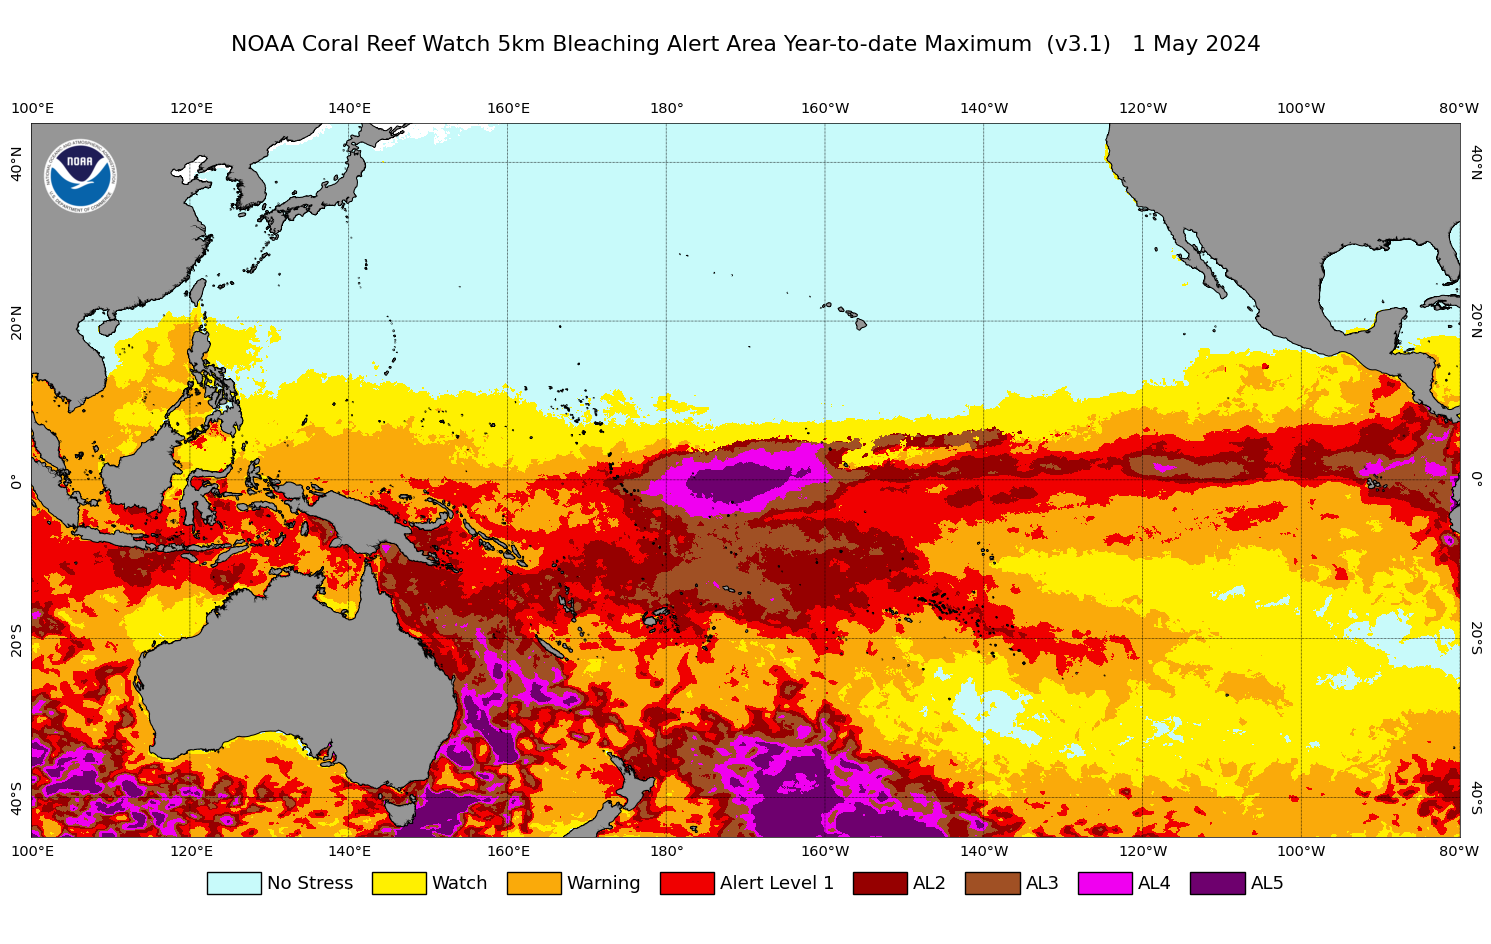
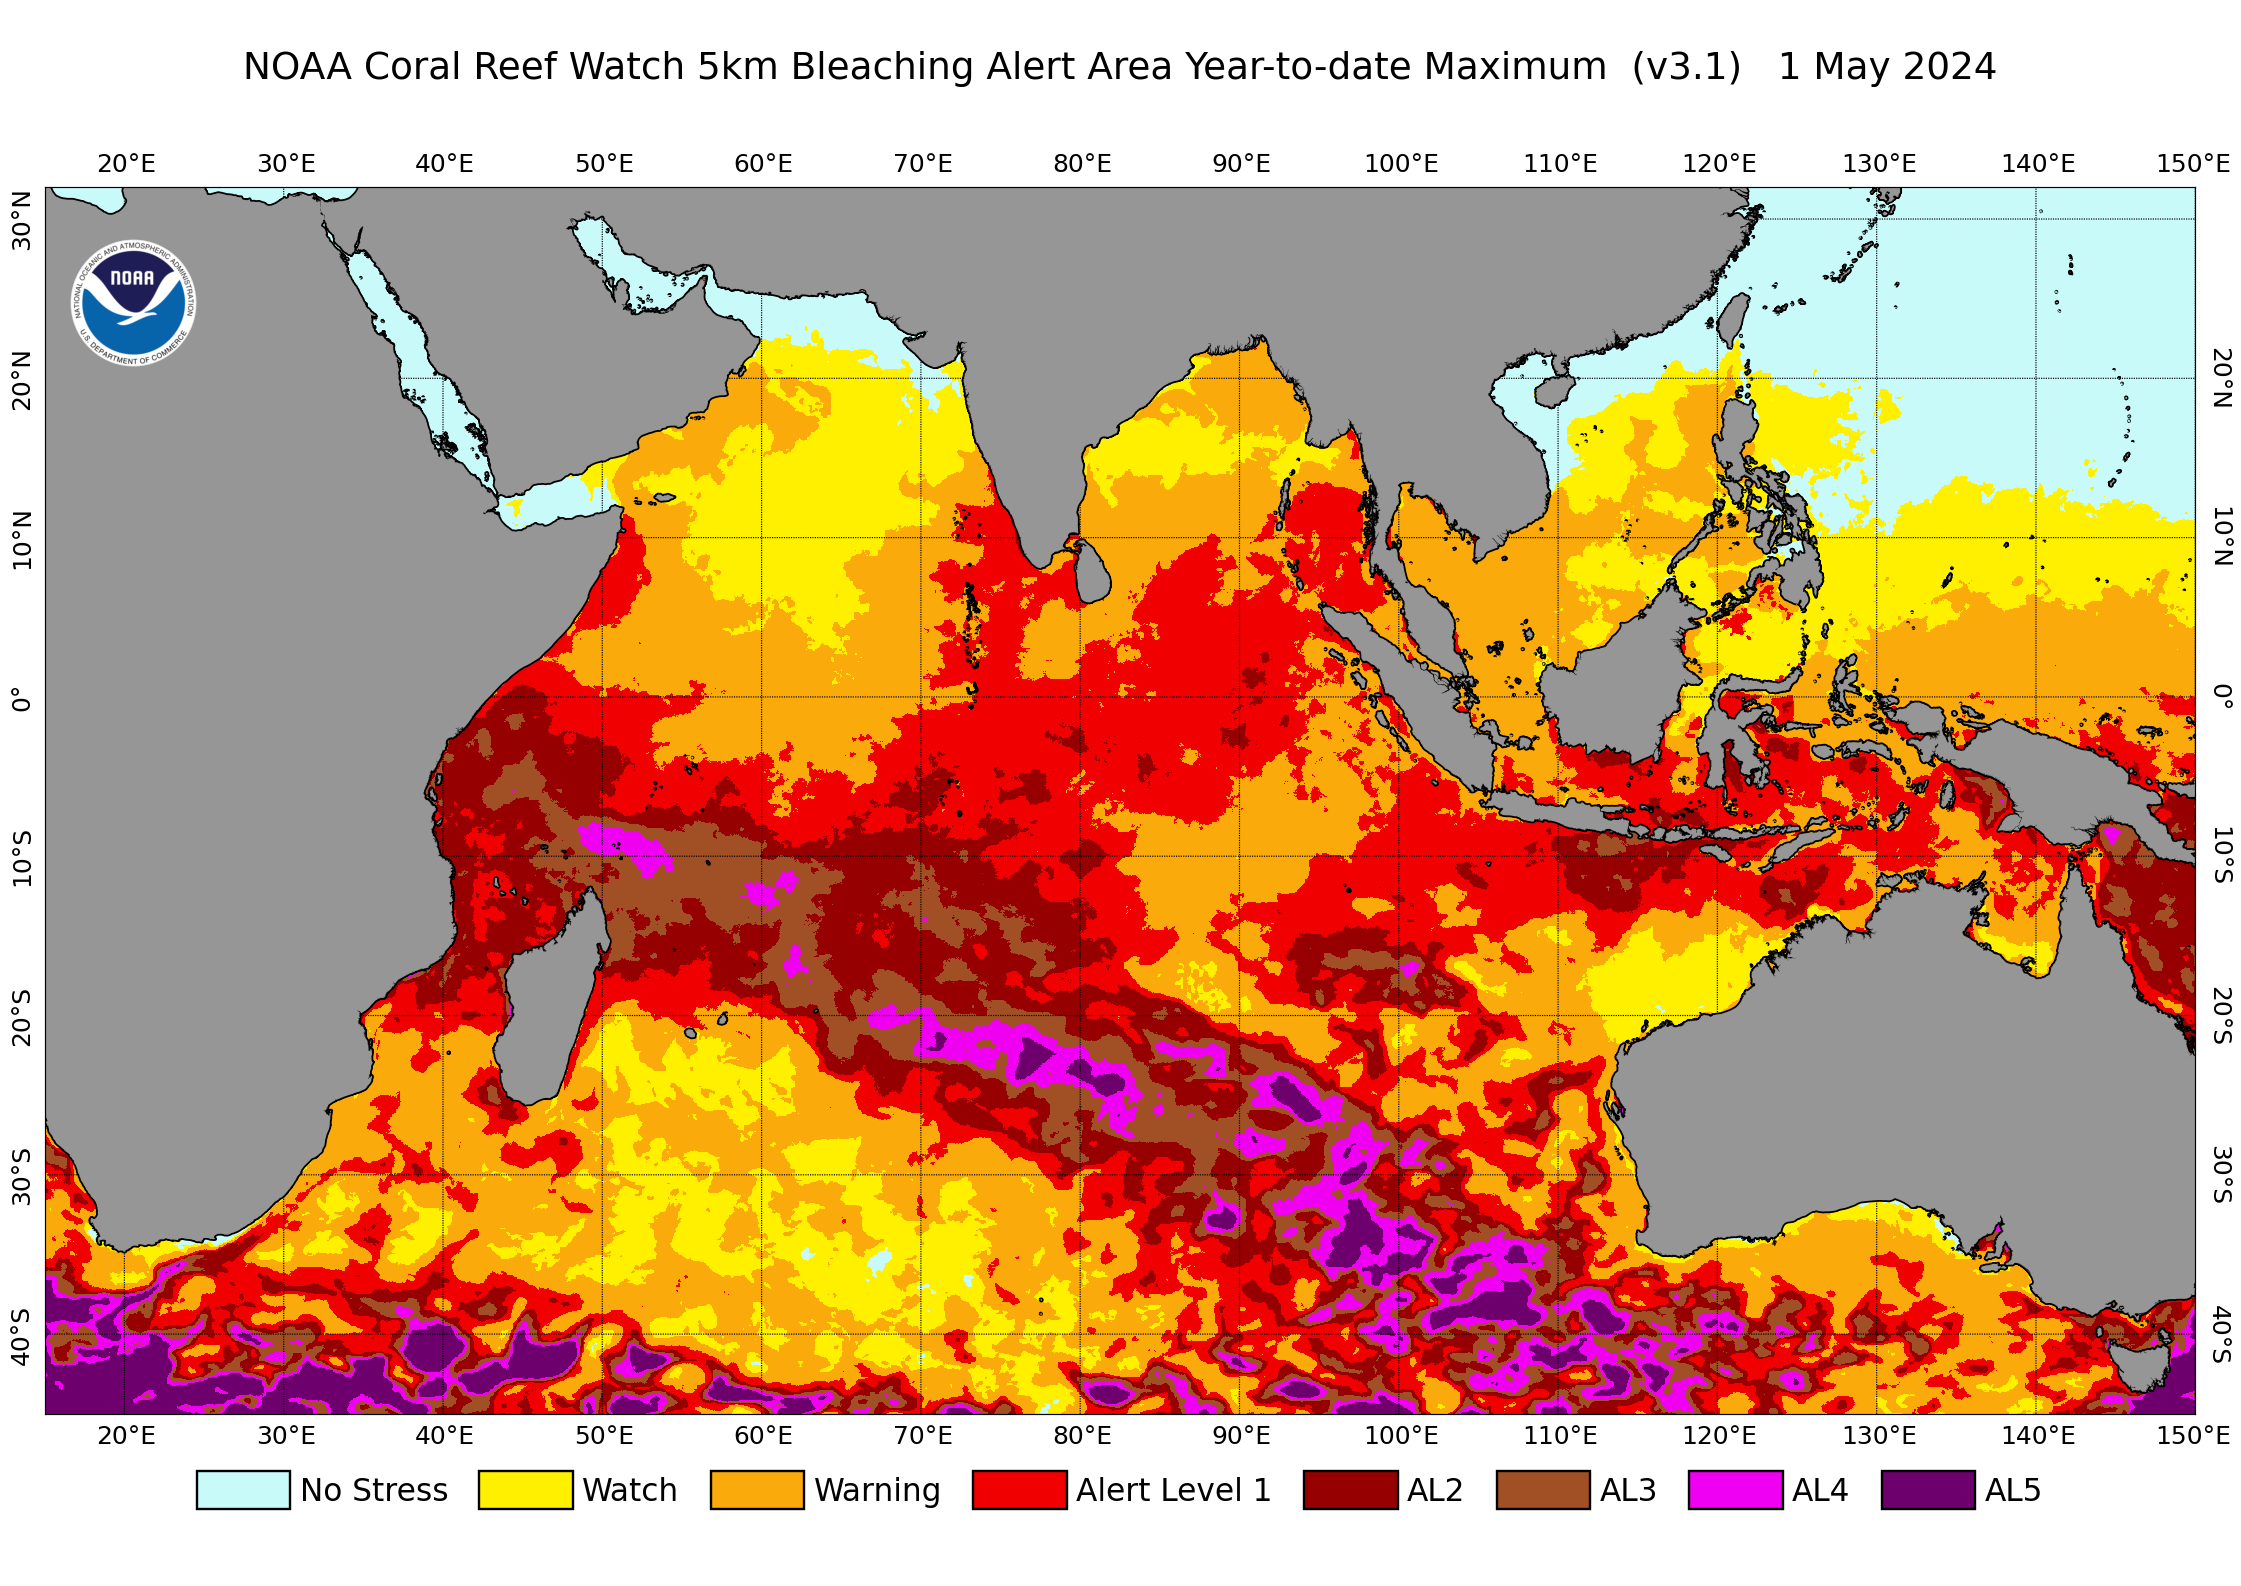
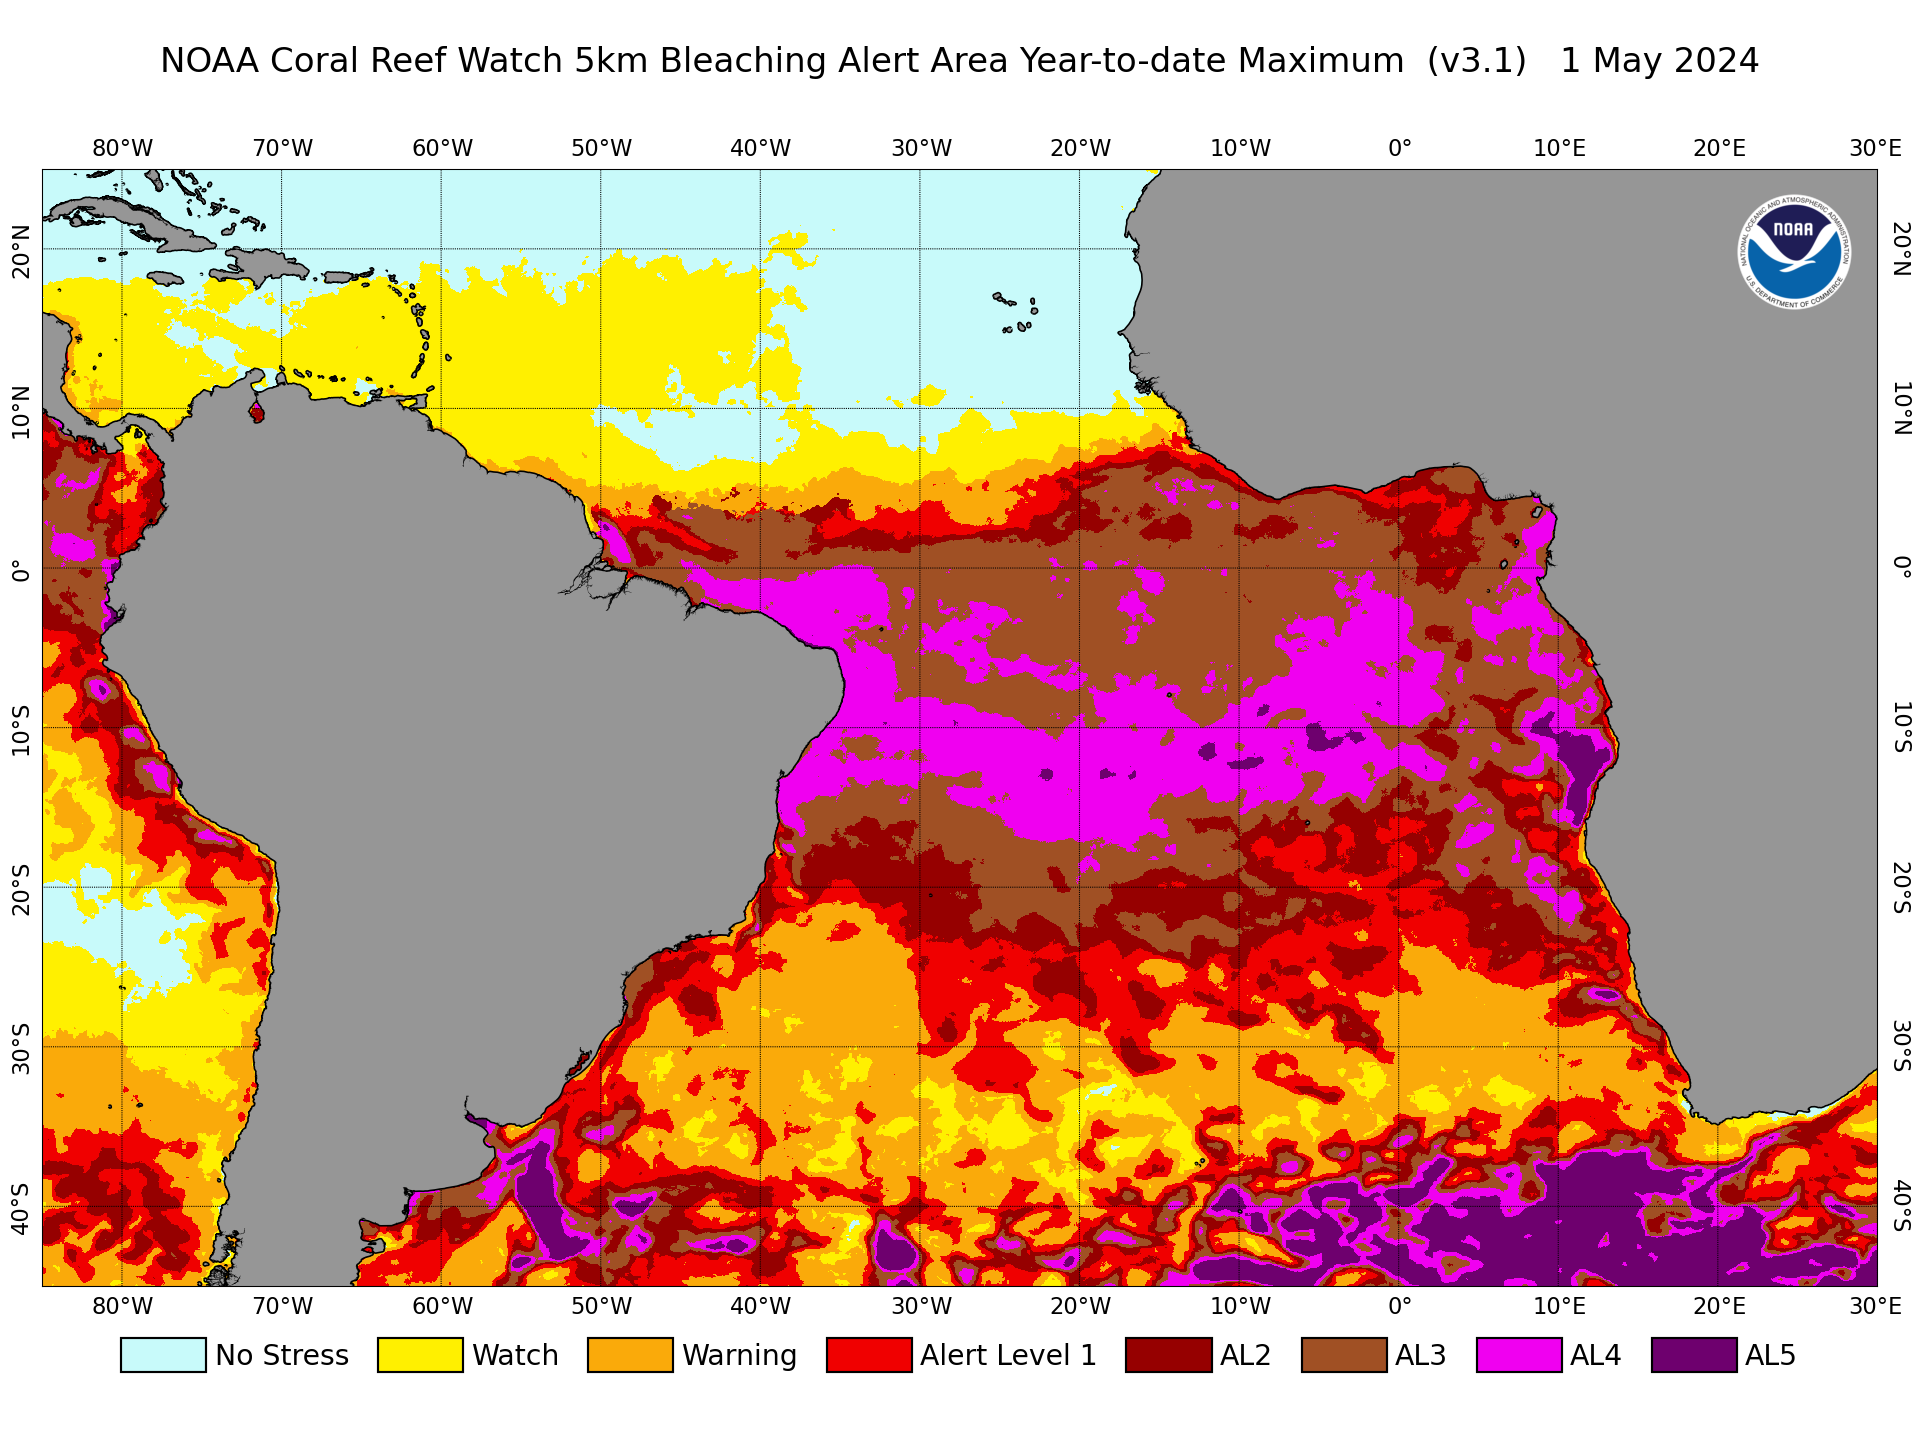
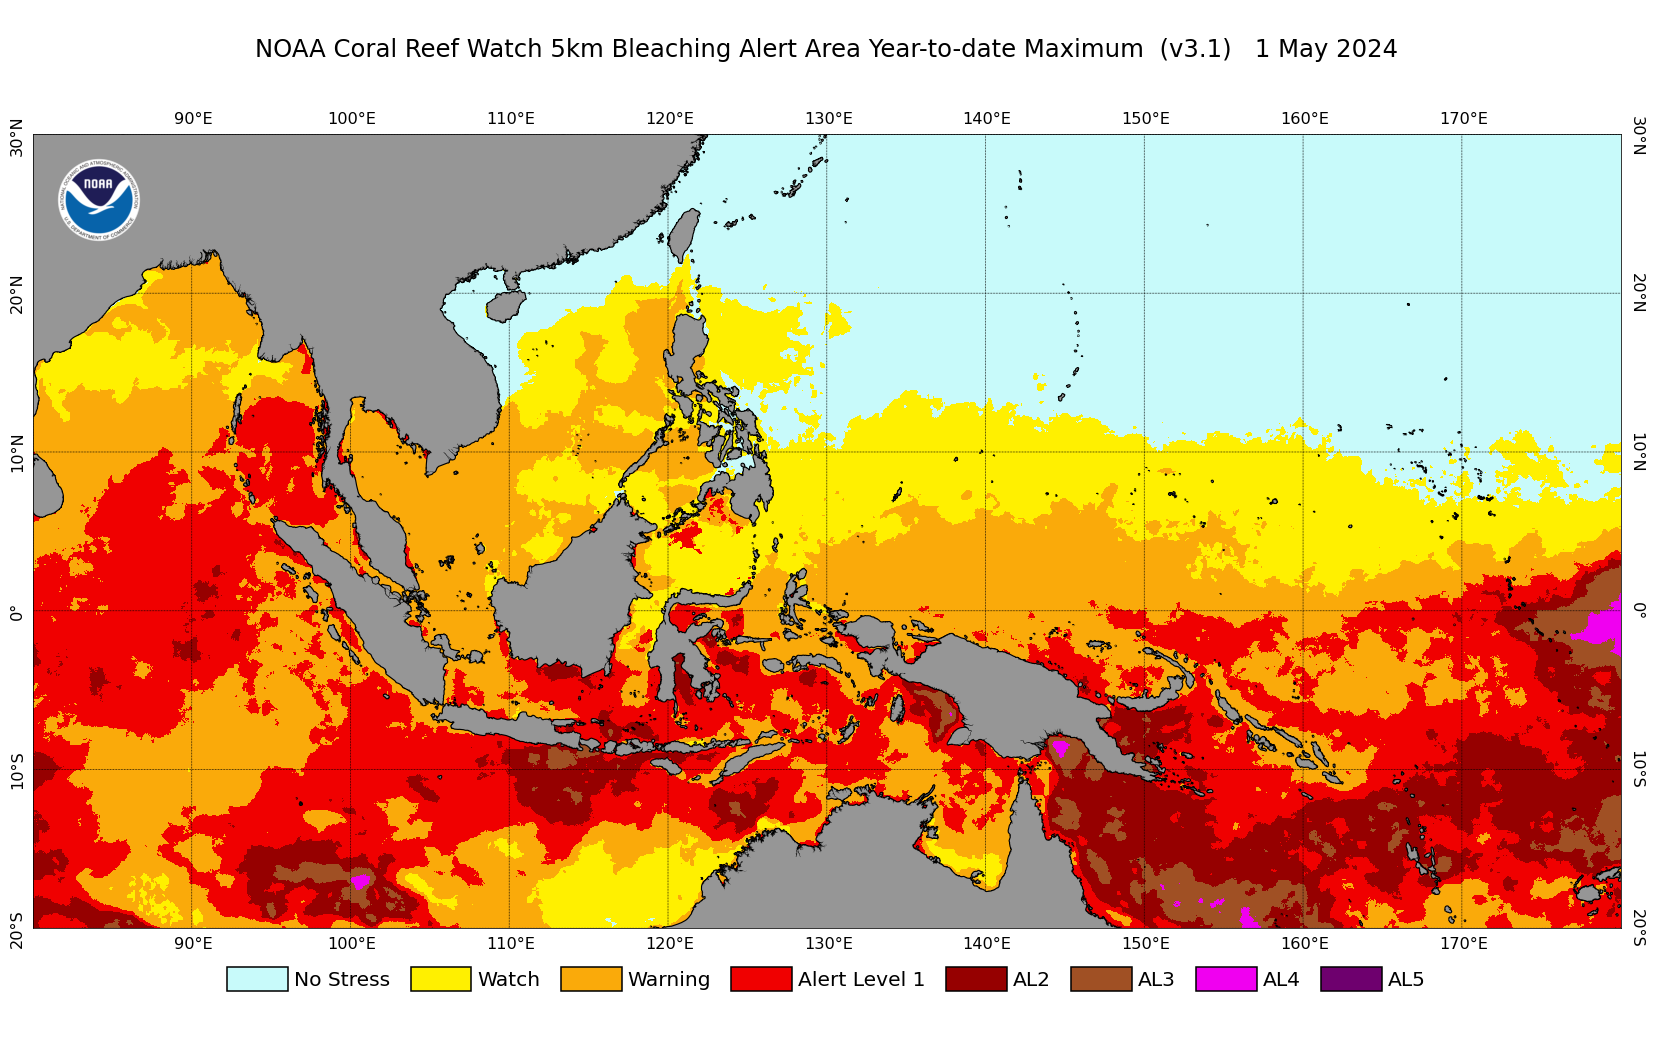
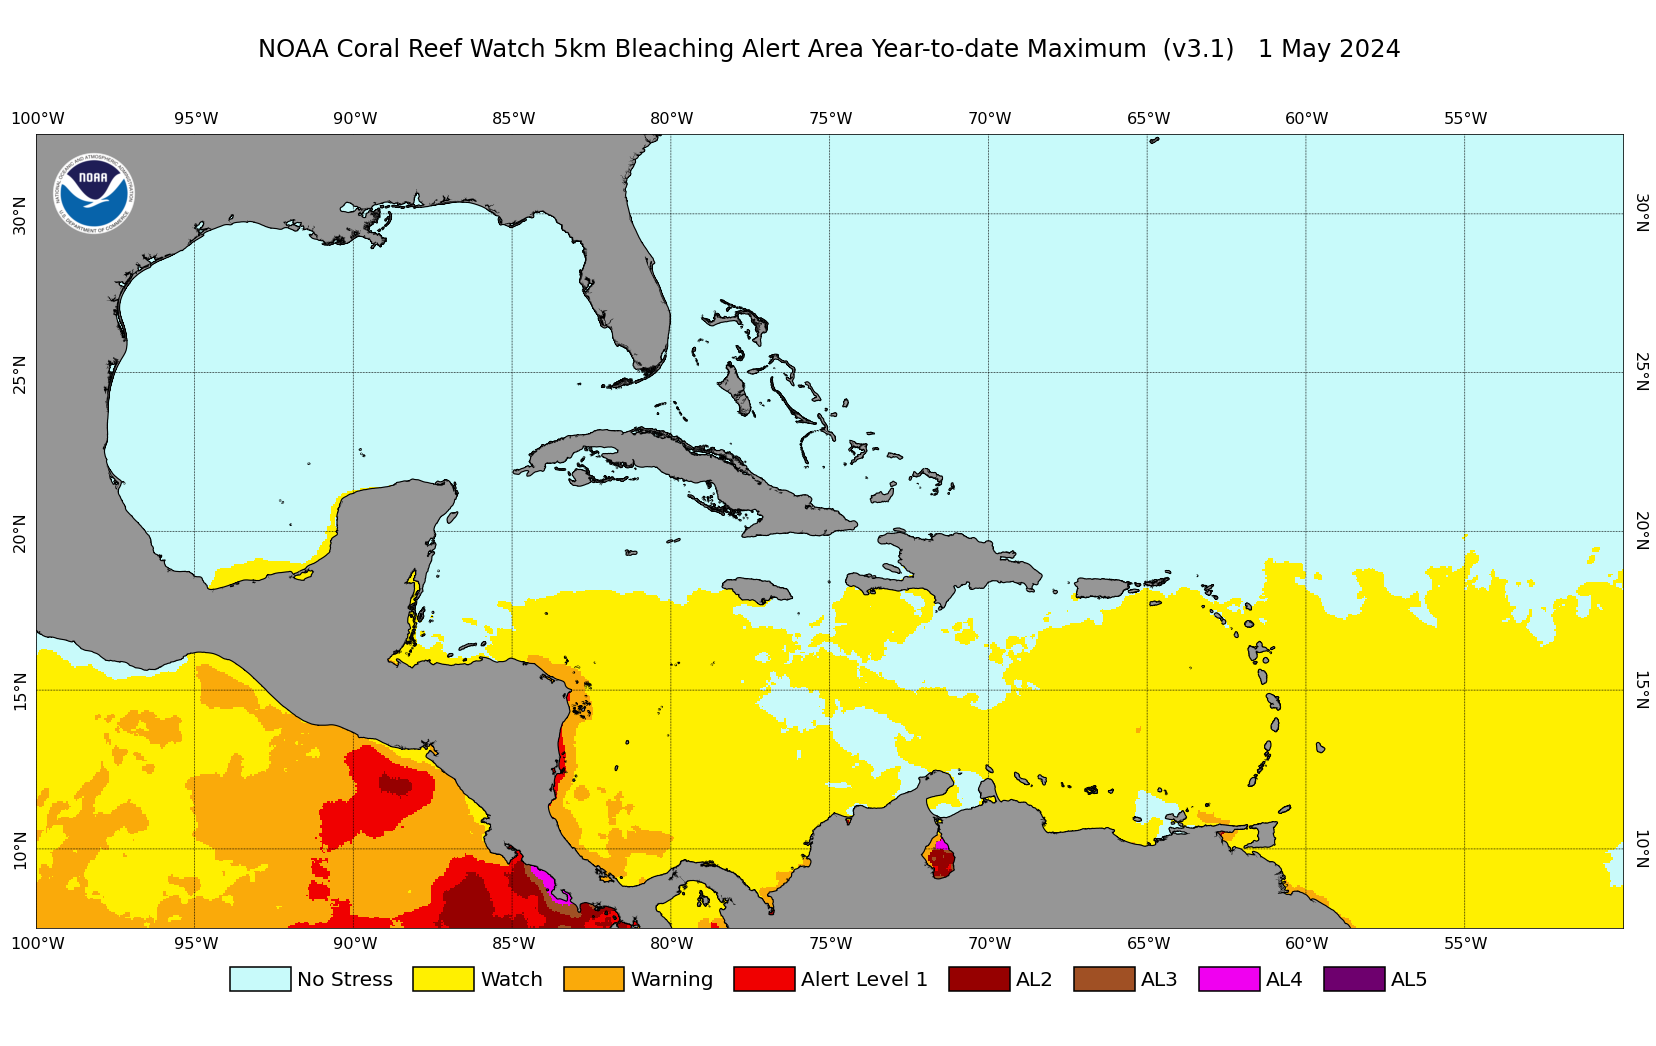
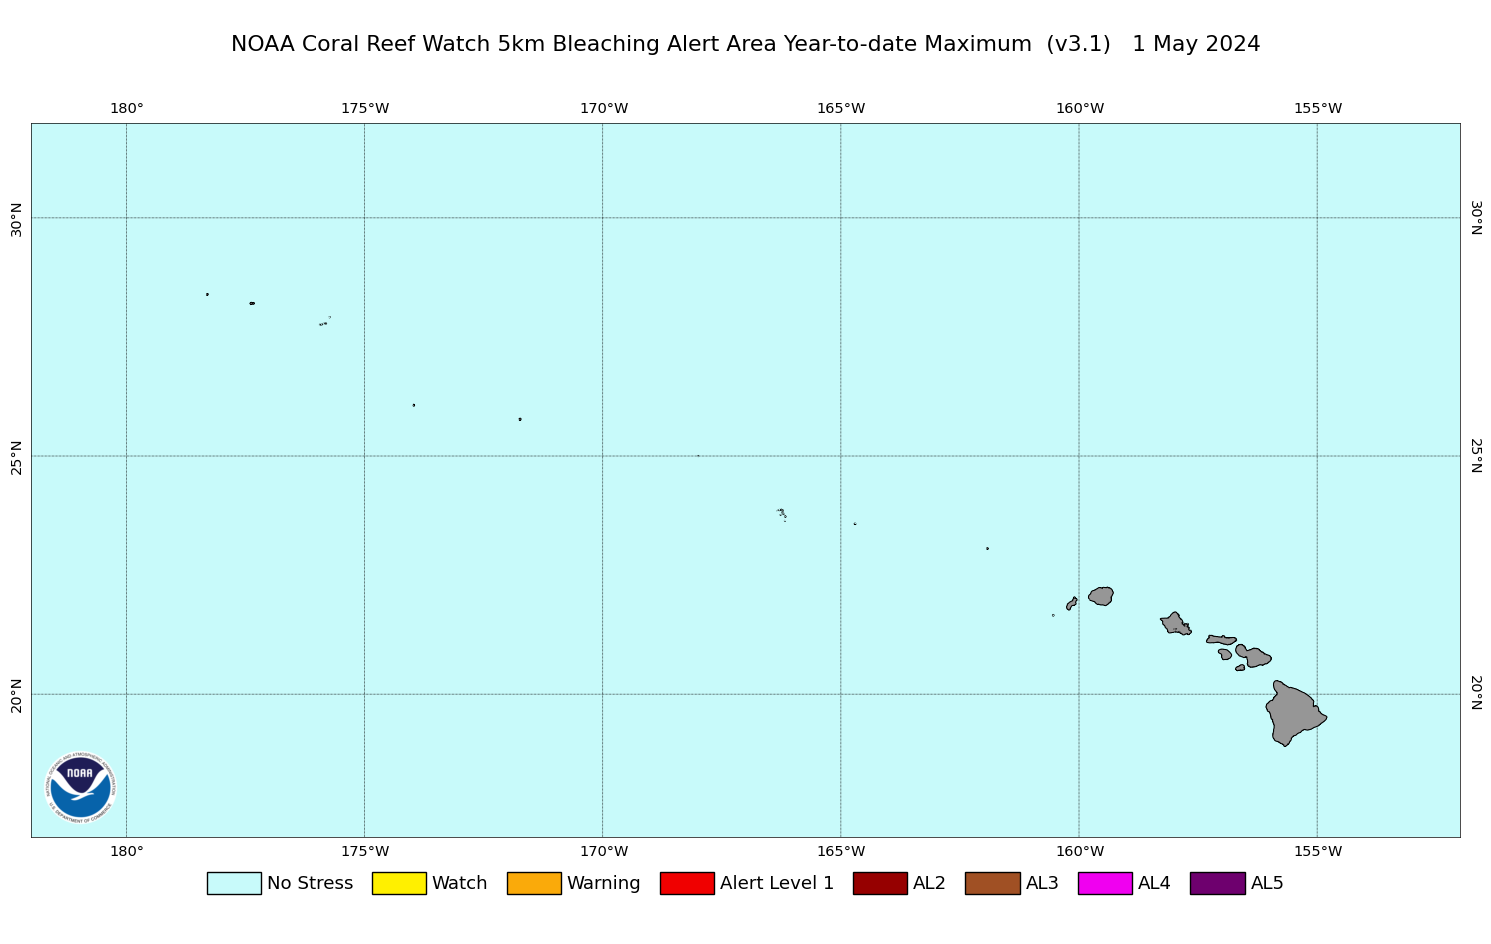
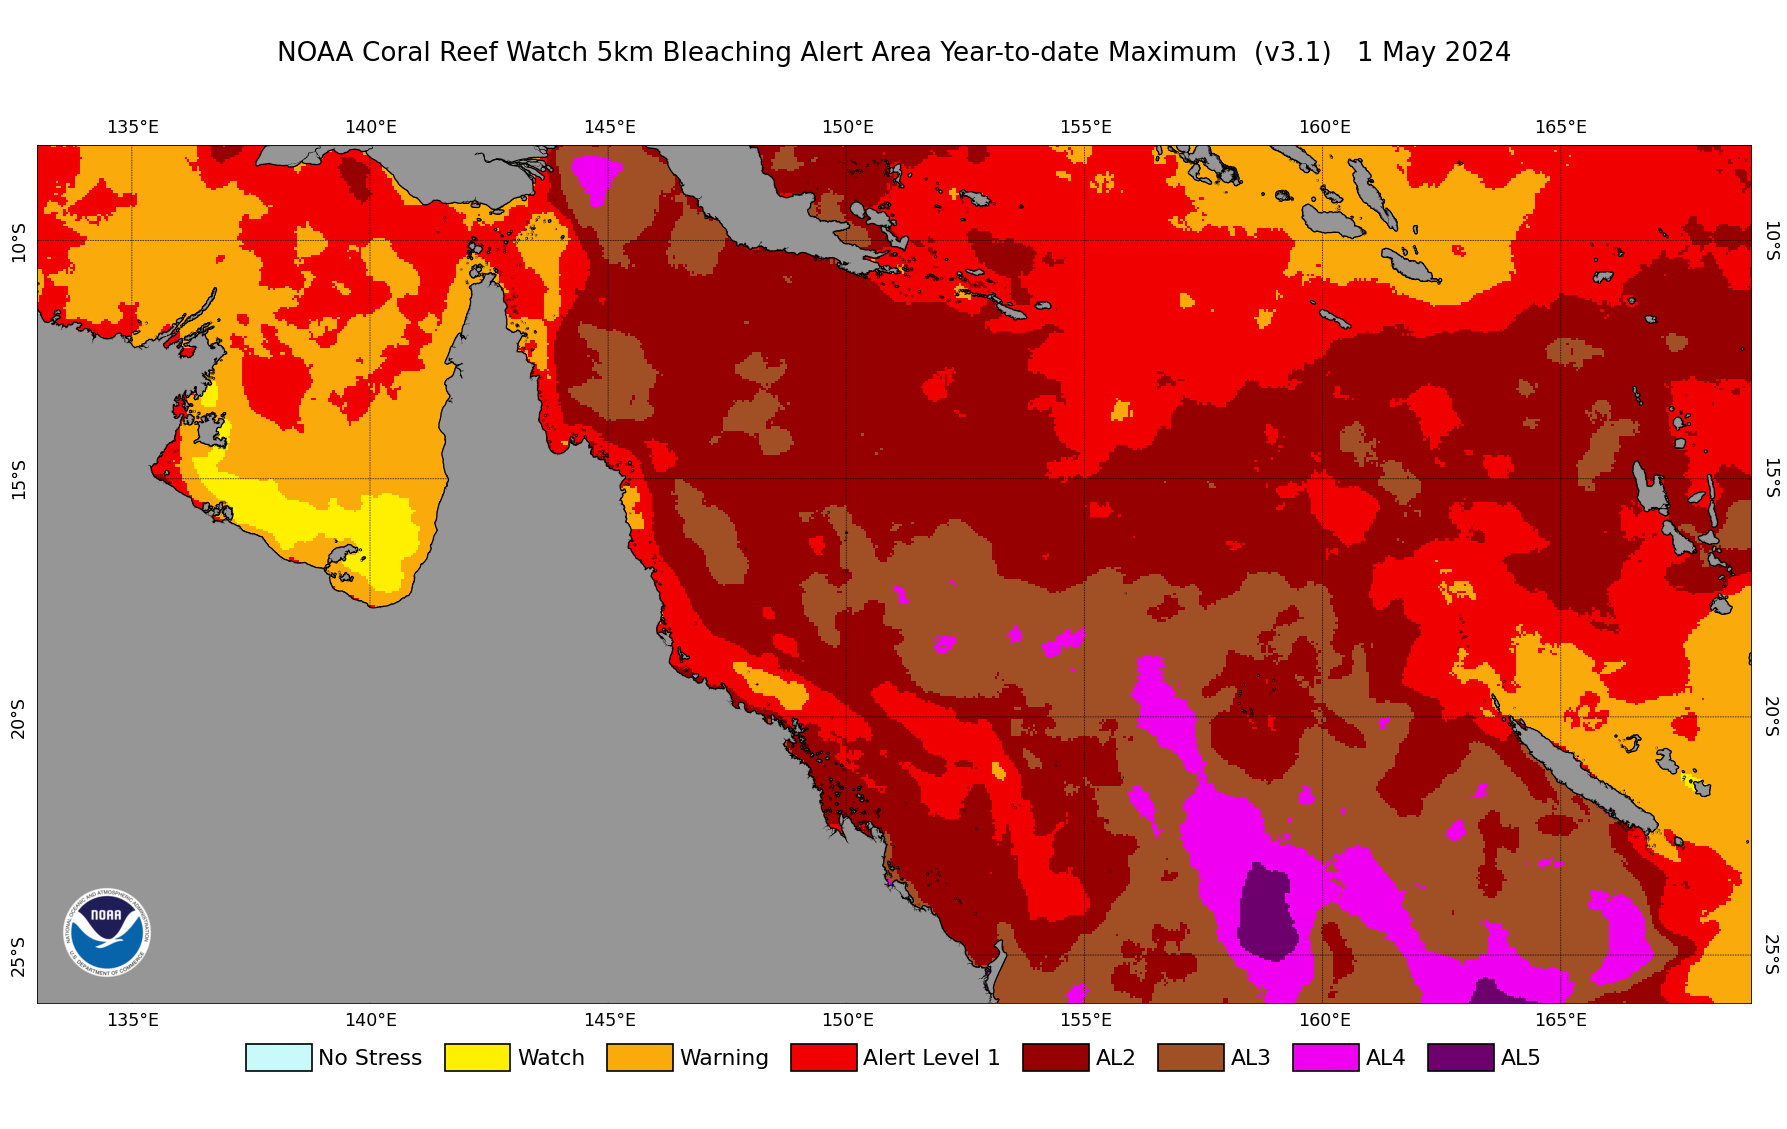
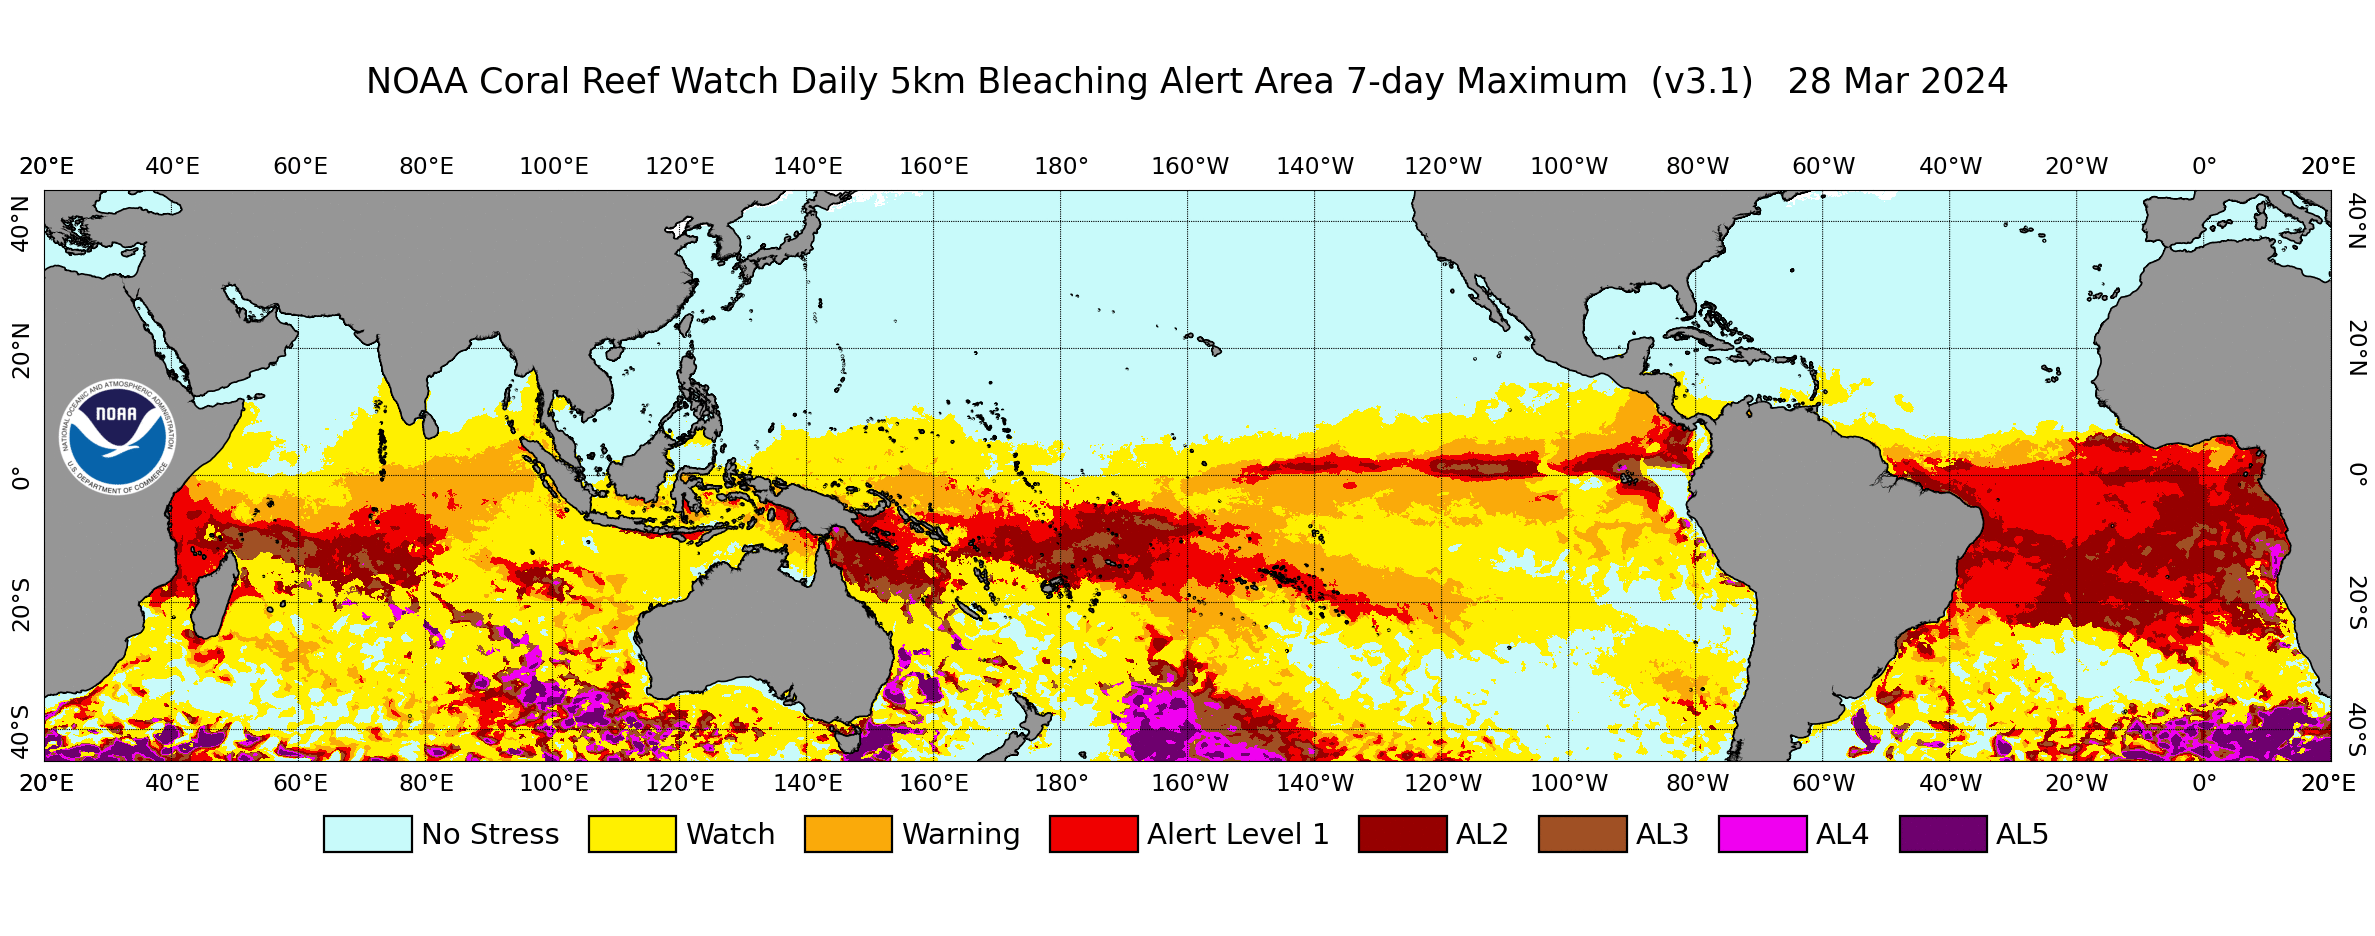
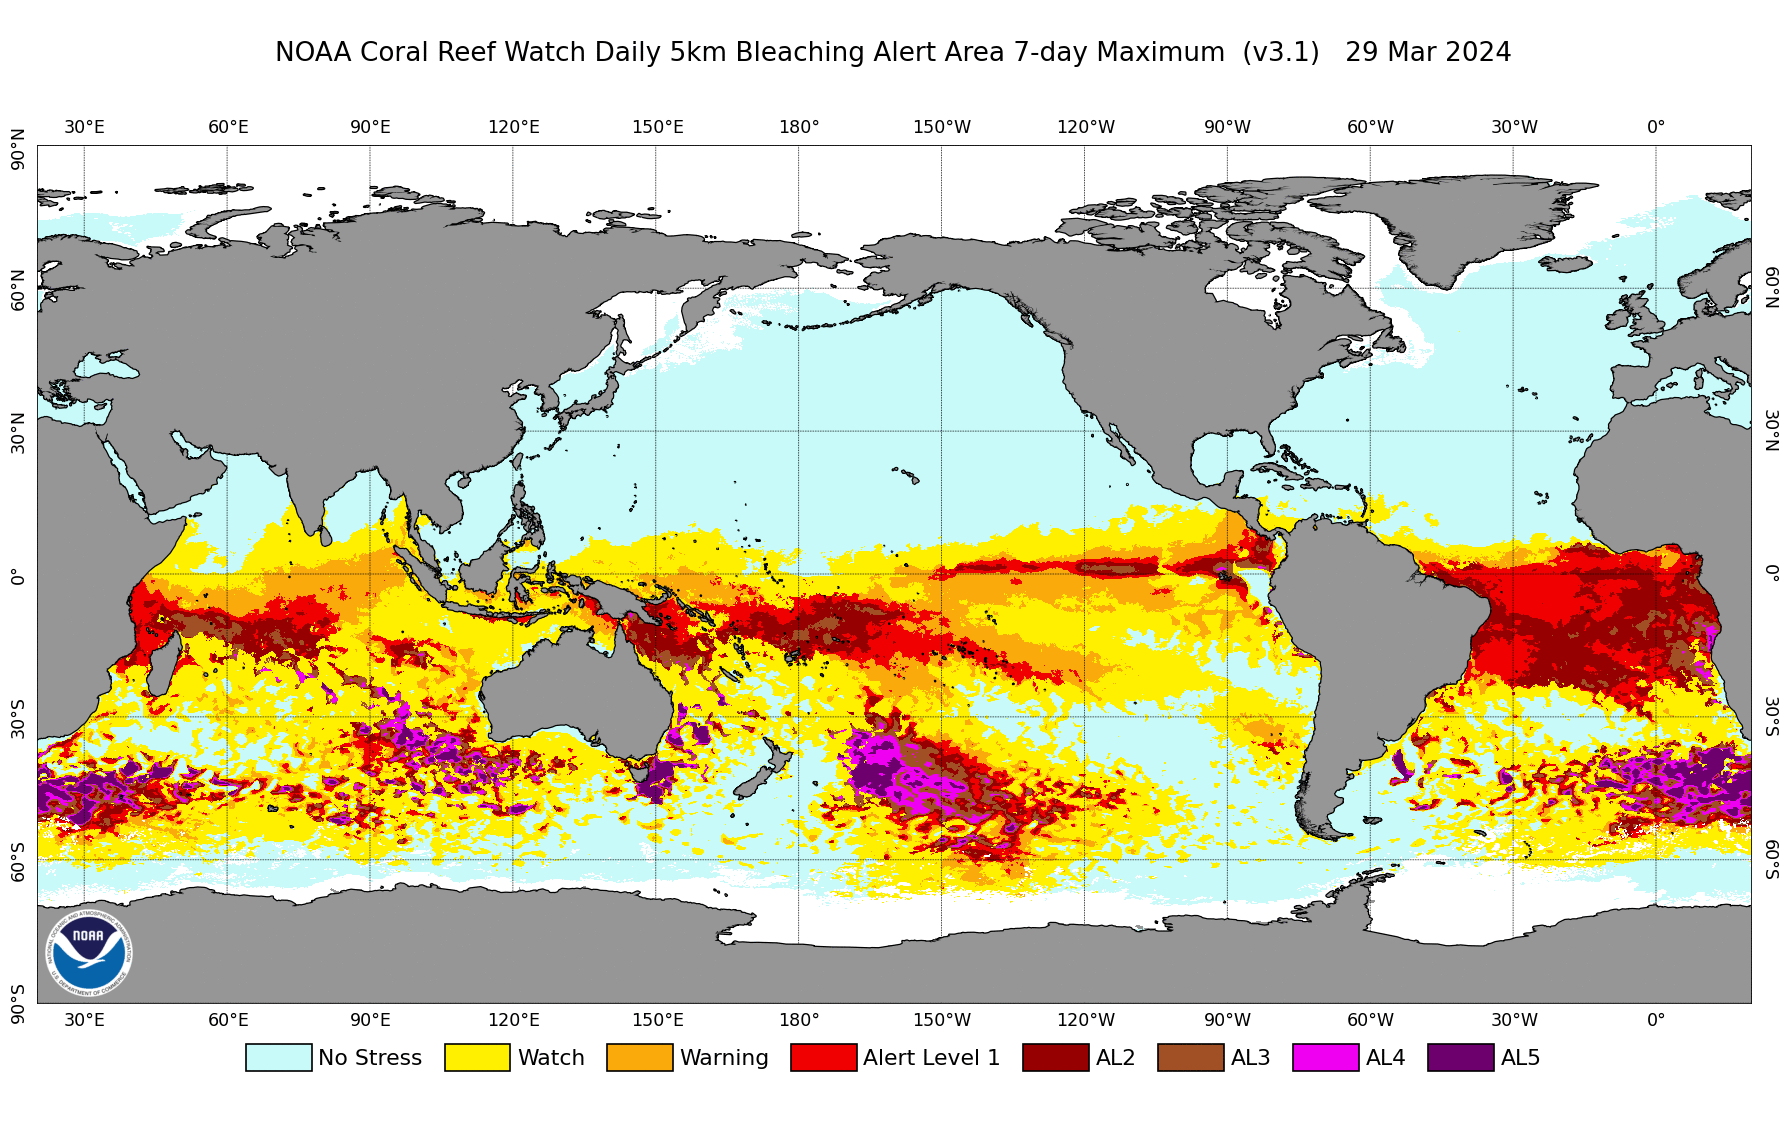
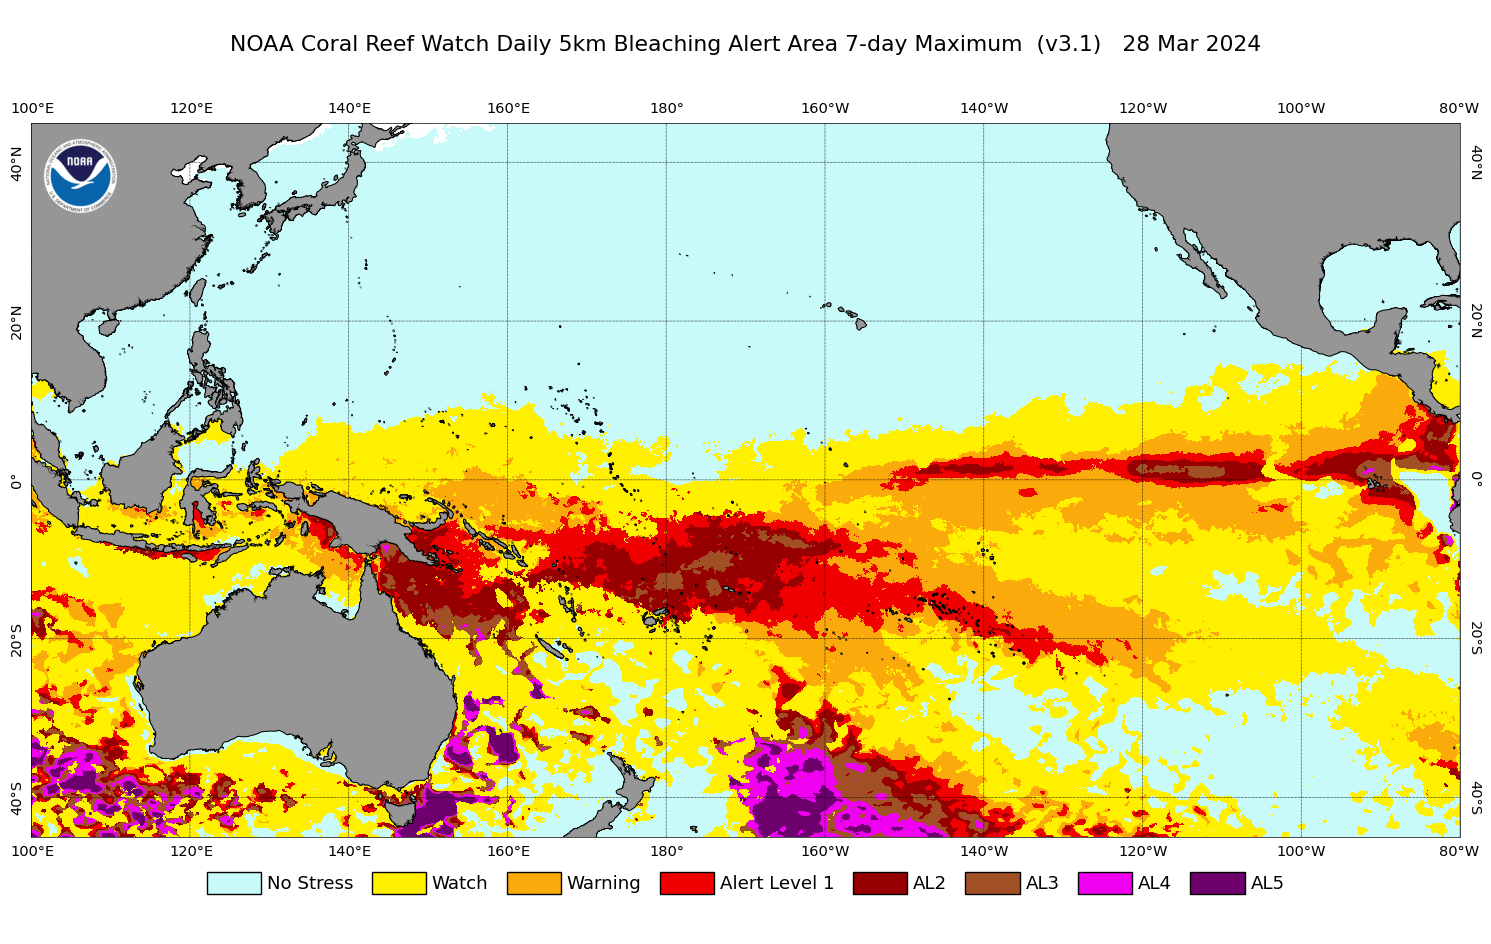
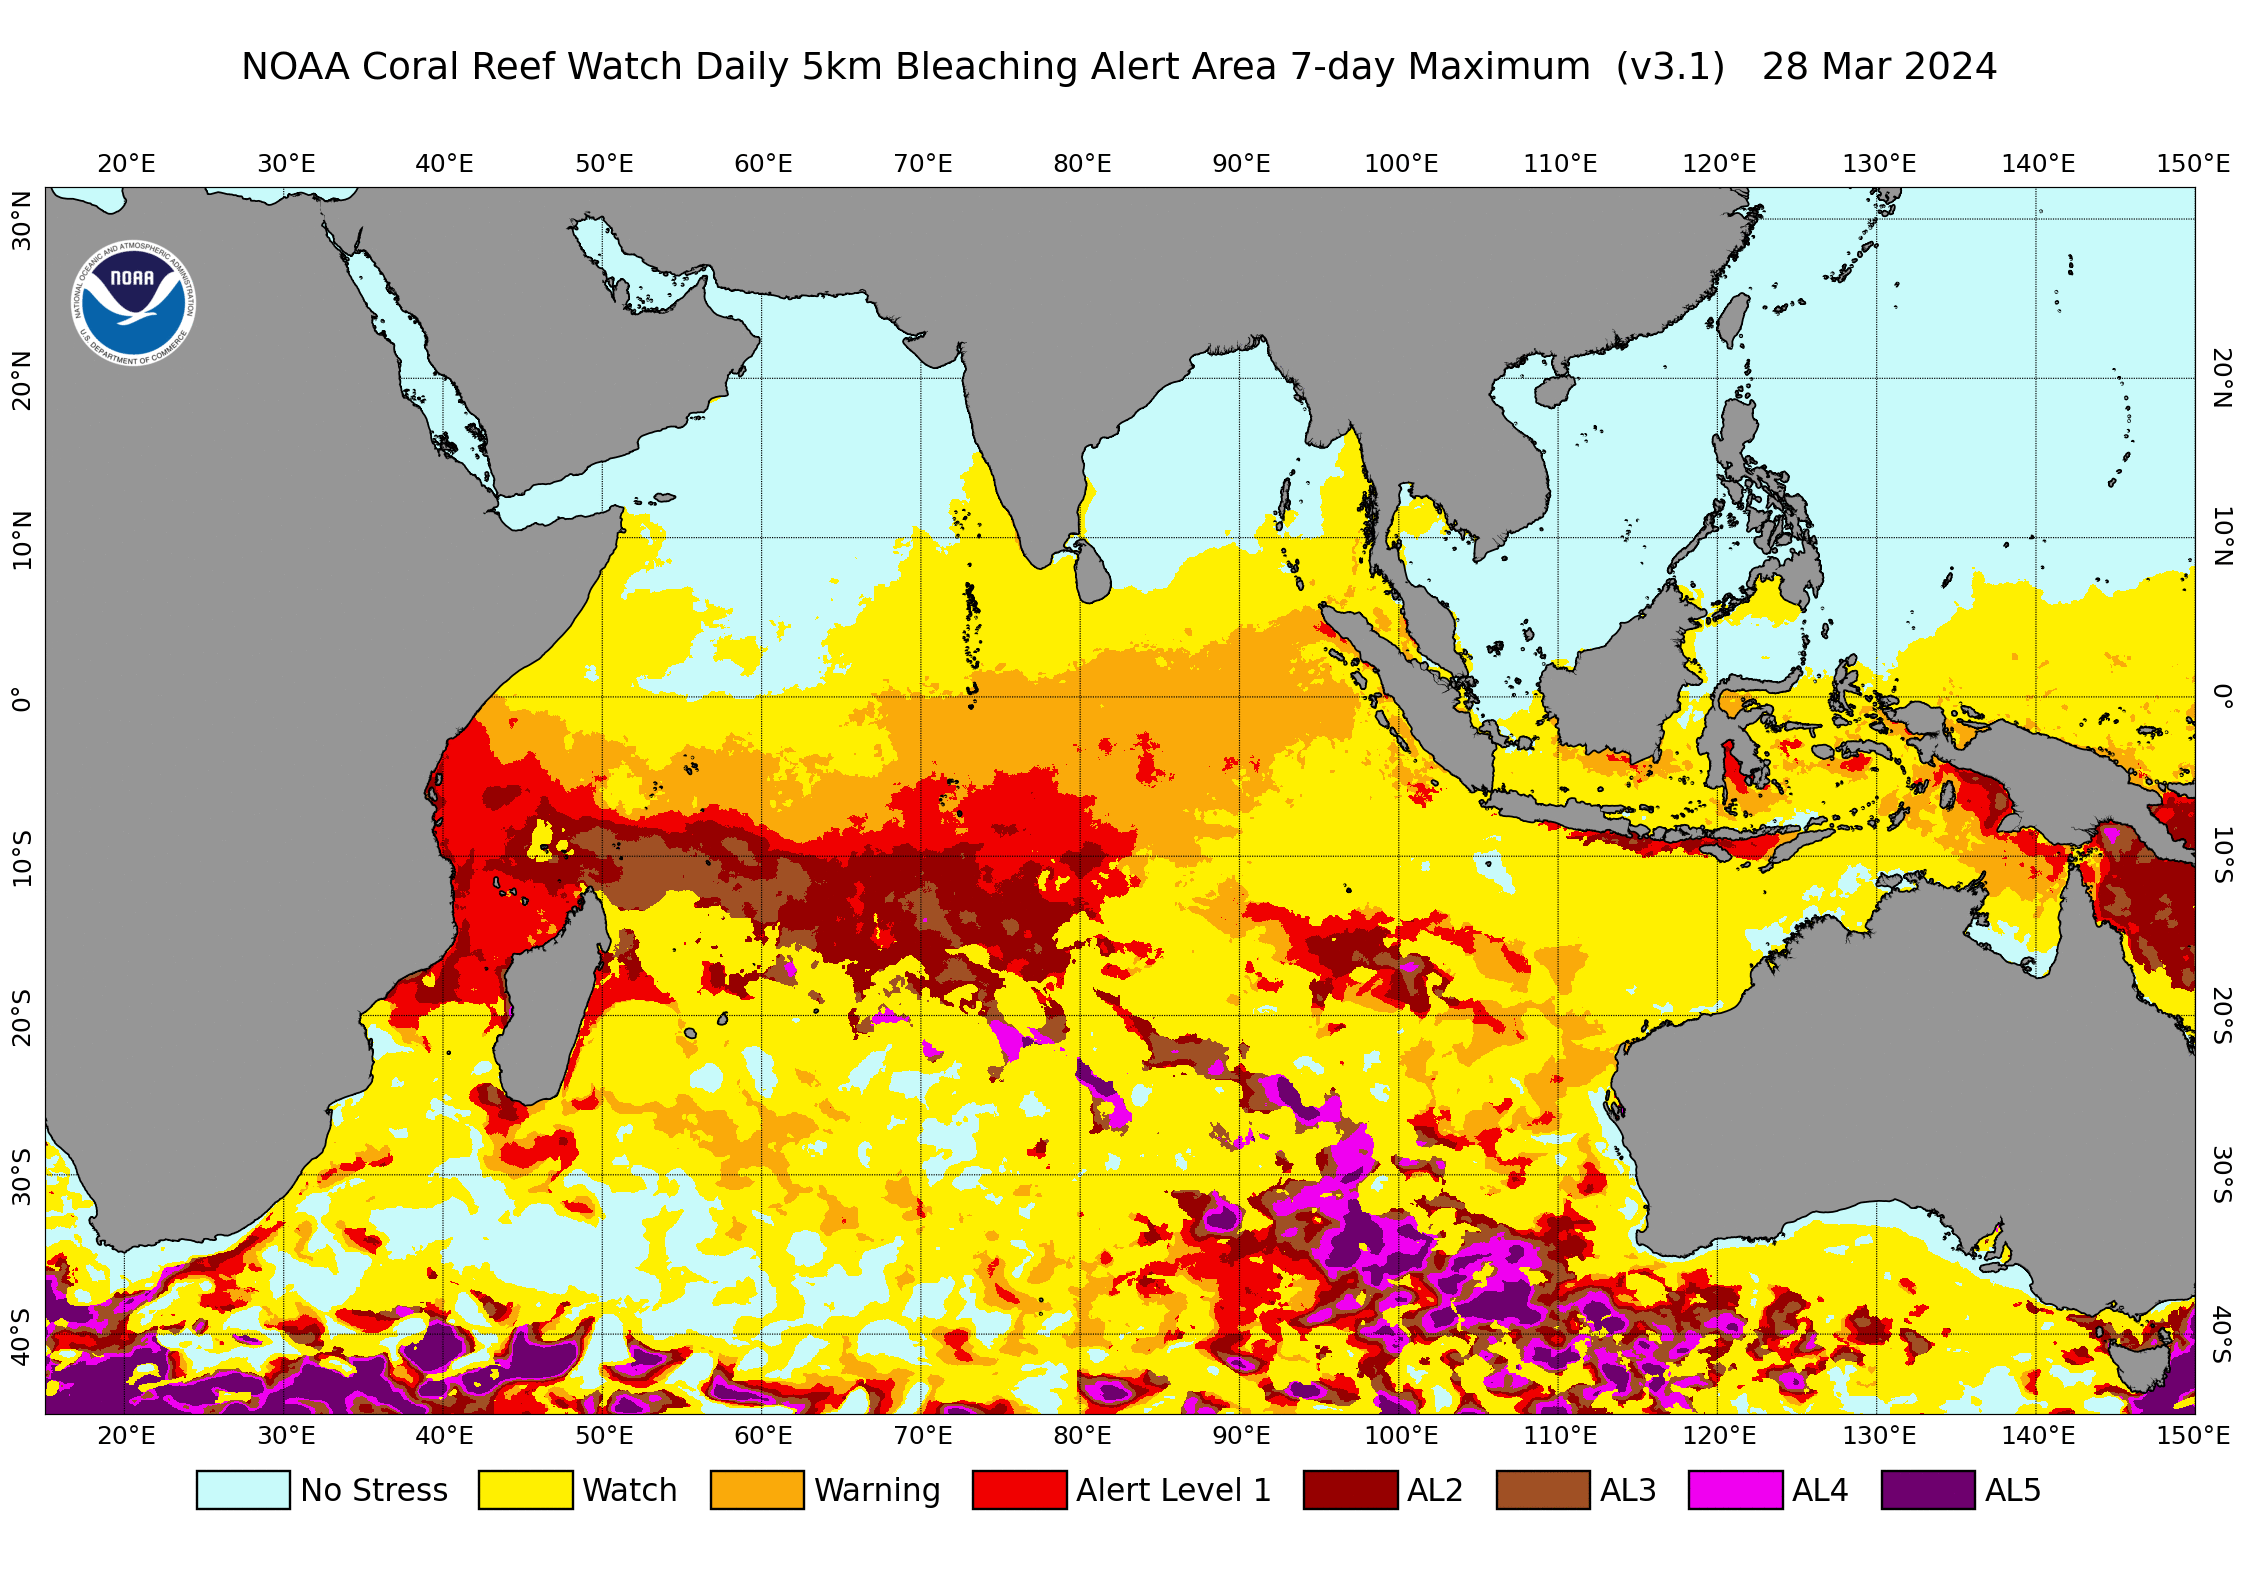
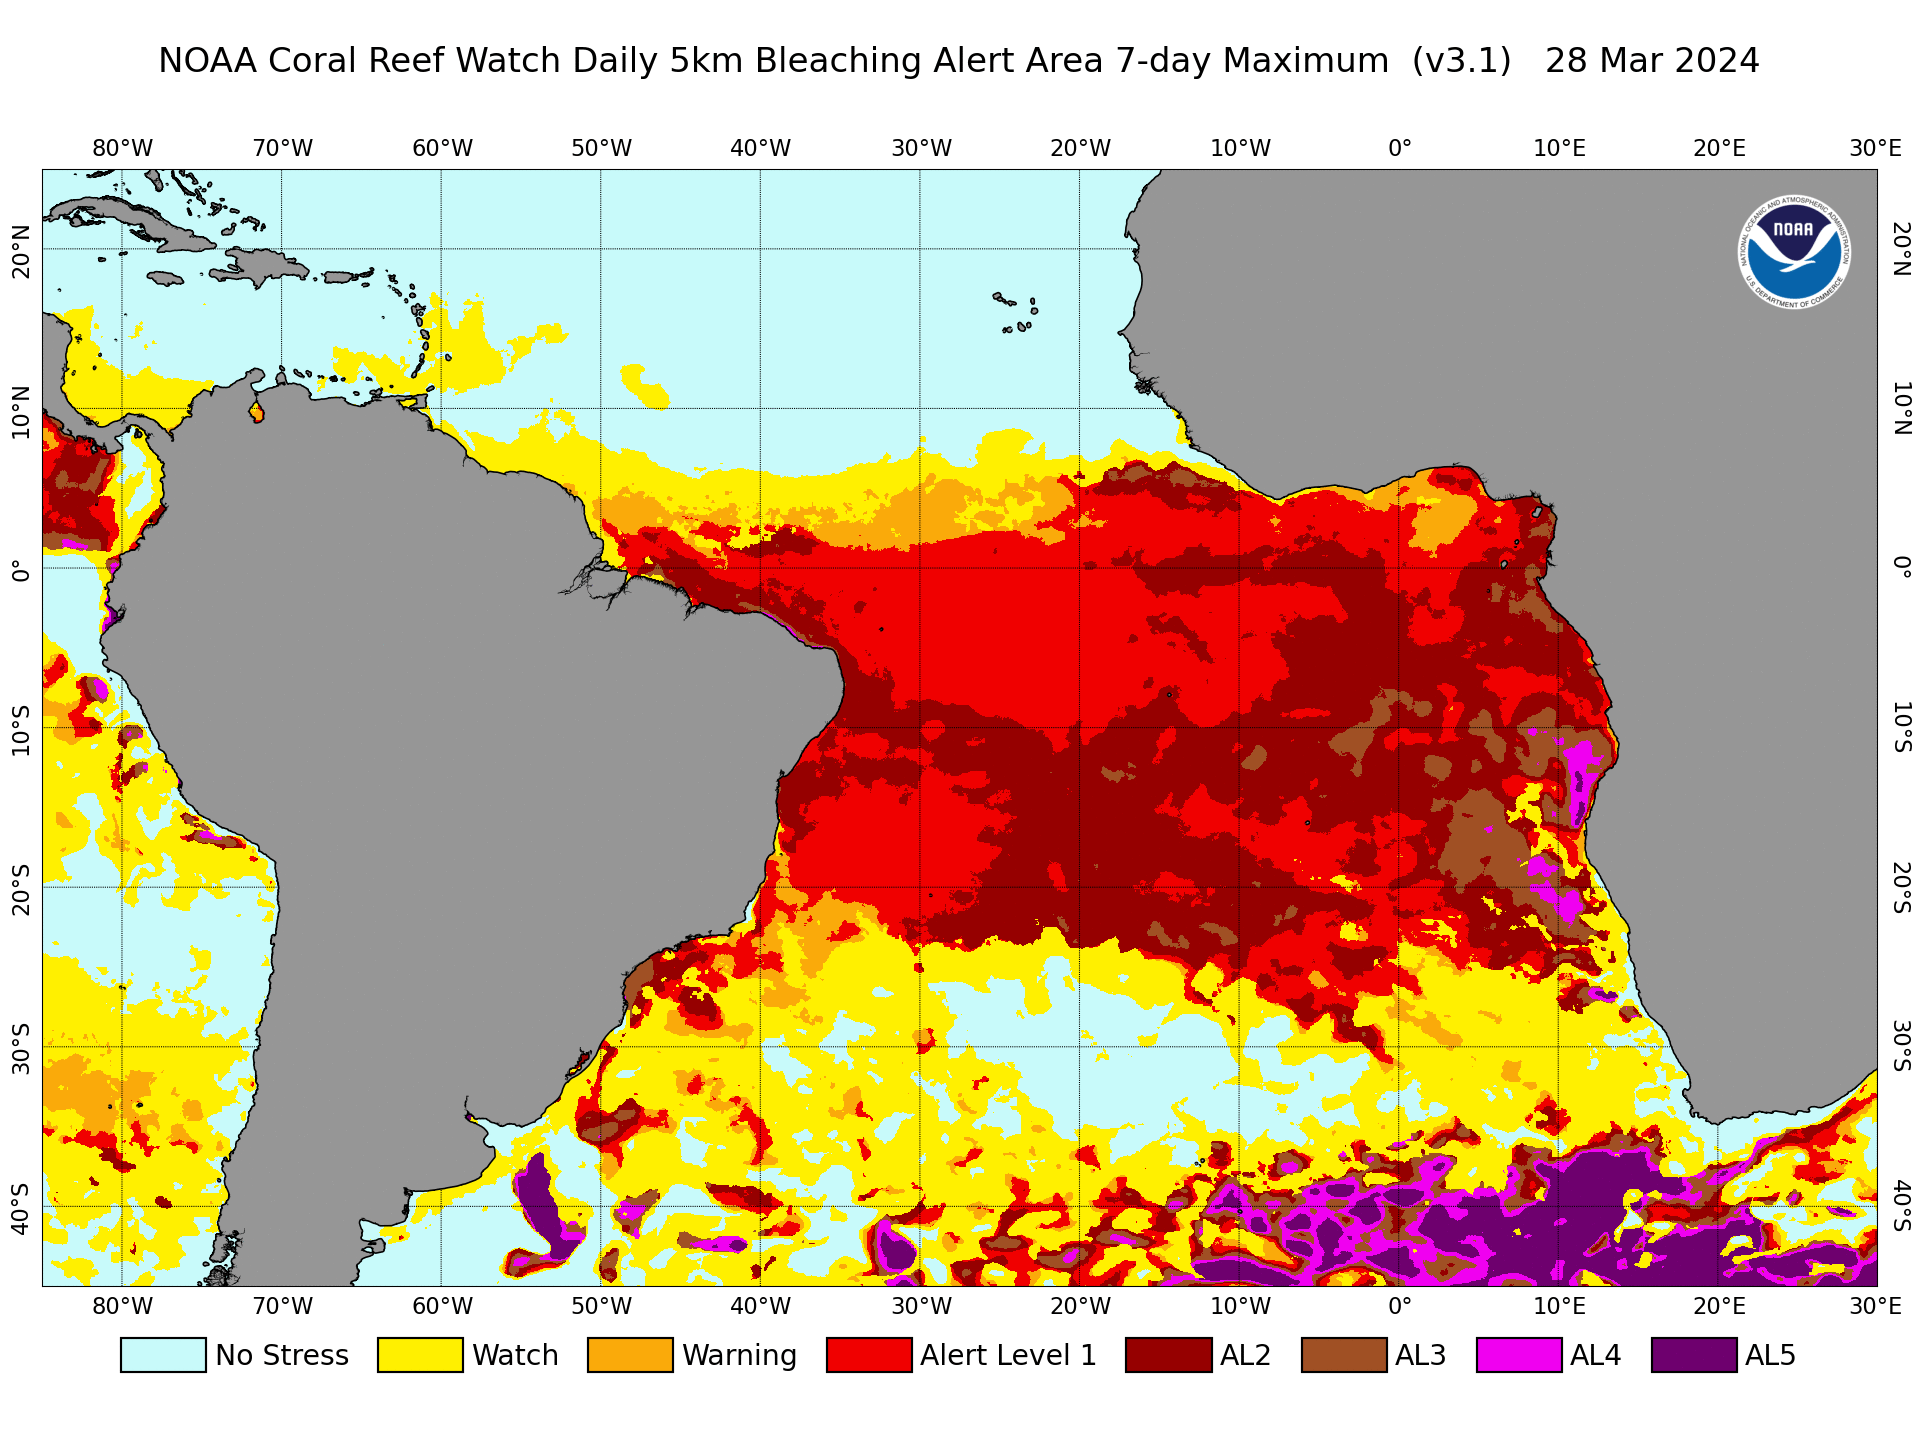
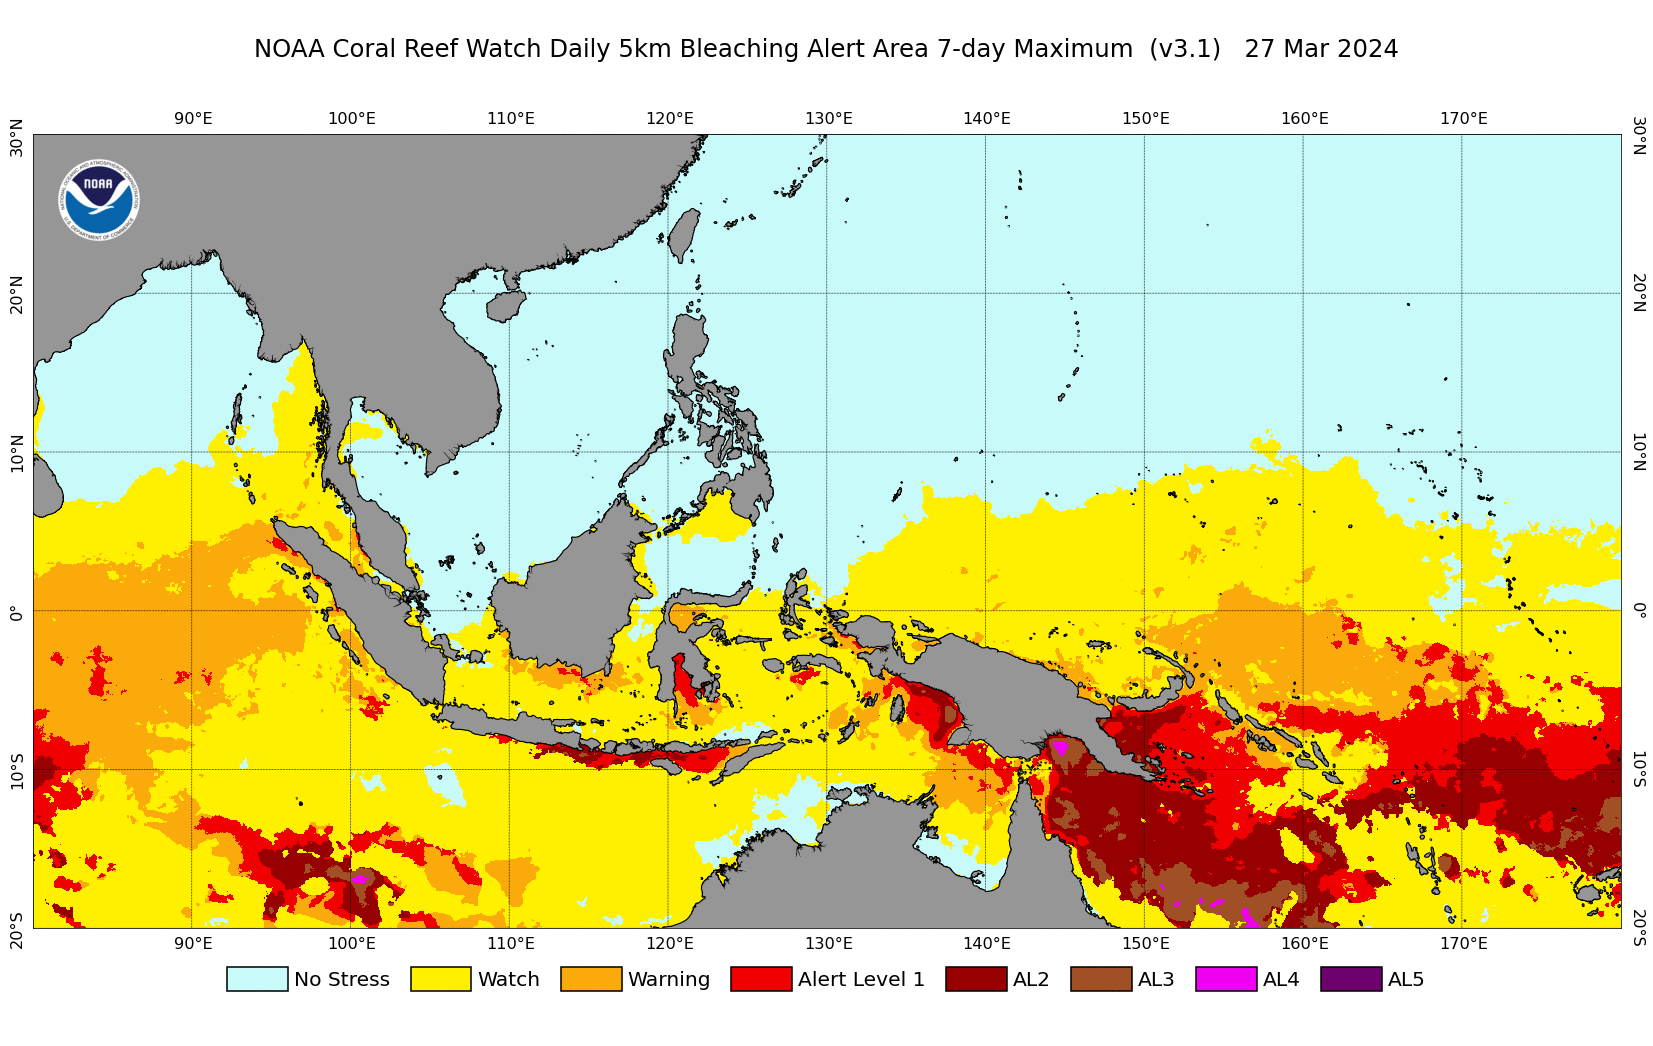
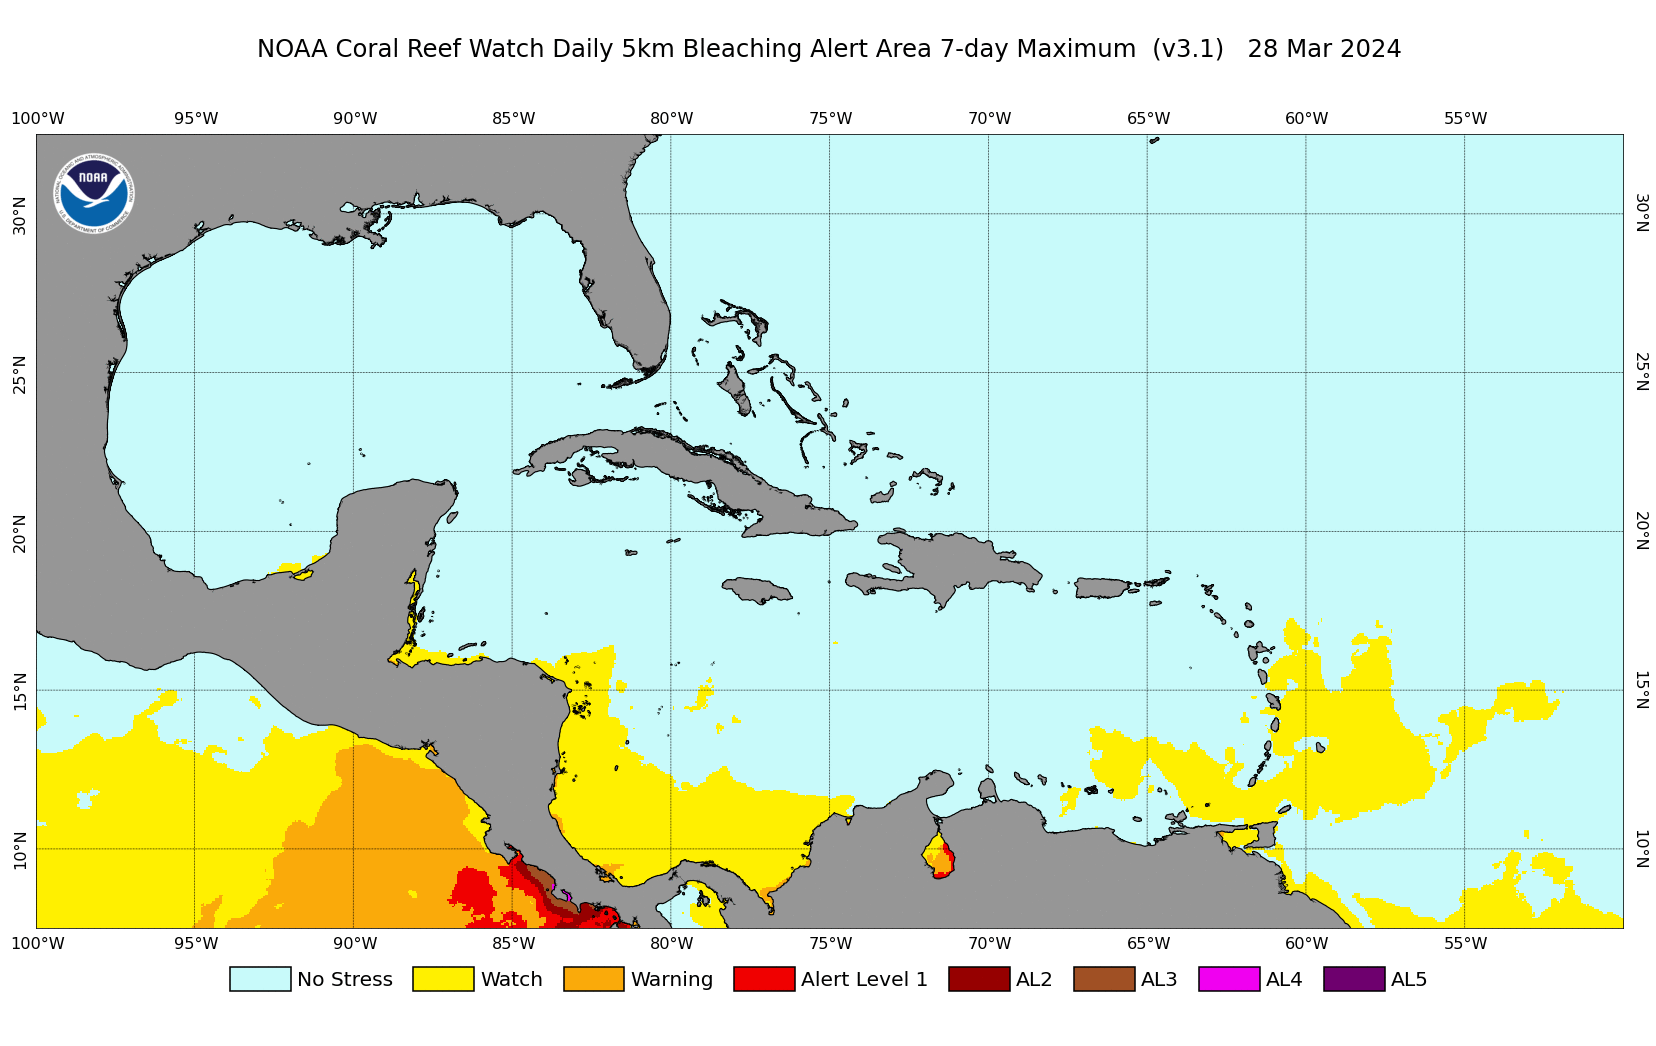
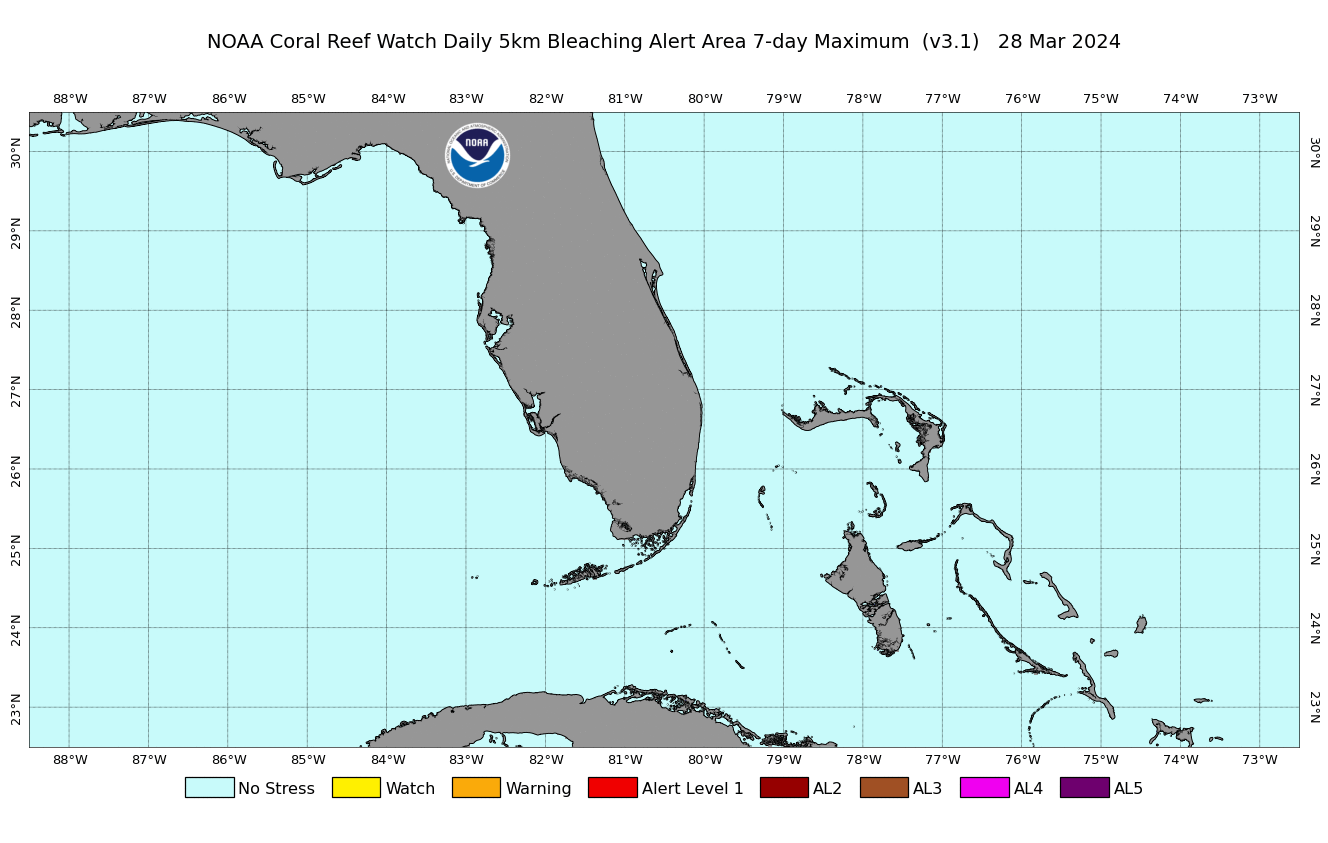
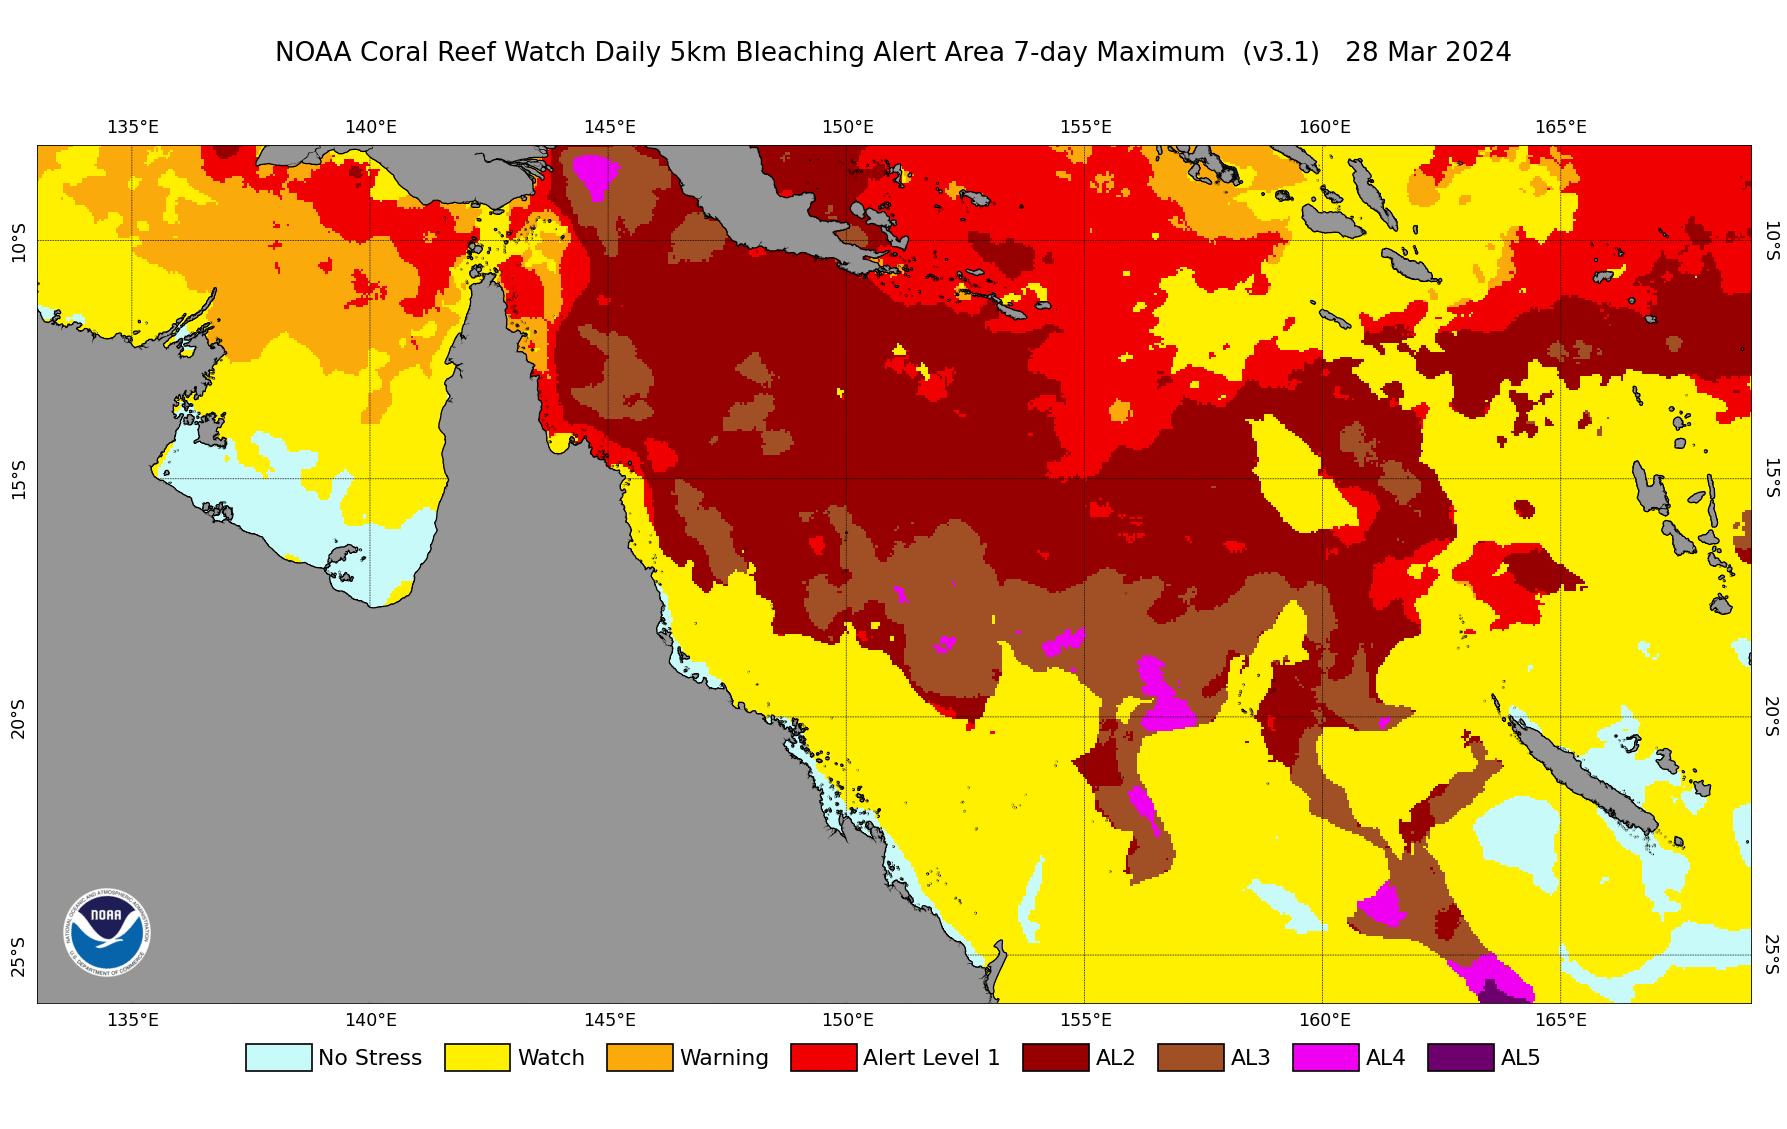
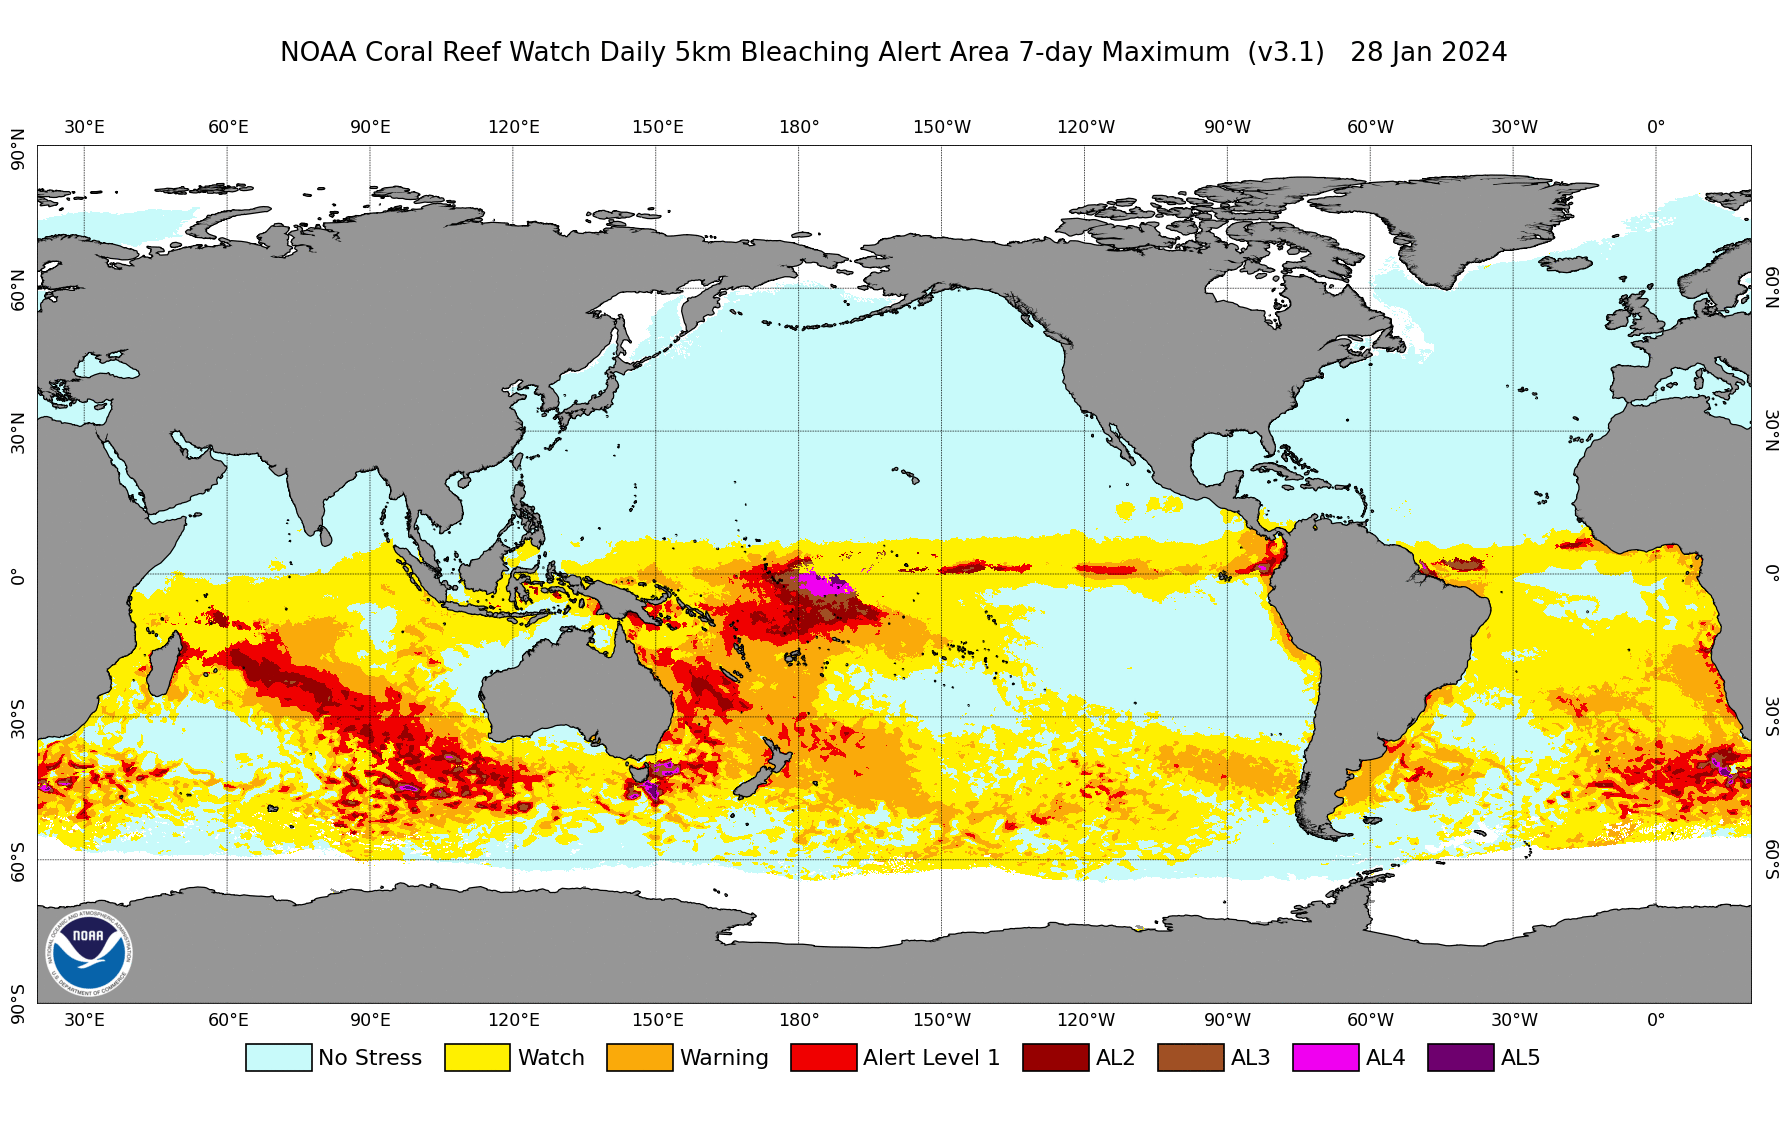
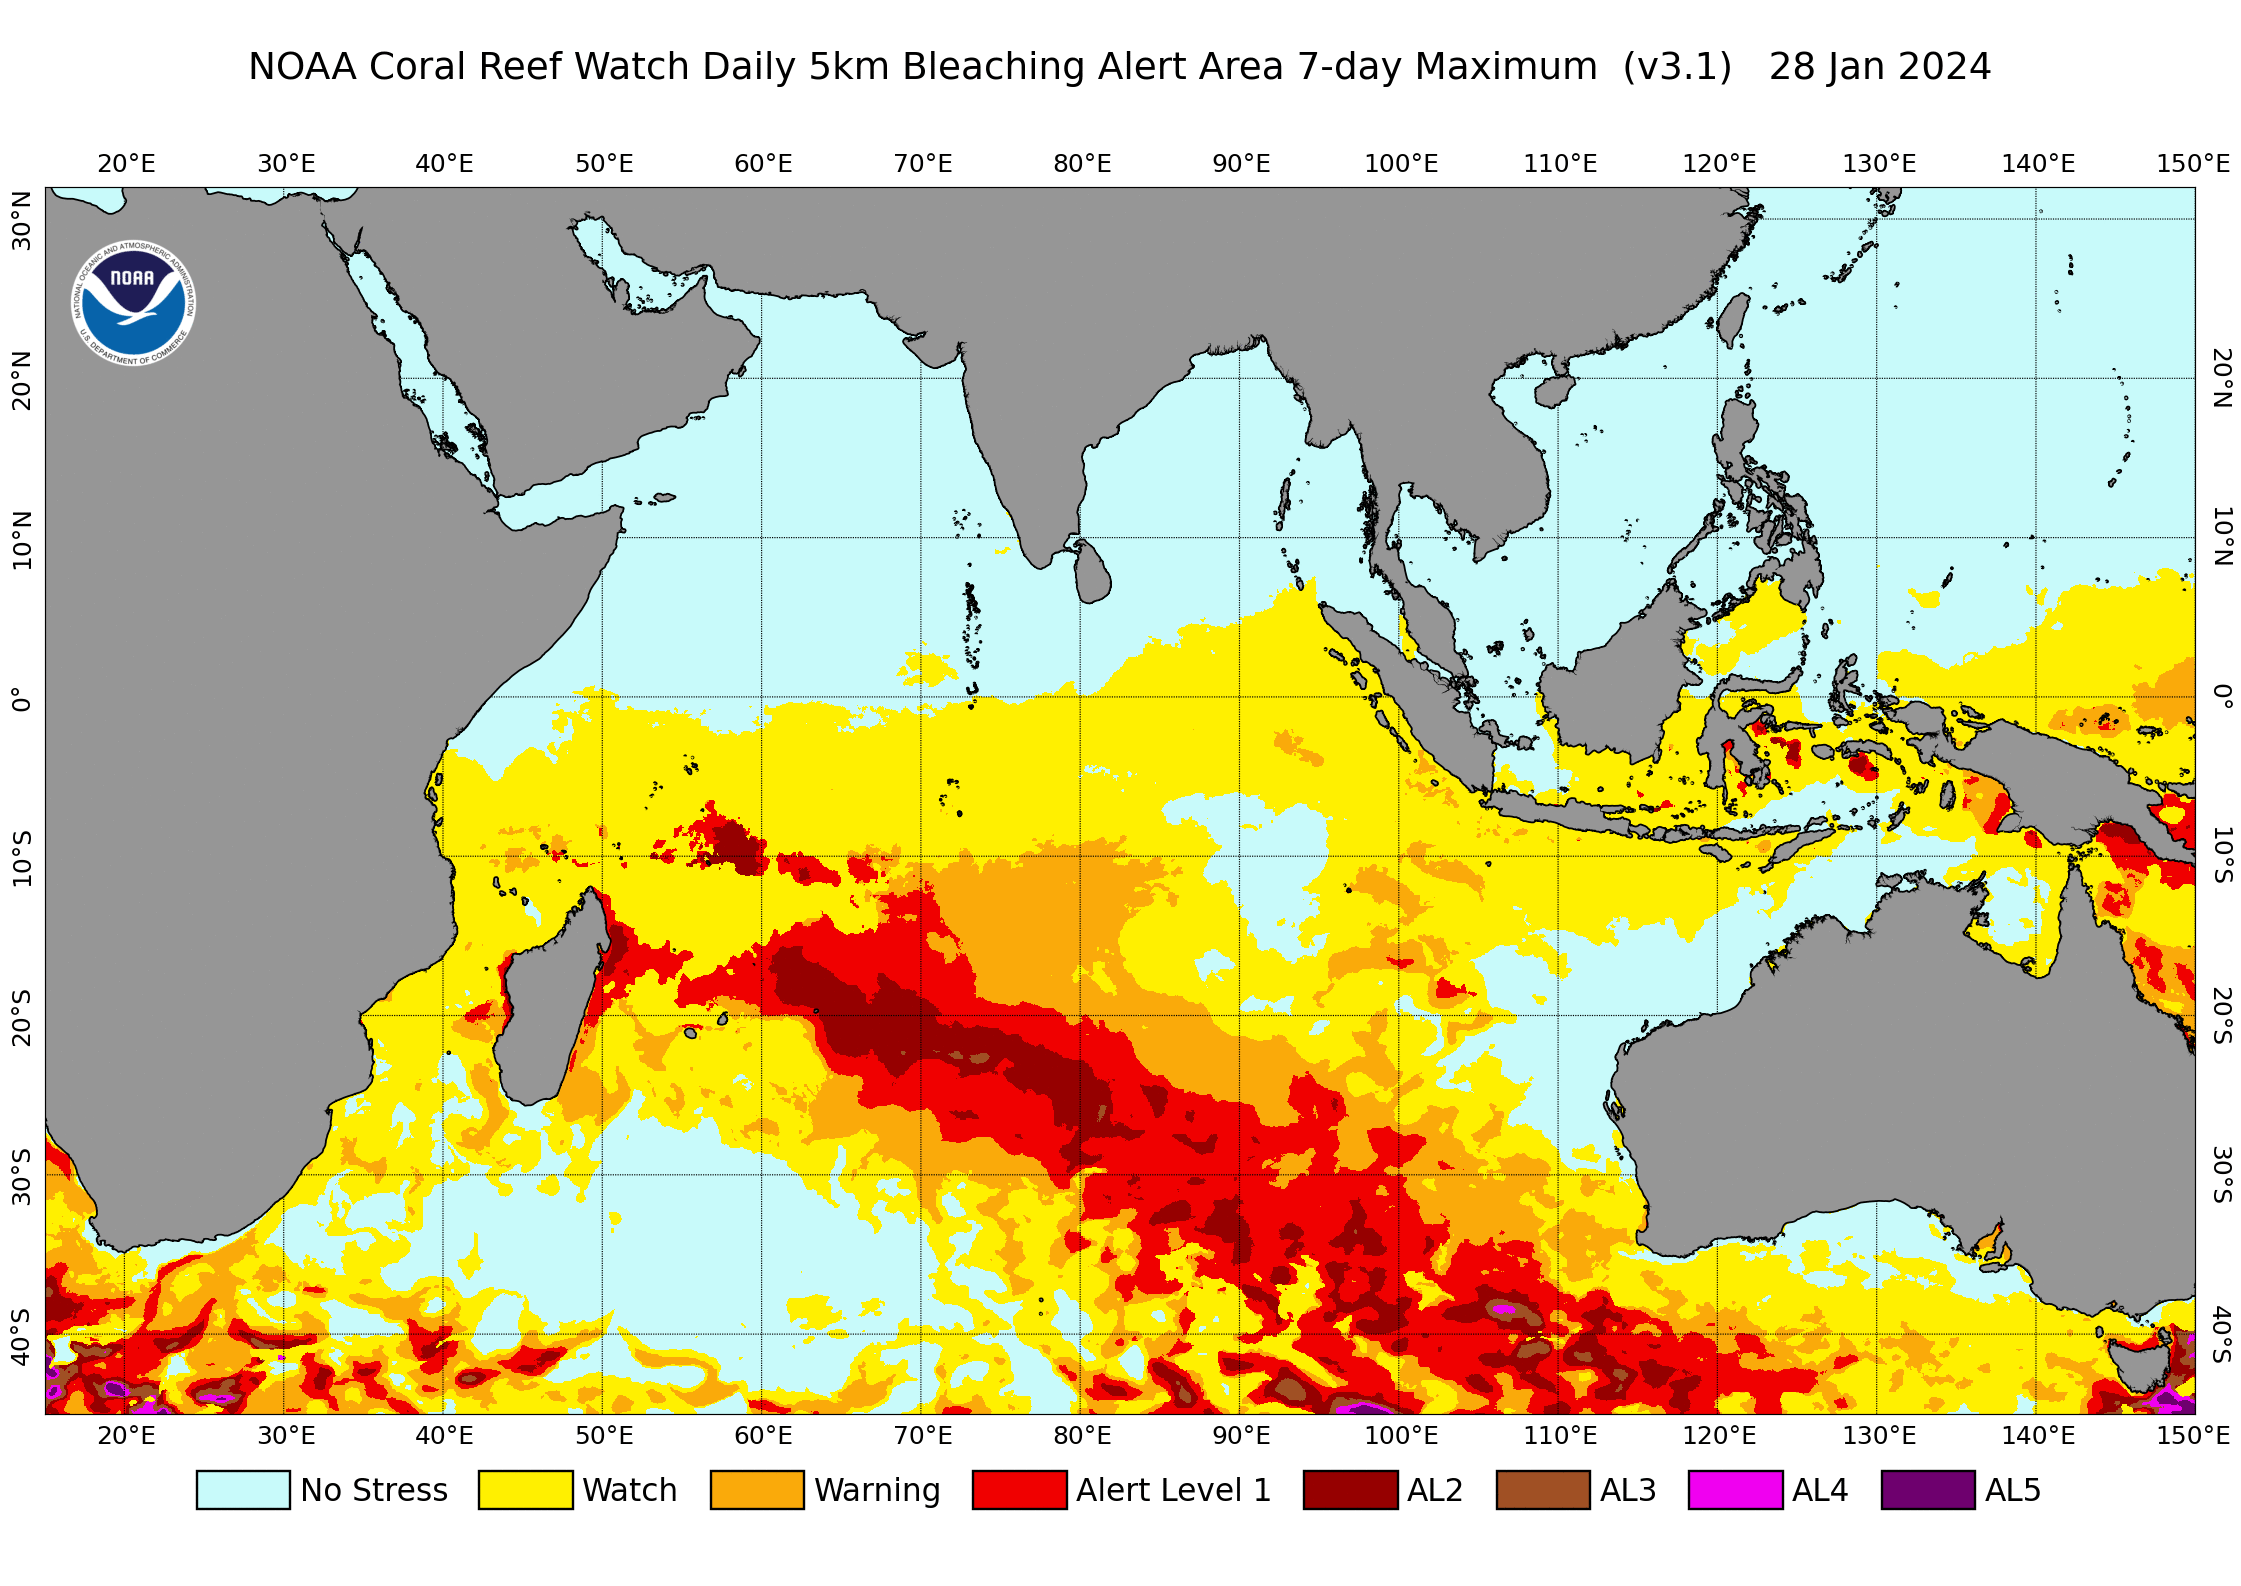
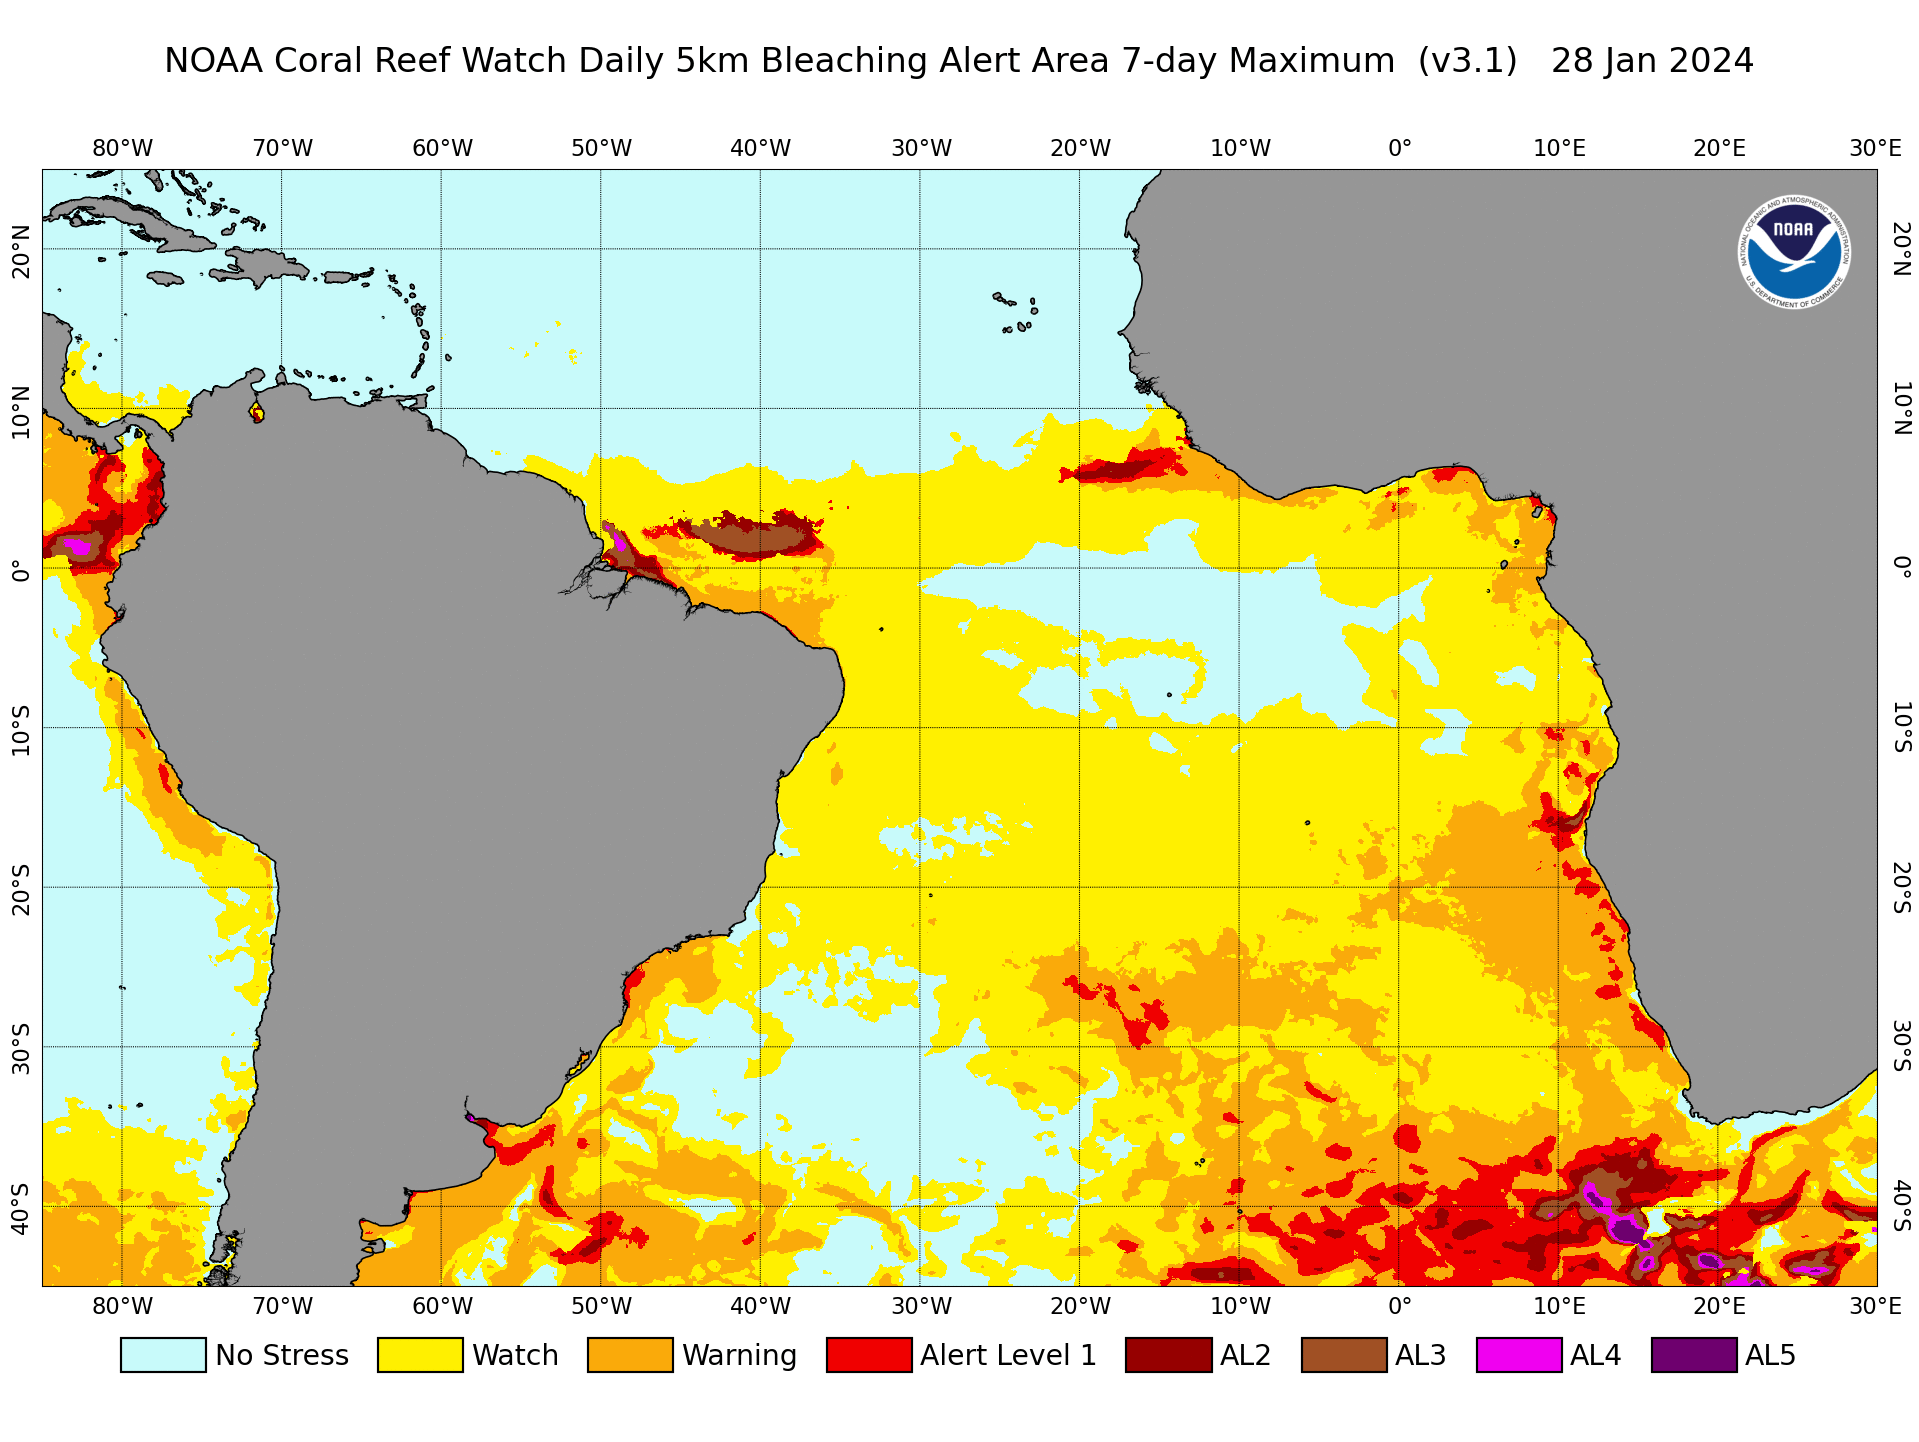
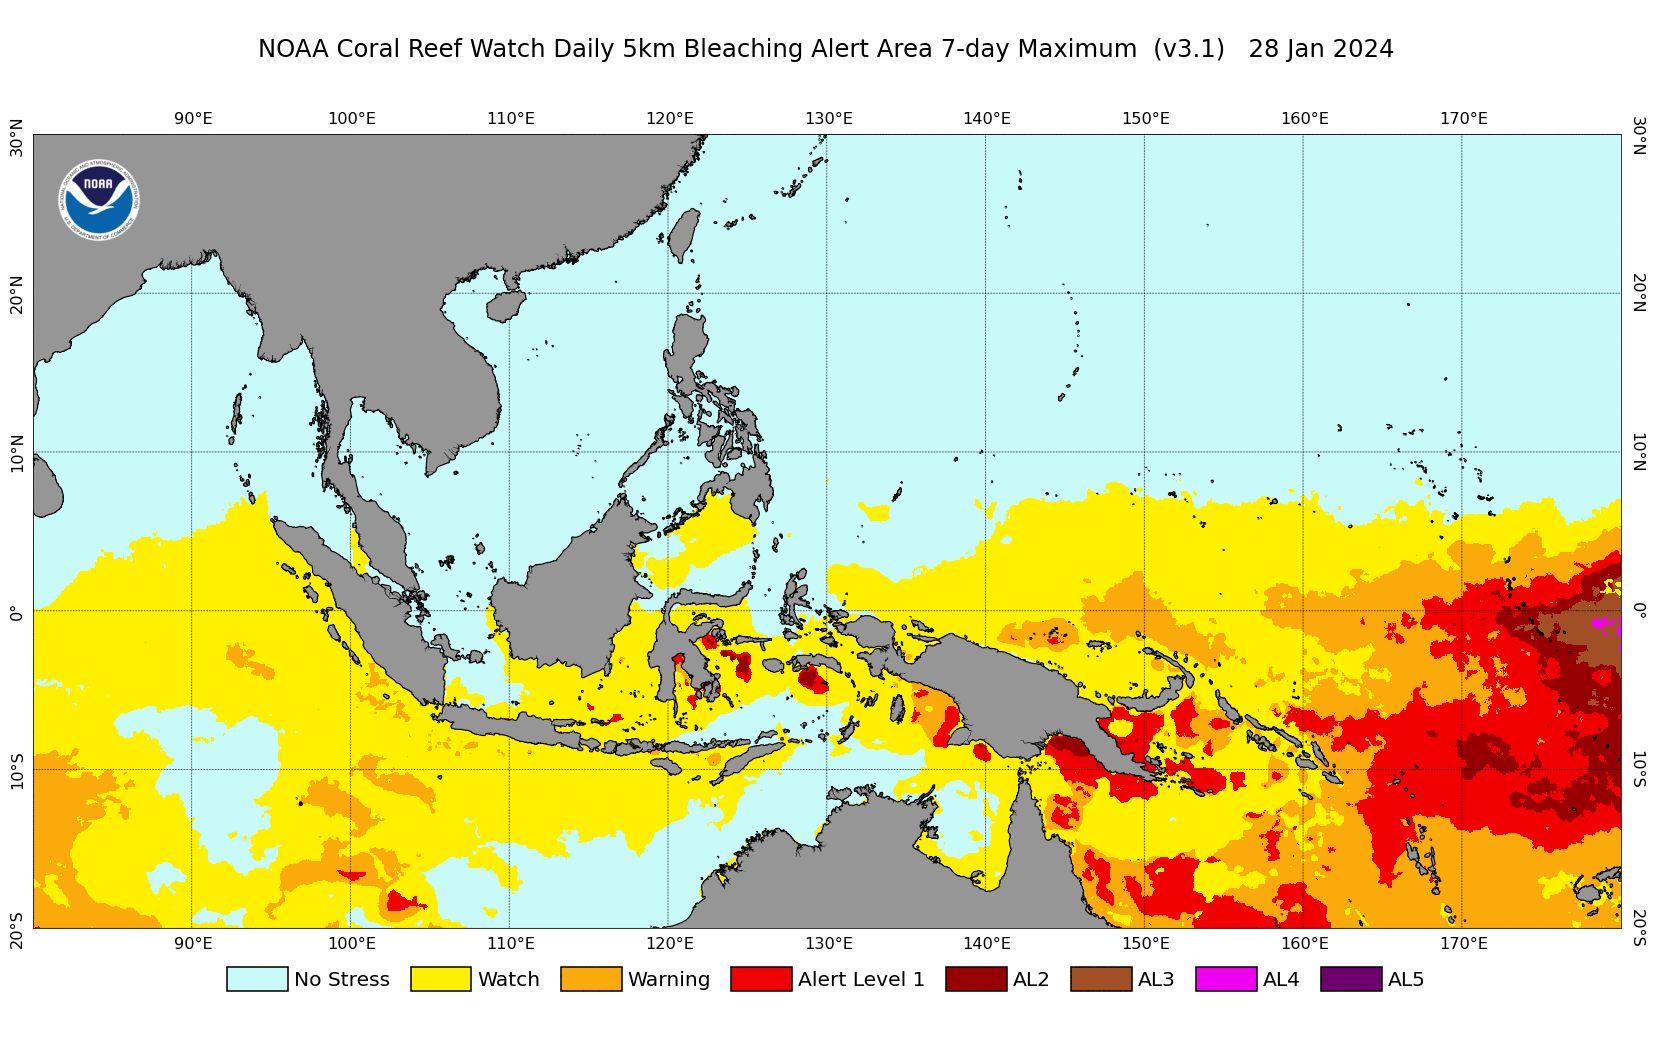
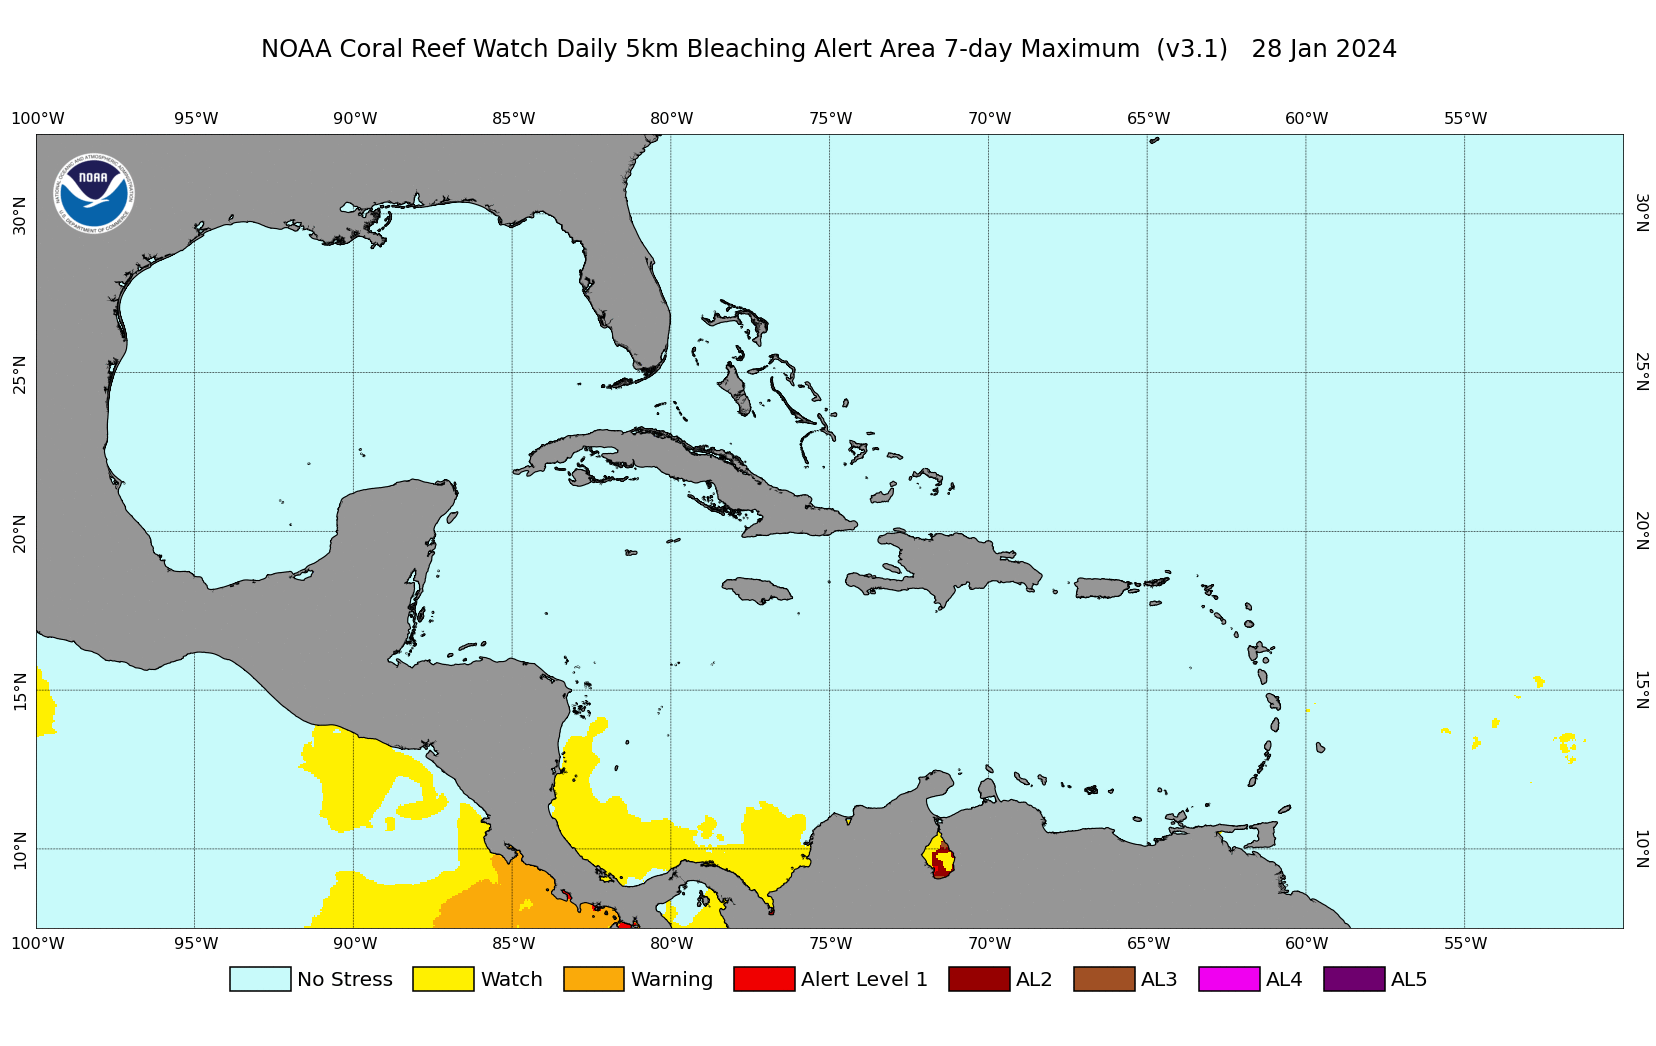
Click on map above to zoom to small 60 x 40-degree tiles; use drop-down menu below to view larger 60 x 40-degree tiles.
Right-click outside clickable map area to save the image.
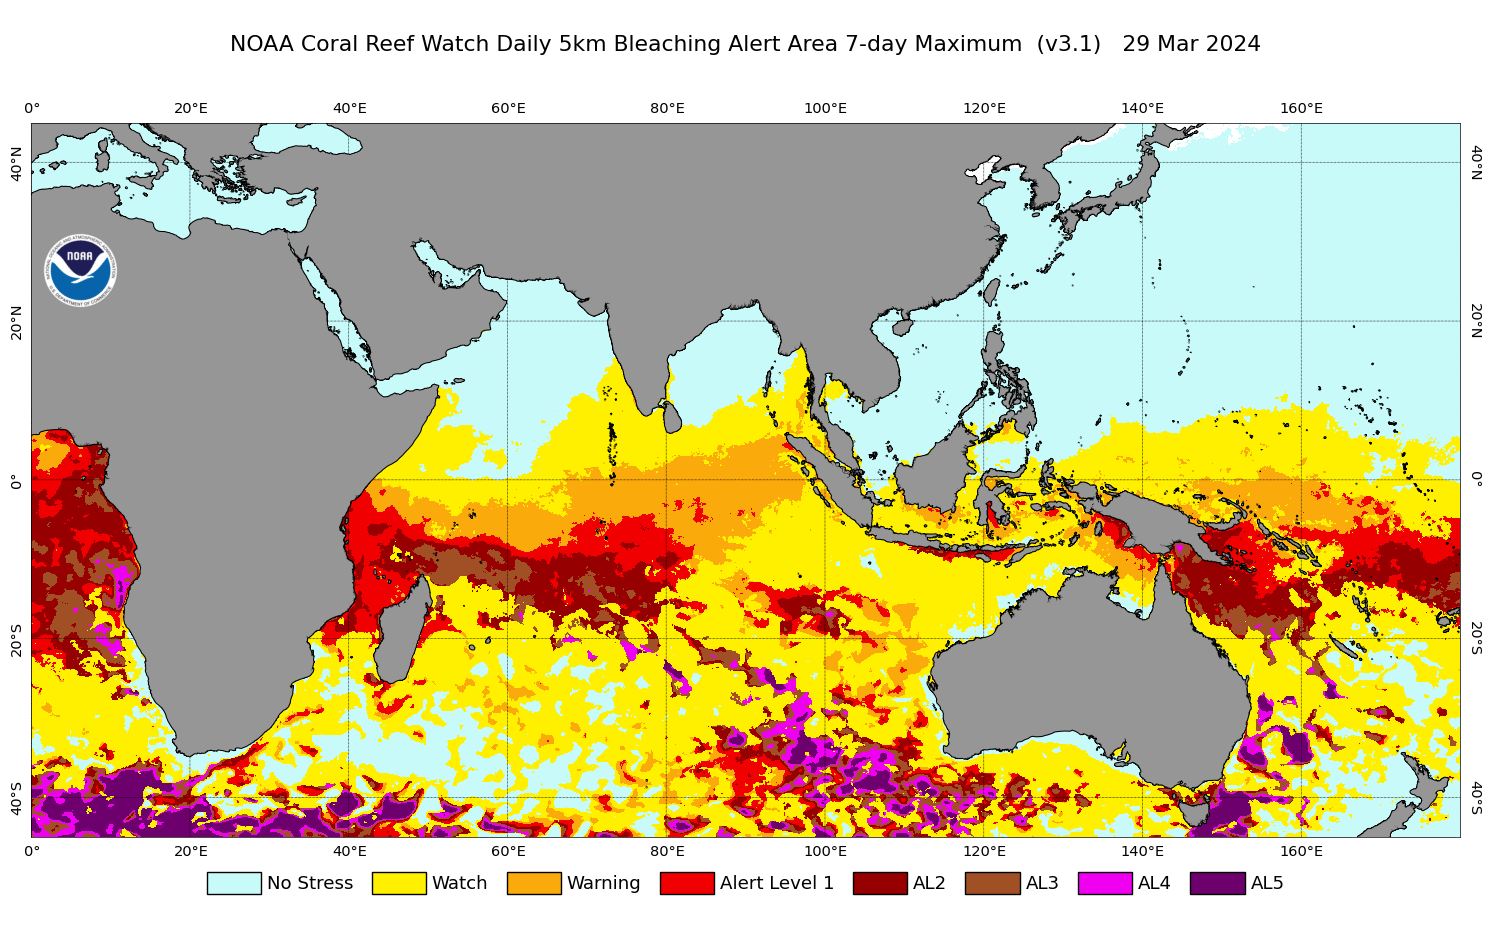
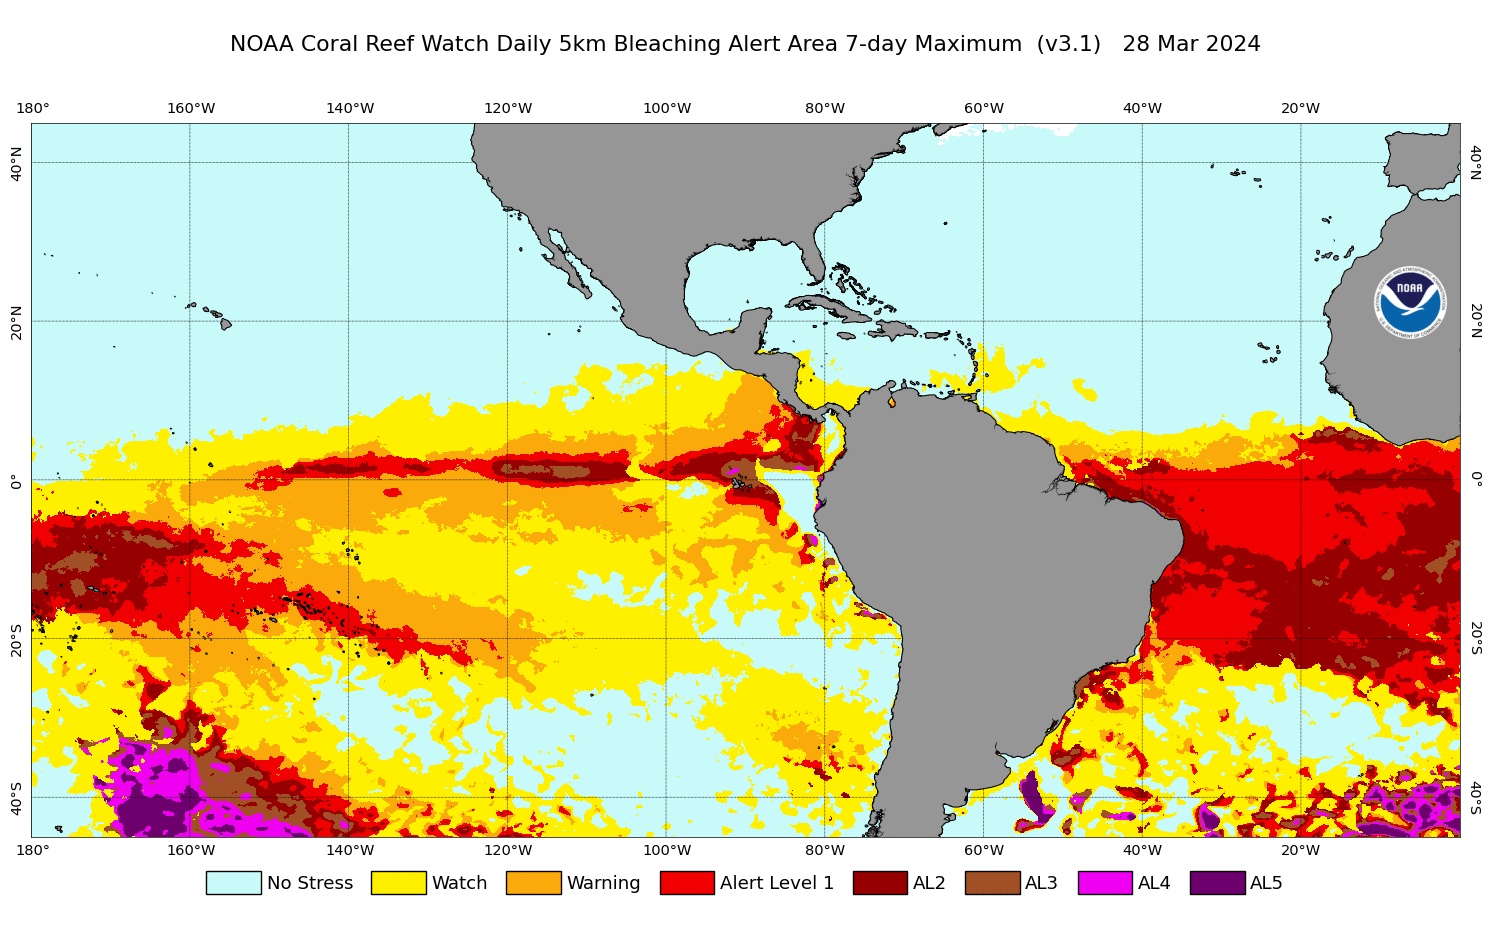
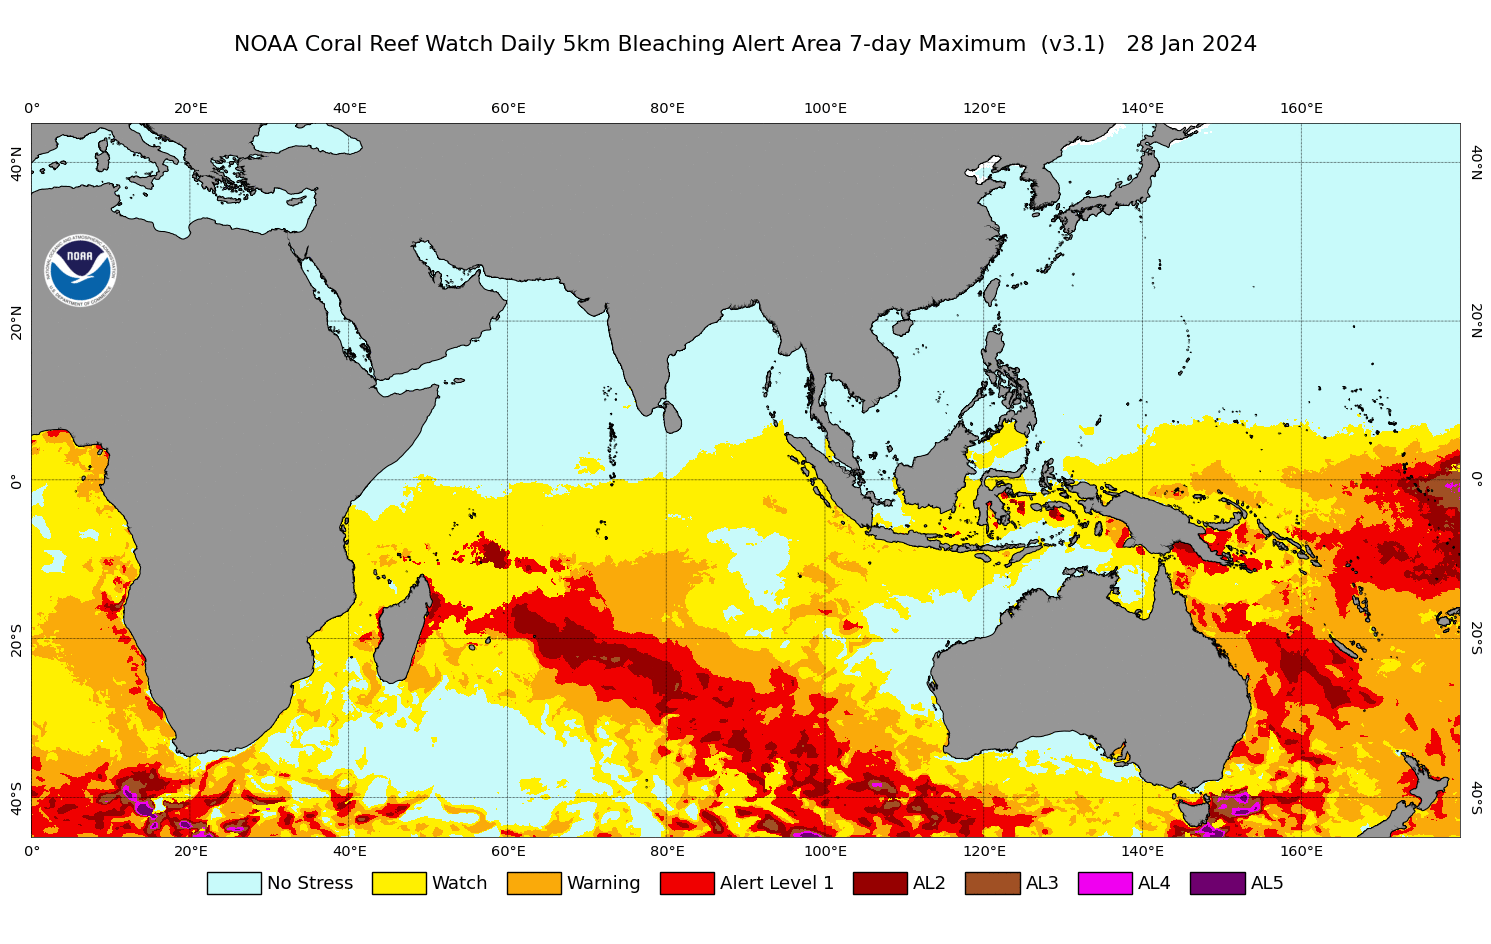
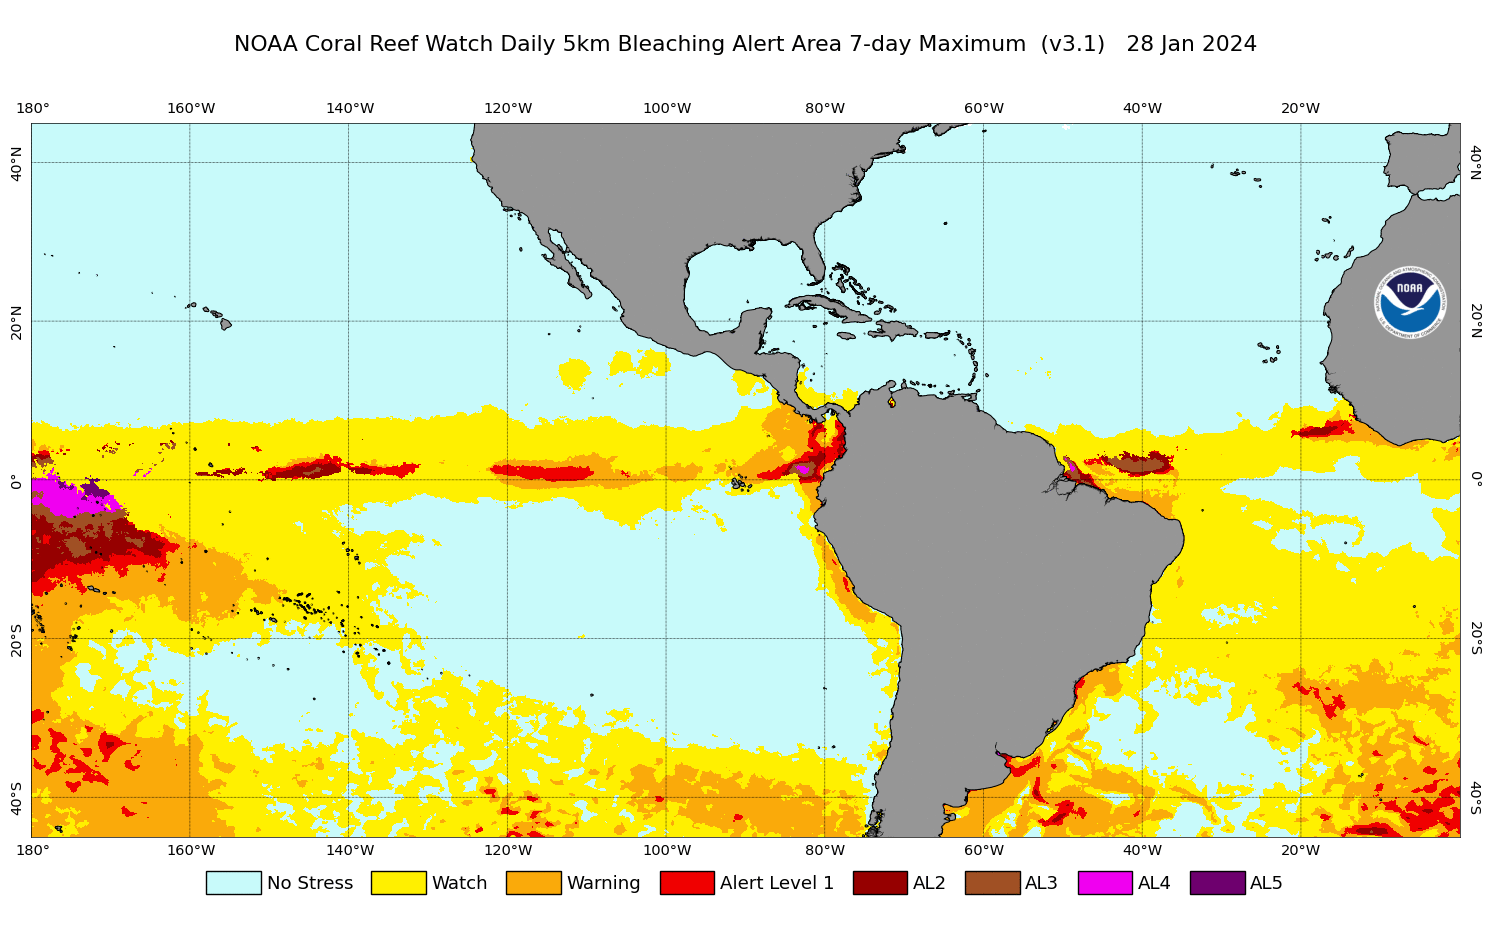
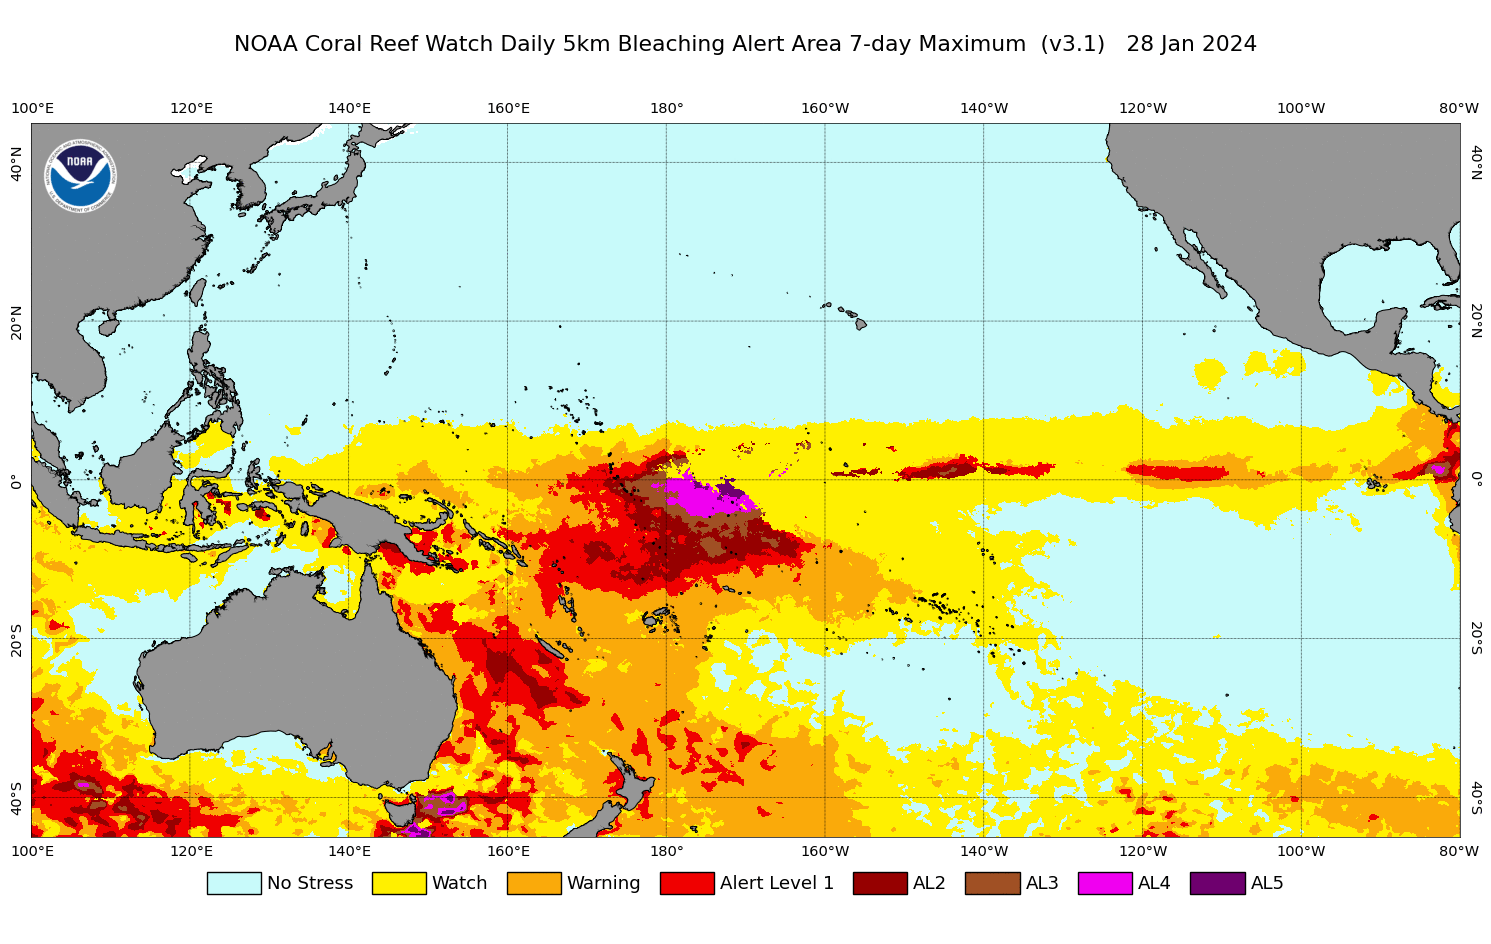
60 x 40-degree tiles (by east/west hemispheres and low/high latitudes, updated daily)
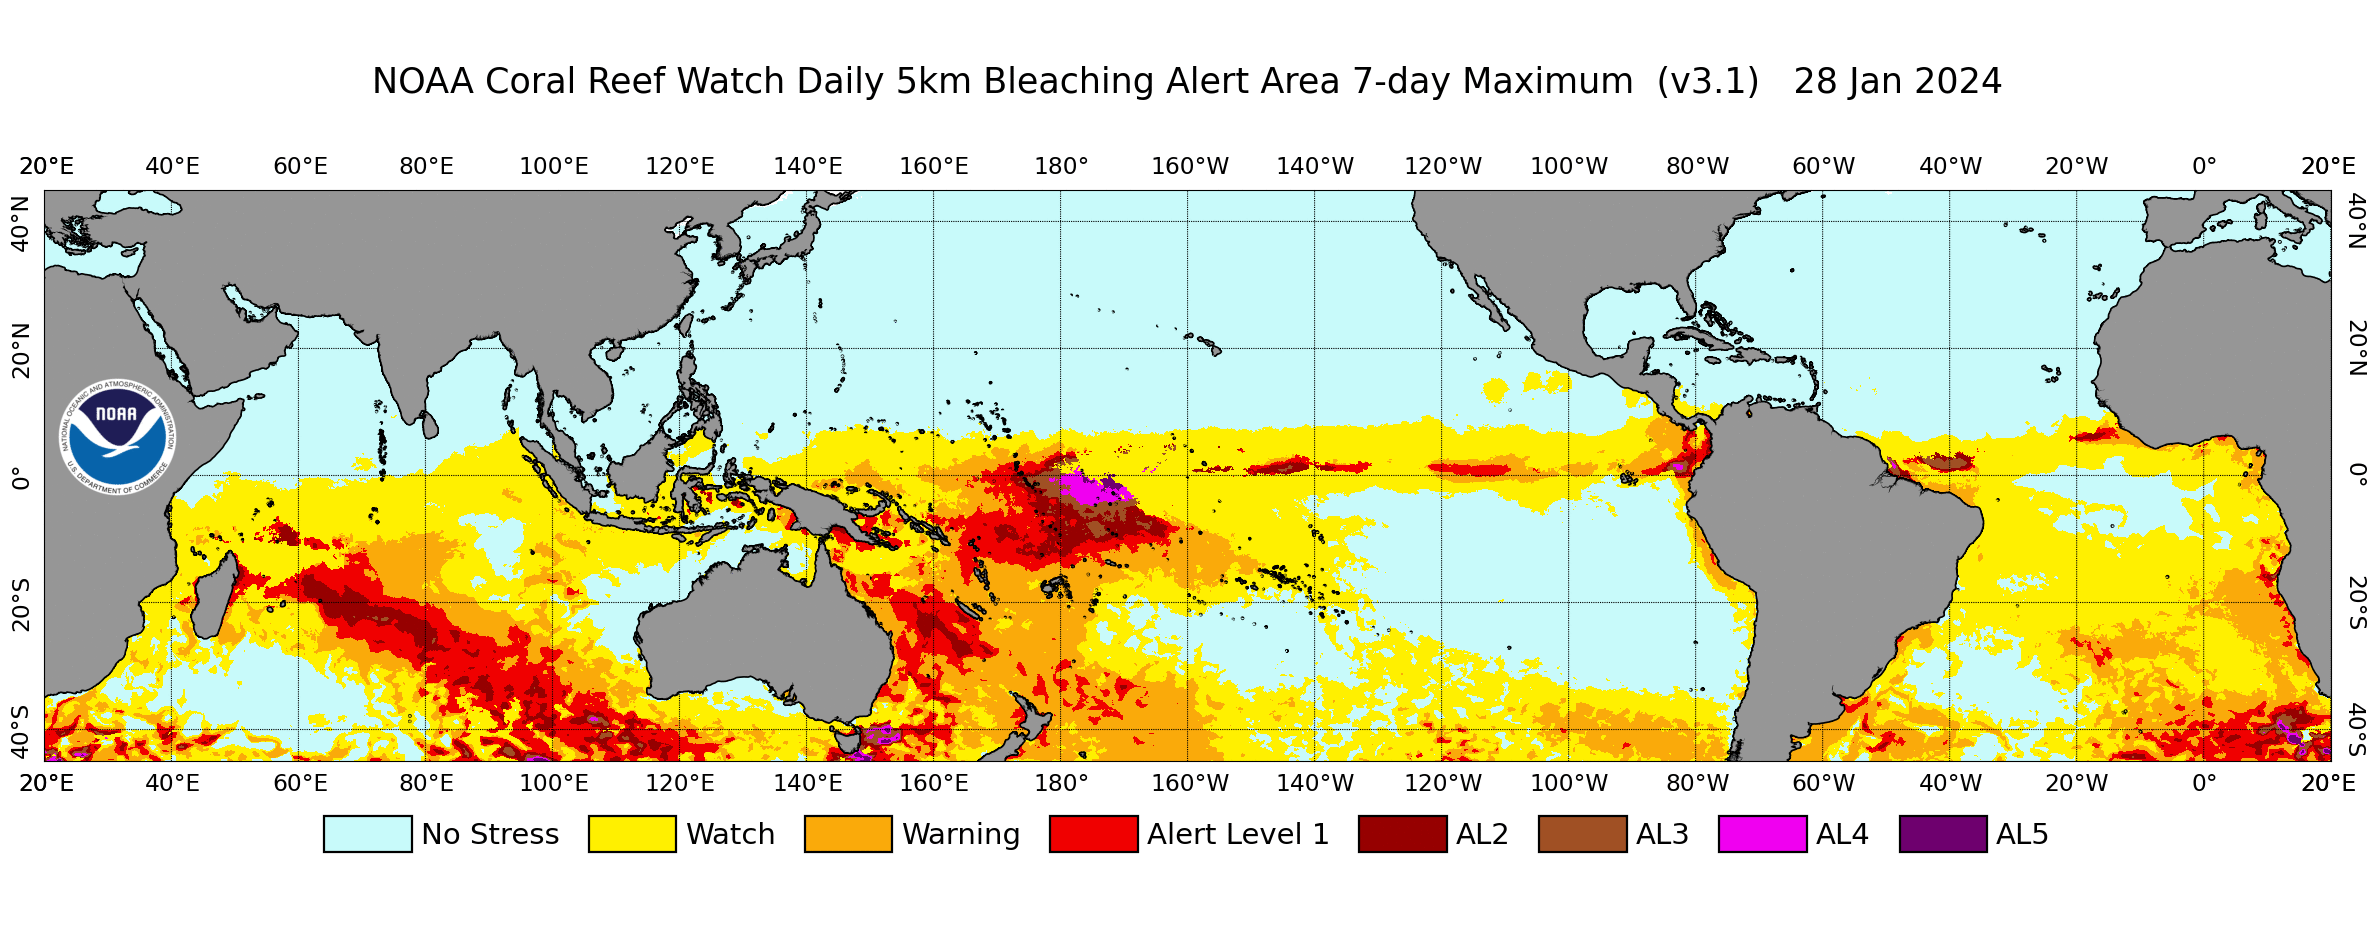
This product is updated each afternoon at about 13:30 U.S. Eastern Time.