


5 km Regional Bleaching Heat Stress Maps and Gauges (Version 3.1)
NOTE: Alerts displayed on individual Regional Virtual Station (RVS) and Single-Pixel Virtual Station pages still use the heritage bleaching alert level system (which extended to Bleaching Alert Level 2). We are currently updating these systems to reflect the modified bleaching alert levels (now extending to Bleaching Alert Level 5). Until this update is complete, when a Station displays Alert Level 2, we suggest that users consult the Time Series data file that is linked directly below or to the right of the two-year time-series graph. This data file displays the underlying Coral Bleaching HotSpot and Degree Heating Week (DHW) values, from which a user can determine, on any day, what the new, corresponding Bleaching Alert Level should be, if higher than Alert Level 2.
| Product: |
| Year: | | | Month: | | | Day: | | |
Current Bleaching Alert Level | 4-Week Outlook | 8-Week Outlook | 12-Week Outlook | Composite
Select a 2-yr range: | Multi-year graph | Time series data | Regional time series page
Heat Stress Gauge and Time Series Product Description
The purpose of these Regional Coral Bleaching Heat Stress Gauges is to provide coral reef ecosystem managers
with a comprehensive summary of current satellite-monitored and model-projected bleaching thermal stress conditions to help facilitate
timely and effective management actions pertaining to mass coral bleaching.
NOAA Coral Reef Watch (CRW) has developed a set of Heat Stress Gauges to reflect the observed and forecasted
bleaching alert level surrounding select islands or reefs. The areas chosen for monitoring are designed to match
the 5 km Regional Virtual Station boundaries outlined in black. These gauges are based on CRW's Regional Virtual Station
time series data, updated daily, and 0.5-degree Climate Forecast System (CFS)-based Four-Month
Coral Bleaching Thermal Stress Outlook, updated weekly.
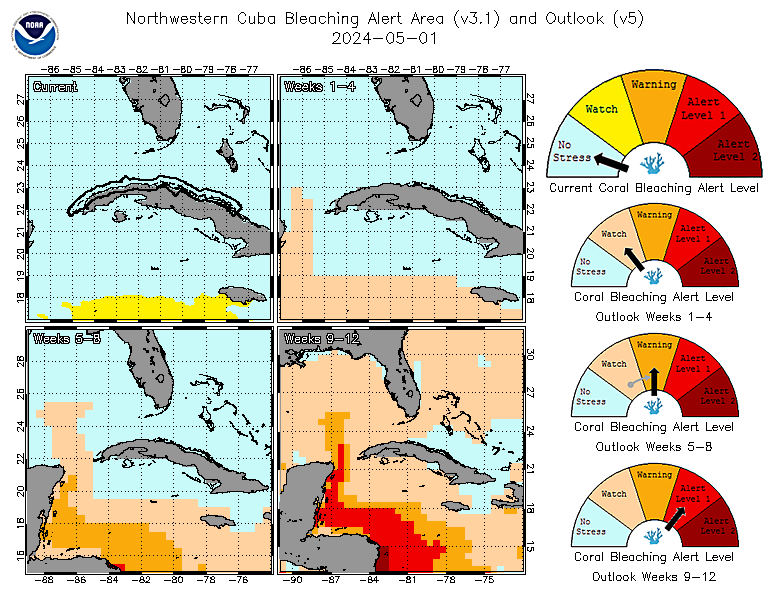
CRW provides four gauges per Virtual Station that include the current near-real-time coral bleaching thermal stress
alert level and the projected alert level for three consecutive 4-week time periods (i.e., the upcoming 1-4 weeks,
5-8 weeks, and 9-12 weeks, hereafter referred to as 4, 8, and 12 weeks, respectively). A map of the region surrounding
the island or coastline of interest accompanies the gauges. The image(s) show either the current 7-day maximum Bleaching
Alert Area, the current Four-Month Coral Bleaching Outlook for 4, 8, or 12 weeks out, or a composite of the four
depending on the user's selection. The gauge corresponding to the map is outlined in black.
Due to the regional nature of the virtual stations, the level displayed on each gauge is a derived value that is not taken from any one data point within the virtual station area.
To derive alerts, the daily 90th percentile HotSpot values within the station boundary are used to calculate new Degree Heating Week Values unique to each Regional Virtual Station.
From the 90th percentile HotSpot values and newly calculated DHW values, a new Bleaching Alert Area value can be calculated using the same
heat stress level table as the standard 5 km Bleaching Alert Area product.
The daily 90th percentile HotSpot value and unique DHW and BAA values are stored in the time series data files accessible on the all stations and products page.
This methodology keeps the Heat Stress Gauges, Time Series Graphs and Bleaching Email Alerts internally consistent and prevents a few stray warm pixels from exaggerating bleaching risk
while reflecting the greatest thermal stress impacting the reefs in the region.
The CFS-based Outlook product used is the 60% likelihood of bleaching thermal stress from the latest Four-Month
Coral Bleaching Thermal Stress Outlook. Outlook values displayed are the maximum of a composite of each corresponding 4-week
period (i.e., the maximum value from weeks 1-4, 5-8, or 9-12 of the Outlook). A small gray arrow is sometimes present on a gauge indicating
a change from the previous gauge reading upon updating. If the arrow is not present then there has been no change since the last update.
The current alert gauge and image updates daily while the outlook gauges and images update weekly.
For the current alert level, the area of interest is specified by a black outline surrounding the island(s) or known reef locations
on the map. For the 4-, 8-, and 12-week Outlooks, the area of interest is the entire extent of the corresponding map. This
increases the area used for the gauge level as one moves from the Bleaching Alert Area to the 4-, 8-, and 12-week Outlooks.
The areas covered by the 8- and 12-week Outlooks increase by 2 degrees in every direction from the previous Outlook. The
increase in area coverage as the outlook lead-time increases for the gauge calculation is designed to help coral reef managers
understand the extent of potentially approaching offshore thermal stress, with increased projection uncertainty factored in over
longer time scales. Incorporating an increase in the area at these predefined, projected, time-dependent spatial scales should
capture thermal stress events that may contribute to bleaching risk at the depicted coral reefs. In some special cases (i.e, Central
America) the extent of the outlook map may encompass two ocean basins that should not collectively be considered when determining the outlook alert.
In these cases, a dark gray mask is drawn over the basin that is excluded when calculating the outlook alert to display on the gauges.
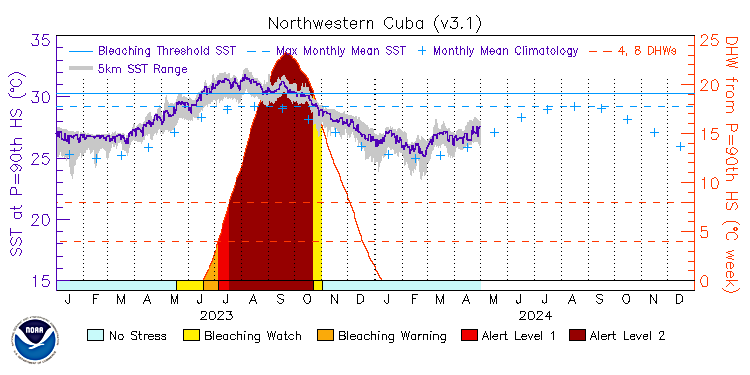
The time series graph provides a record of temperature, thermal stress, and bleaching potential and allows for comparisons between years. The SST trace shown depicts the SST value where the HotSpot value is equal to the 90th percentile HotSpot. The minimum and maximum SST range within the Regional Virtual Station boundary is shown as a light gray area behind the SST trace. Click here to access a more detailed description of the time series graphs and data.

