


5 km Multi-Factor Coral Disease Risk Maps (Version 1.0)
Back to Region Selection Page
|
|
|
|
Multi-Factor Coral Disease Risk Maps and Time Series Product Description
Description
The regional Multi-Factor Coral Disease Risk Product summarizes model-predicted disease risk for the U.S. and select international coral reefs
in the Pacific Ocean, based on a combination of environmental factors. These predictions help resource managers, in-water monitoring networks,
and other stakeholders quickly prepare for and respond to outbreaks of coral disease.
Disease types
The Multi-Factor Coral Disease Risk product focuses on two types of coral diseases: growth anomalies and white syndromes. Growth anomalies are chronic,
protuberant masses of coral skeletons (i.e., tumors) that reduce growth, fecundity, and survival. White syndromes are characterized by progressive tissue
loss across the coral colony with lesions progressing slowly (chronic to subacute) or rapidly (acute).
Nowcasts and Forecasts
Disease risk is predicted at four time points: current (Nowcasts), and 4-, 8-, and 12-weeks in the future (Forecasts), based on time-dependent satellite
temperature and turbidity measurements and predicted temperatures, in combination with other time-invariant conditions. The disease risk models include
several temperature-based metrics reflecting the effects of thermal stress on disease progression and/or transmission. Nowcast temperature metrics are
calculated using near real-time sea surface temperature (SST) measurements from a blend of geostationary and polar-orbiting satellite observations, whereas
Forecasts are calculated using modeled temperature values from NOAA's operational Climate Forecast System version 2 (CFSv2).
As a result, the Nowcast prediction is based on a single model run, whereas Forecasts are based on 28 model runs, each using a different CFSv2
ensemble member SST forecast. CFSv2 forecasts are produced at 50km resolution and have been downscaled to match the 5km grid for this product. Nowcasts and
Forecasts are updated weekly, usually on Monday afternoon (U.S. Eastern Time).
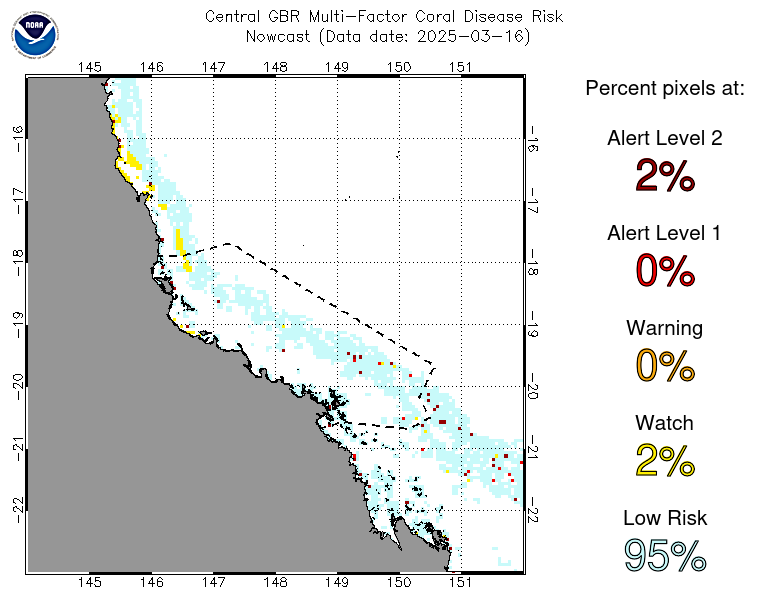
Maps
Maps visualize the spatial distribution of disease risk by displaying the highest warning level across the two, widespread coral diseases for each
5km satellite pixel. Maps of Nowcasts and Forecasts are updated weekly as new forecasts are generated. A numerical summary of the total number of 5km
pixels within each warning level in the region is shown to the right of the map.
Warning levels
There are five warning levels of disease risk displayed on the maps and graphs, reflecting predicted disease severity:
Low Risk (light blue), Watch (yellow), Warning (orange), Alert Level 1 (red), and Alert Level 2 (dark red/brown).
The thresholds separating warning levels were determined based on historical disease levels and expert elicitation, and vary by disease type and region:
| Warning level | Growth anomalies GBR, Australia | Growth anomalies U.S., Pacific | White syndromes GBR, Australia | White syndromes U.S., Pacific |
|---|---|---|---|---|
| Low risk | 0-5 colonies | 0-5% | 0-1 colonies | 0-1% |
| Watch | 6-15 colonies | 6-10% | 2-5 colonies | 2-5% |
| Warning | 16-25 colonies | 11-15% | 6-10 colonies | 6-10% |
| Alert Level 1 | 26-50 colonies | 16-25% | 11-20 colonies | 11-15% |
| Alert Level 2 | >50 colonies | >25% | >20 colonies | >15% |
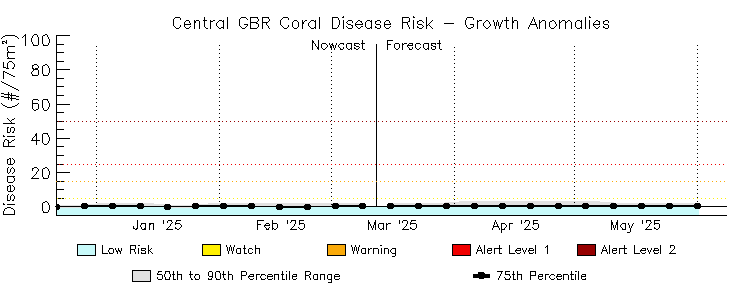
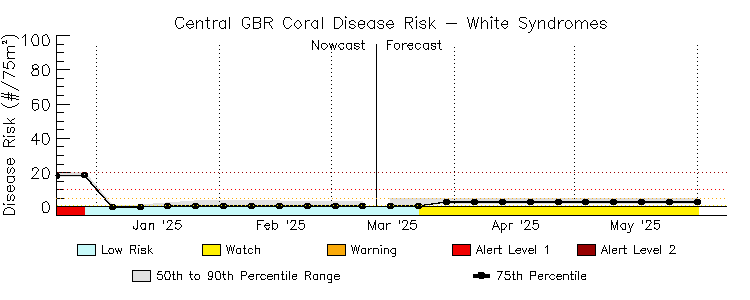
Time series graphs
Time series graphs displayed below the maps provide a record of disease-specific regional risk over a six-month moving window and are updated weekly,
concurrently with the maps. Disease risk is on the vertical axis, and month is on the horizontal axis. The graphs show the 75th percentile predicted
disease risk (black dots connected by lines) and 50th - 90th percentile range (grey shaded area); these values are aggregated for the entire region
for each disease. The warning levels are shown on the time series graphs as colored, horizontal, dotted lines. The colored, horizontal bar at the bottom
of the graphs shows the highest warning level throughout the month, and is updated weekly. The solid, black vertical line in the graphs separates the
Nowcast and Forecast periods.
Disease risk models
Disease risk predictions are estimated using quantile regression forest models. Quantile regression forests use tree-based ensemble methods to estimate conditional quantiles (i.e., a distribution of predicted disease risk). The maps and graphs only display the 75th percentile estimated disease risk. This is because it is more costly for stakeholders to miss an opportunity to intervene or study a disease event (i.e., when risk is calculated as low but an event occurs) compared with alerting users to a predicted event that does not occur (i.e., when risk is calculated as high but no event is realized). For each Forecast, there are 28 predicted disease risk distributions produced, one model run for each SST forecast produced by the CFSv2 (see above); in this case, the 90th percentile of the 28-model run 75th percentile predictions is used. For example, for a specific disease and 5km satellite pixel, if there were five model runs (instead of 28), where the 75th percentile predictions were 70, 55, 60, 64, and 72% predicted disease prevalence, then the calculated 90th percentile of those five 75th percentile predictions would be 71.2%. This approach ensures displaying high risk predictions, while safeguarding against extreme model runs.
There are separate models used for each disease and region (U.S. Pacific; Great Barrier Reef, Australia). Each model predicts disease risk based on a suite of
biotic and abiotic conditions, with the specific predictor variables used in each model (disease x region) differing slightly based on hypothesized or known
disease associations. NOAA Coral Reef Watch (CRW) generates the metrics for thermal stress (geostationary-polar-orbiting blended satellite-derived SST) and water
quality (ocean color). The ocean color metrics are derived based on location-specific, long-term and seasonal conditions.
Shiny explorer
The interactive Shiny explorer allows users to explore disease predictions. These are displayed on a
per-week and per-pixel basis and also are aggregated by different management zones. There are also pages to adjust model inputs to assess how disease predictions
would change under different environmental scenarios, and to explore the historical data used to build the models.
Educational activity
An educational activity about the Shiny explorer for the Multi-Factor Coral Disease Risk Product is available
here, with
worksheet answers available here.
The goal of this activity is to familiarize participants with use of the application and how they can tailor disease risk predictions based on knowledge of local conditions or desired management outcomes.
Acknowledgements
This experimental Multi-Factor Coral Disease Risk Product was developed by the Hawaii Institute of Marine Biology, University of Hawaii at Manoa, in close collaboration with NOAA Coral Reef Watch, James Cook University, the University of Newcastle, and the University of New South Wales, through the multi-year Fore-C project, "Forecasting coral disease outbreaks across the tropical Pacific Ocean using satellite-derived data", funded by the NASA Roses Ecological Forecasting grant NNX17AI21G.

