


(Version 3.6, released February 1, 2025)
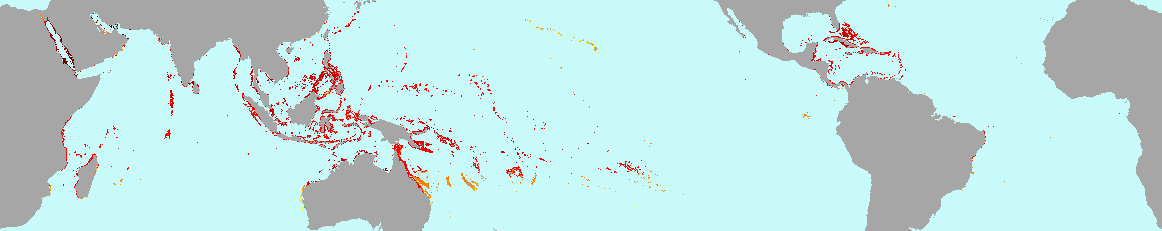
Annual Maximum SST Anomaly
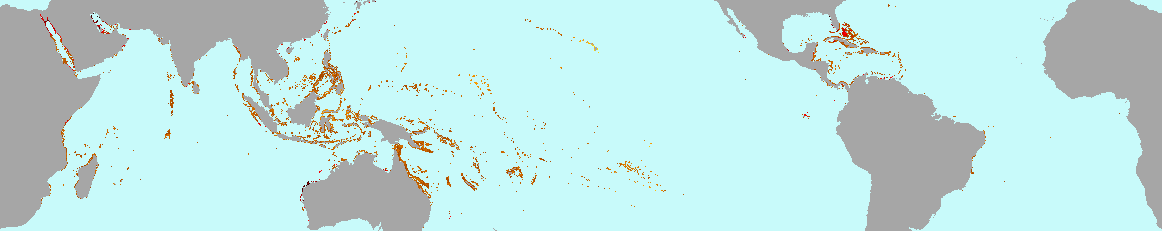
Annual Maximum Degree Heating Week (DHW)
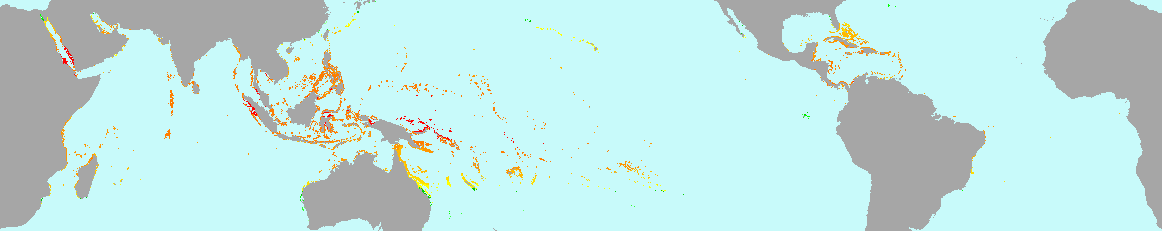
Within-year SST Average
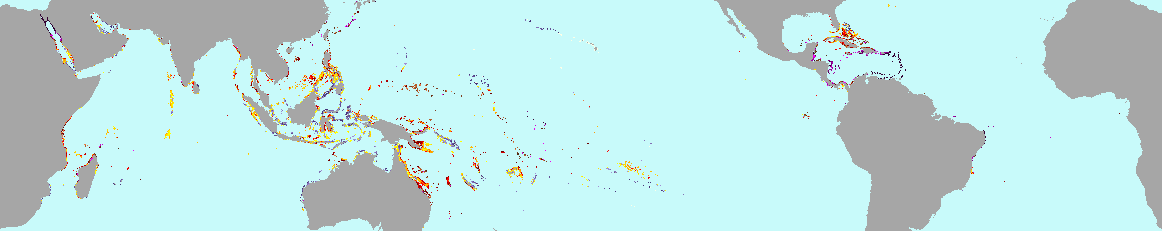
Within-year SST Variability
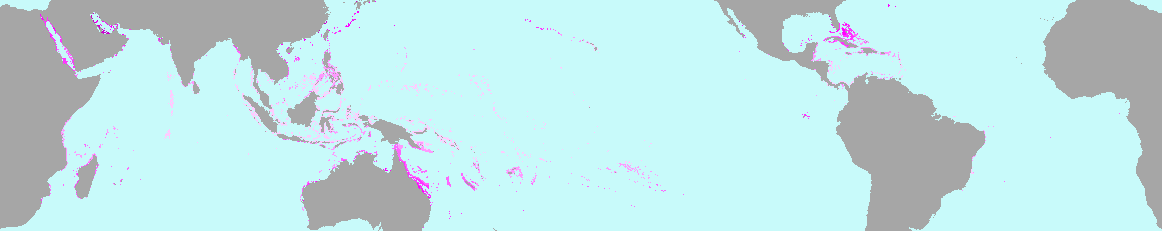
(Click on the maps to access corresponding product webpages.)
Home | Stress Frequency | Stress Onset | SST Variability | SST Trend | Climatology | Annual History
HTTPS site
Stress Frequency (421Mb) | Stress Onset (421Mb) | SST Variability (261Mb) | SST Trend (141Mb)
Climatology (621Mb) | Annual History (8.1Gb)
FTP site
Stress Frequency (421Mb) |
Stress Onset (421Mb) |
SST Variability (261Mb) |
SST Trend (141Mb)
Climatology (621Mb) |
Annual History (8.1Gb)
Web-format Metadata | XML Metadata | Plain Text Metadata
Annual History metrics: Here we provide the maximum satellite sea surface temperature (SST), SST Anomaly, and Degree Heating Week (DHW, accumulated heat stress) metrics, for each year during 1985-2024, at coral reef-containing and adjacent satellite pixel locations worldwide, using the Version 3.1 (v3.1) daily global 5km CoralTemp satellite SST data product.
Annual Maximum SST [range: 20.1-38.3°C], SST Anomaly [-0.7 to 7.4°C] and DHW [0.0-38.3°C-weeks]: For each year during 1985-2024, at each location, we provide the warmest SST, the greatest SST Anomaly (i.e., the departure from the expected SST value at each location for that time of year, as derived from the Monthly Climatology), and the highest DHW.
Within-year SST Average [16.3-31.3°C]: For this metric, we determined the average temperature for each year in the time-series (1985-2024).
Within-year SST Variability [0.17-7.09°C]: For this metric, we determined the standard deviation of temperature for each year in the time-series (1985-2024).

