|
|
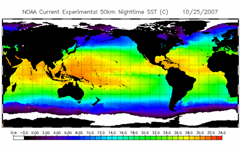
The Sea Surface Temperature (SST) product was quite straightforward: it showed the present ocean temperature around the world. Until January 31, 2016, the data for the 50km SST product came from the AVHRR instrument sensors onboard NOAA's POES. As of February 1, 2016, and until the retirement of the 50km products on April 30, 2020, the 50km SST measurement was based on NOAA's operational daily global 5km Geostationary-Polar-orbiting (Geo-Polar) Blended Nighttime-only SST Analysis. (Click here for more details.) NOAA Coral Reef Watch used only nighttime data to derive the 50km SST product, to avoid the solar heating of the near-surface skin interface during the day. Prior to its retirement in April 2020, the 50km SST product was updated in near real-time twice-weekly. The temperature scale is shown along the bottom of the image, and goes from -2 to 34 degrees Celsius. Areas covered by sea ice are colored white and land is colored black. The ice coverage is also measured from NOAA satellites. The spatial resolution of the data for the 50km SST product is one-half degree. That means that the data are shown in "pixels" (picture elements) which are approximately 50 kilometers (~30 miles) on each side. This obviously covers an area larger than most coral reefs. However, our products are designed to detect bleaching conditions in the ocean that occur at the same scale as weather patterns. Think about it this way: you can be pretty sure that the air temperature 50km away from your house will be about the same as outside your home. It is even more reliable for ocean temperatures because the SST changes more slowly than the weather. Data and images of the twice-weekly global 50km SST product are available on our website.
|
|
||||||||||||||||
|
|
||||||||||||||||||
|
IMPORTANT USER ALERT (2 July 2024): This past weekend, a storage server at NOAA's Center for Satellite Applications and Research, which delivers the NOAA Coral Reef Watch data, suffered a hardware failure. The issue is being addressed, and we hope to have the NOAA Coral Reef Watch data back up and running as soon as possible. (1) The most recent data will be made available first; historical data may take time to be restored. (2) If you need specific data that are not yet available, please contact us at coralreefwatch@noaa.gov. (3) If you use code to pull data, please revise your code to use “…/socd/…” in lieu of “…/sod/…” in all relevant web addresses for all future needs. We apologize for any inconvenience this may cause. |