


|
|
This section provides more detail about the concept of an "anomaly". If you feel comfortable with this term, please feel free to proceed to the next section. An anomaly is nothing more than the difference from a mean or average value. The example diagram below shows nine data measurements as purple stars, and the mean of the measurements is a solid blue line. 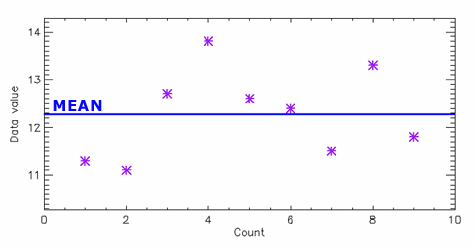
The anomaly for each data point is just the difference from the mean value. In the diagram below, the anomalies are represented by the length of the orange lines. 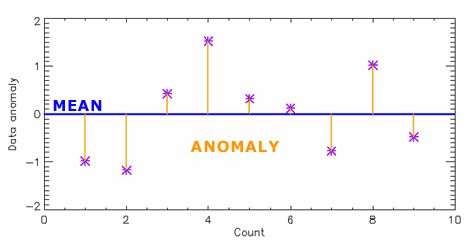
When we talk about our 50km SST Anomaly product, we are talking about the difference between a 50km SST value and the mean 50km SST for that location and that time of year. A positive anomaly means that the temperature was warmer than the mean; a negative anomaly means that the value was cooler than the mean.
|
|
|||||||||||
|
|
|||||||||||||

