


|
|
NOAA CRW's daily 5km Regional Virtual Stations represent a change in the way we have looked at Virtual Stations in the past. The Virtual Stations product was created to provide comprehensive information for a coral reef area or region. It is like having a temperature sensor in the water next to a coral reef, but data are completely based on satellite remote sensing measurements. In the heritage twice-weekly 50km Coral Bleaching Virtual Stations, each Station was based on data from a single, spatially-large satellite pixel (i.e., a data grid point), sufficient to represent a coral reef area or region. Visit the heritage 50km methodology page to learn more about the how the now-retired 50km Virtual Stations were derived. With CRW's move to our next-generation daily global 5km coral bleaching heat stress monitoring, data from a single 5km pixel provide much higher spatial detail about a reef area or region, but the spatial coverage is much smaller (i.e., at 5km). Therefore, data from any single 5km pixel may be less representative of a region's thermal conditions. As a result, we designed the daily 5km Regional Virtual Stations to take advantage of the higher-resolution data, while simultaneously providing comprehensive and collective information on all reefs in a jurisdiction or predetermined sub-region. A Regional Virtual Station includes the data from all of the 5km pixels within that individual jurisdiction (e.g., the Main Hawaiian Islands). An alert for a region is meant to inform users that they should look at the map products for more detail. For more information, visit the 5km Regional Virtual Stations product description page. We expanded the geographic network of the daily 5km Regional Virtual Stations to include all coral reefs around the world, based on available references. We separated reef areas into 219 Stations (with 5 duplicated Stations in overlapping regions). These cover most coral reef regions globally, and follow country boundaries and island nation groups, where possible, while keeping the number of Stations manageable. As a result, the size of each Regional Virtual Station varies greatly, but the methodology for calculating alerts within each region is consistent across all Stations. Data for the Regional Virtual Stations are produced from the 5km coral reef pixels within each Station plus all 5km pixels within a 20km buffer (outlined in each Regional Virtual Station map). The number of selected 5km pixels ranges from hundreds to thousands among the different Stations.
To create a 5km Regional Virtual Station, we start with known coral reef locations around the world.
(The underlying data shown here are from the
Global Distribution of Coral Reefs 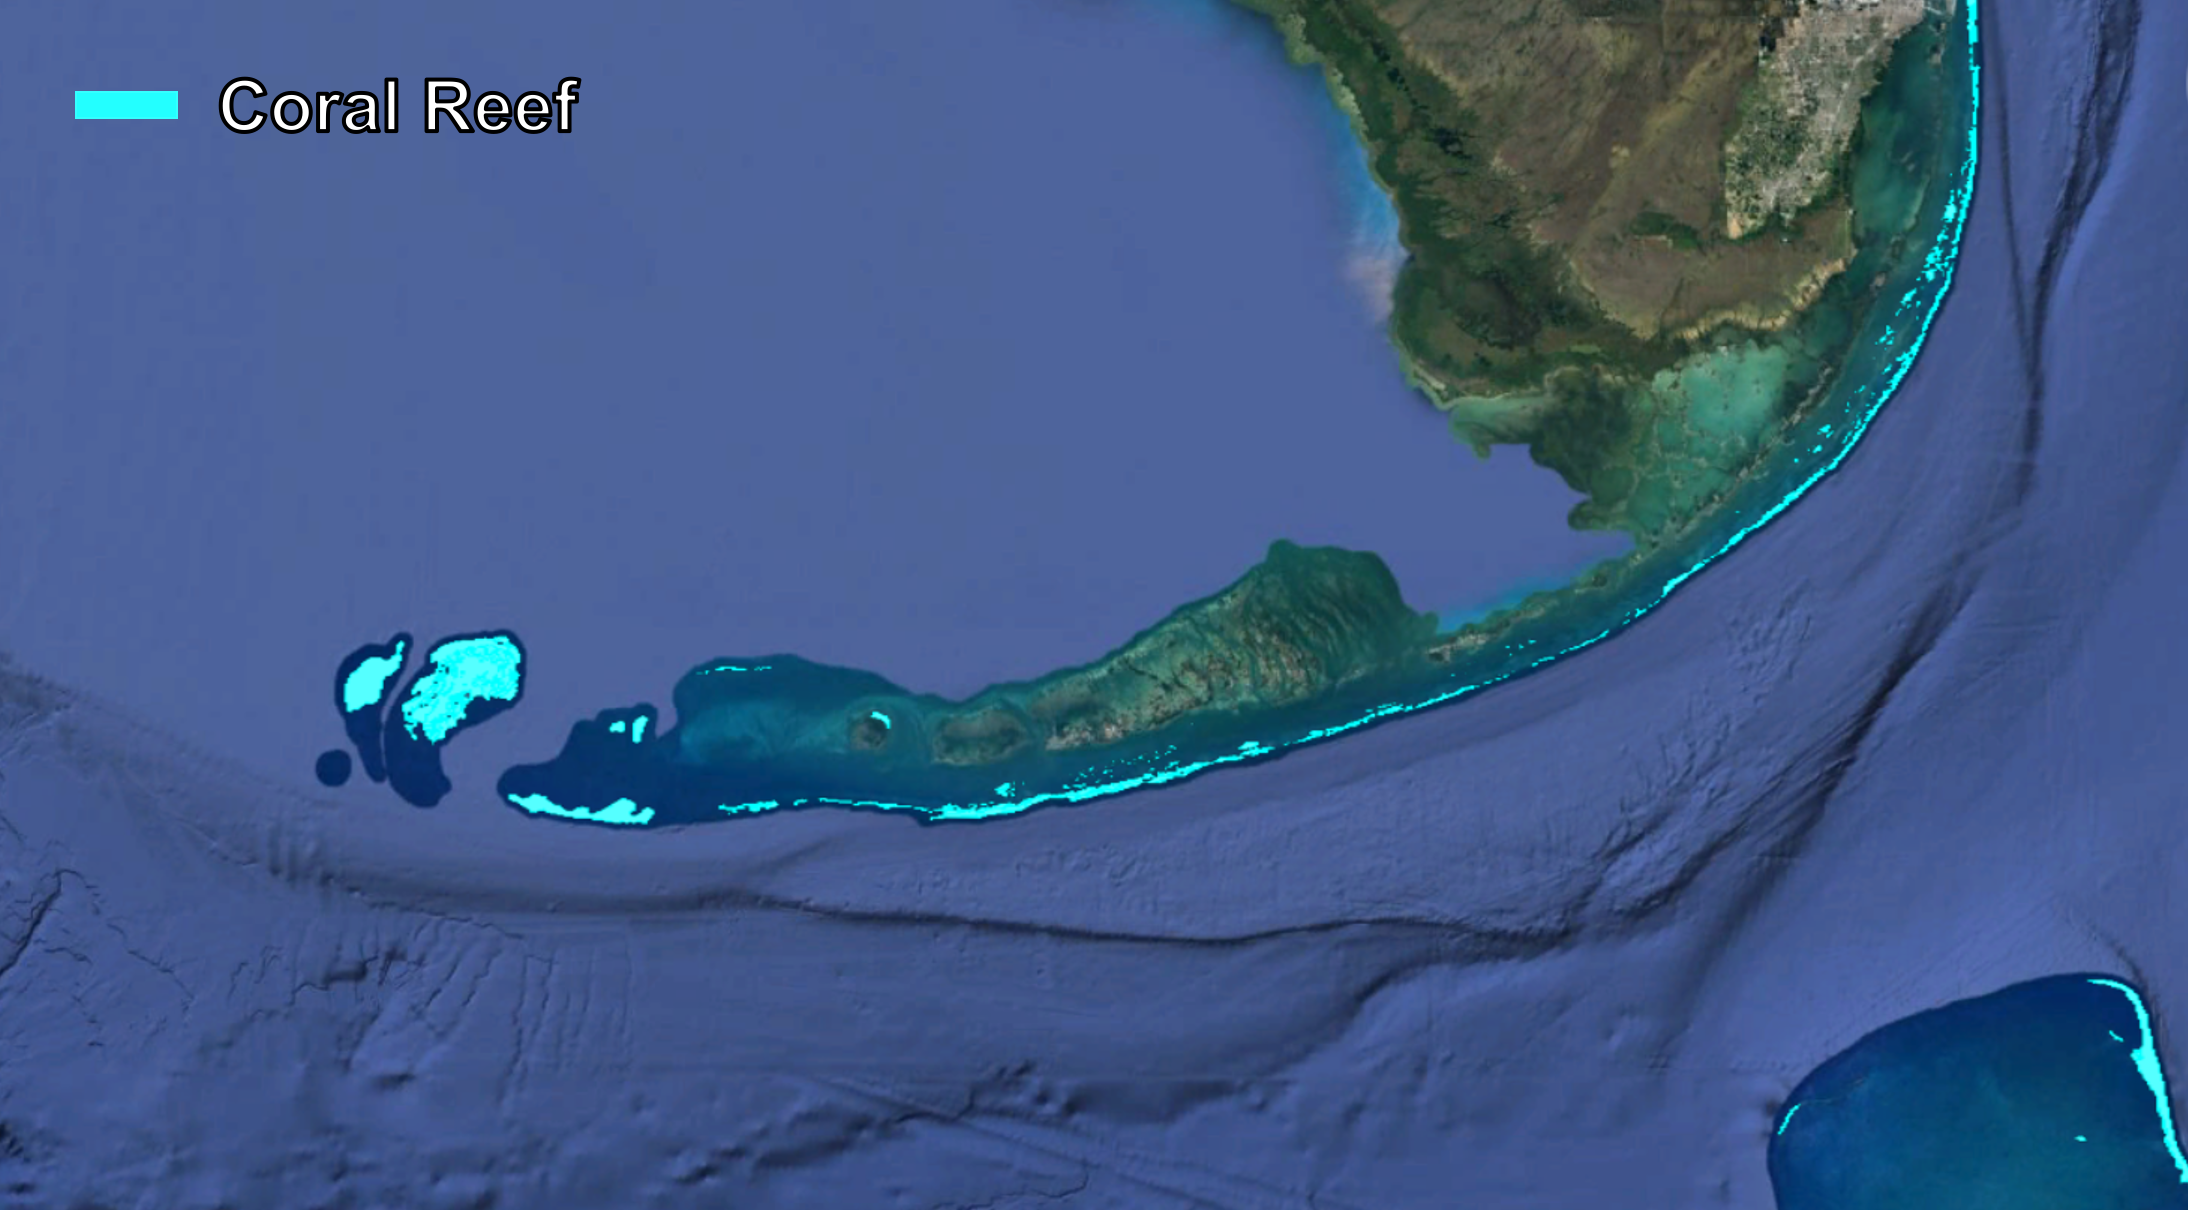
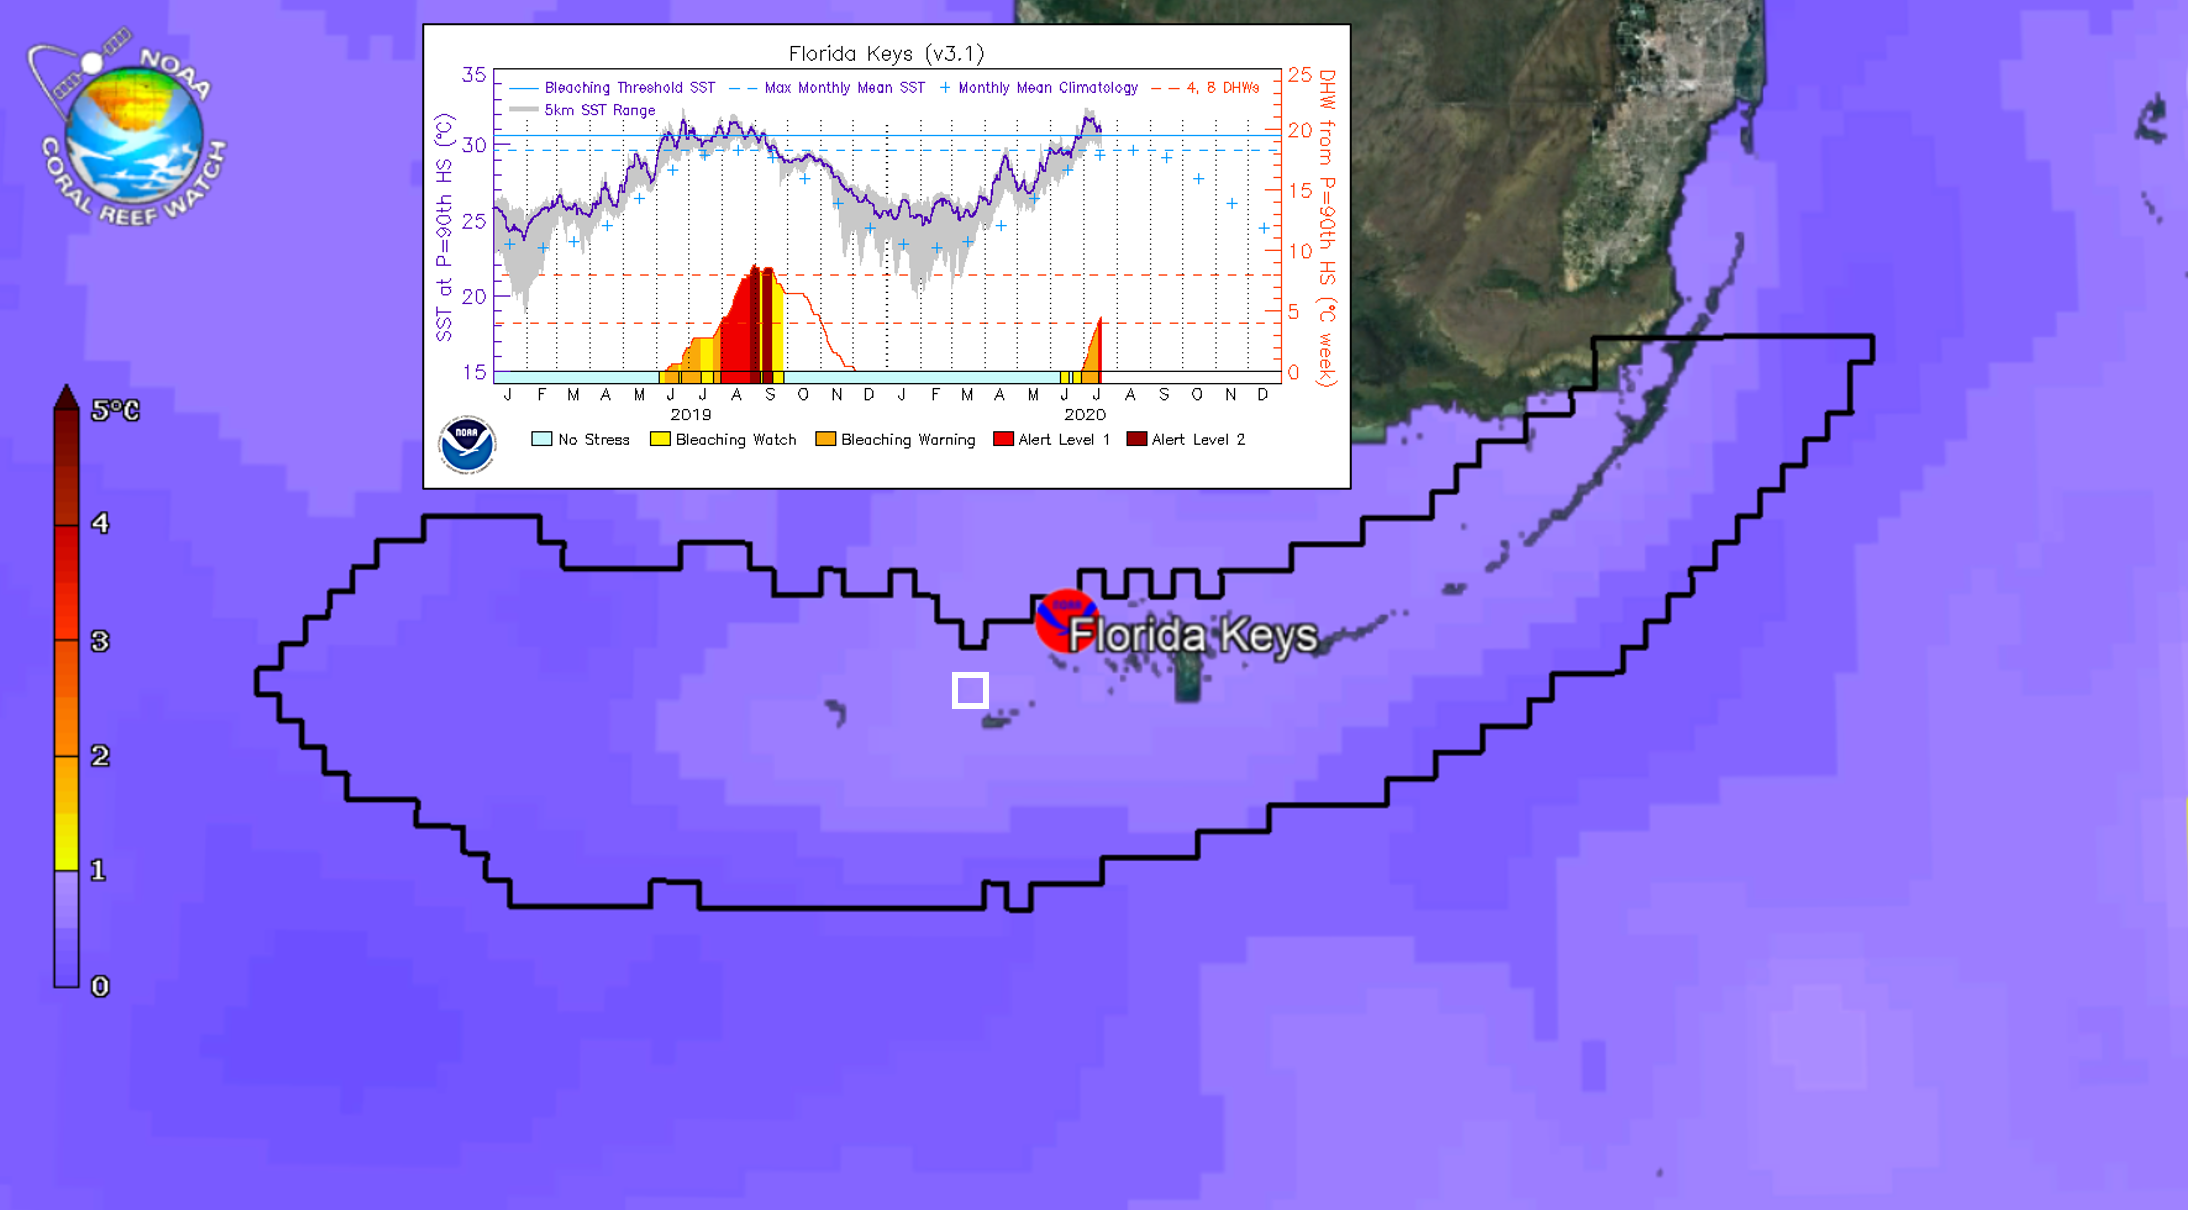
We then match these data to Coral Reef Watch's 5km satellite grid. Shown here, in white, are the resulting coral reef pixels for an example location (Florida Keys, U.S.). 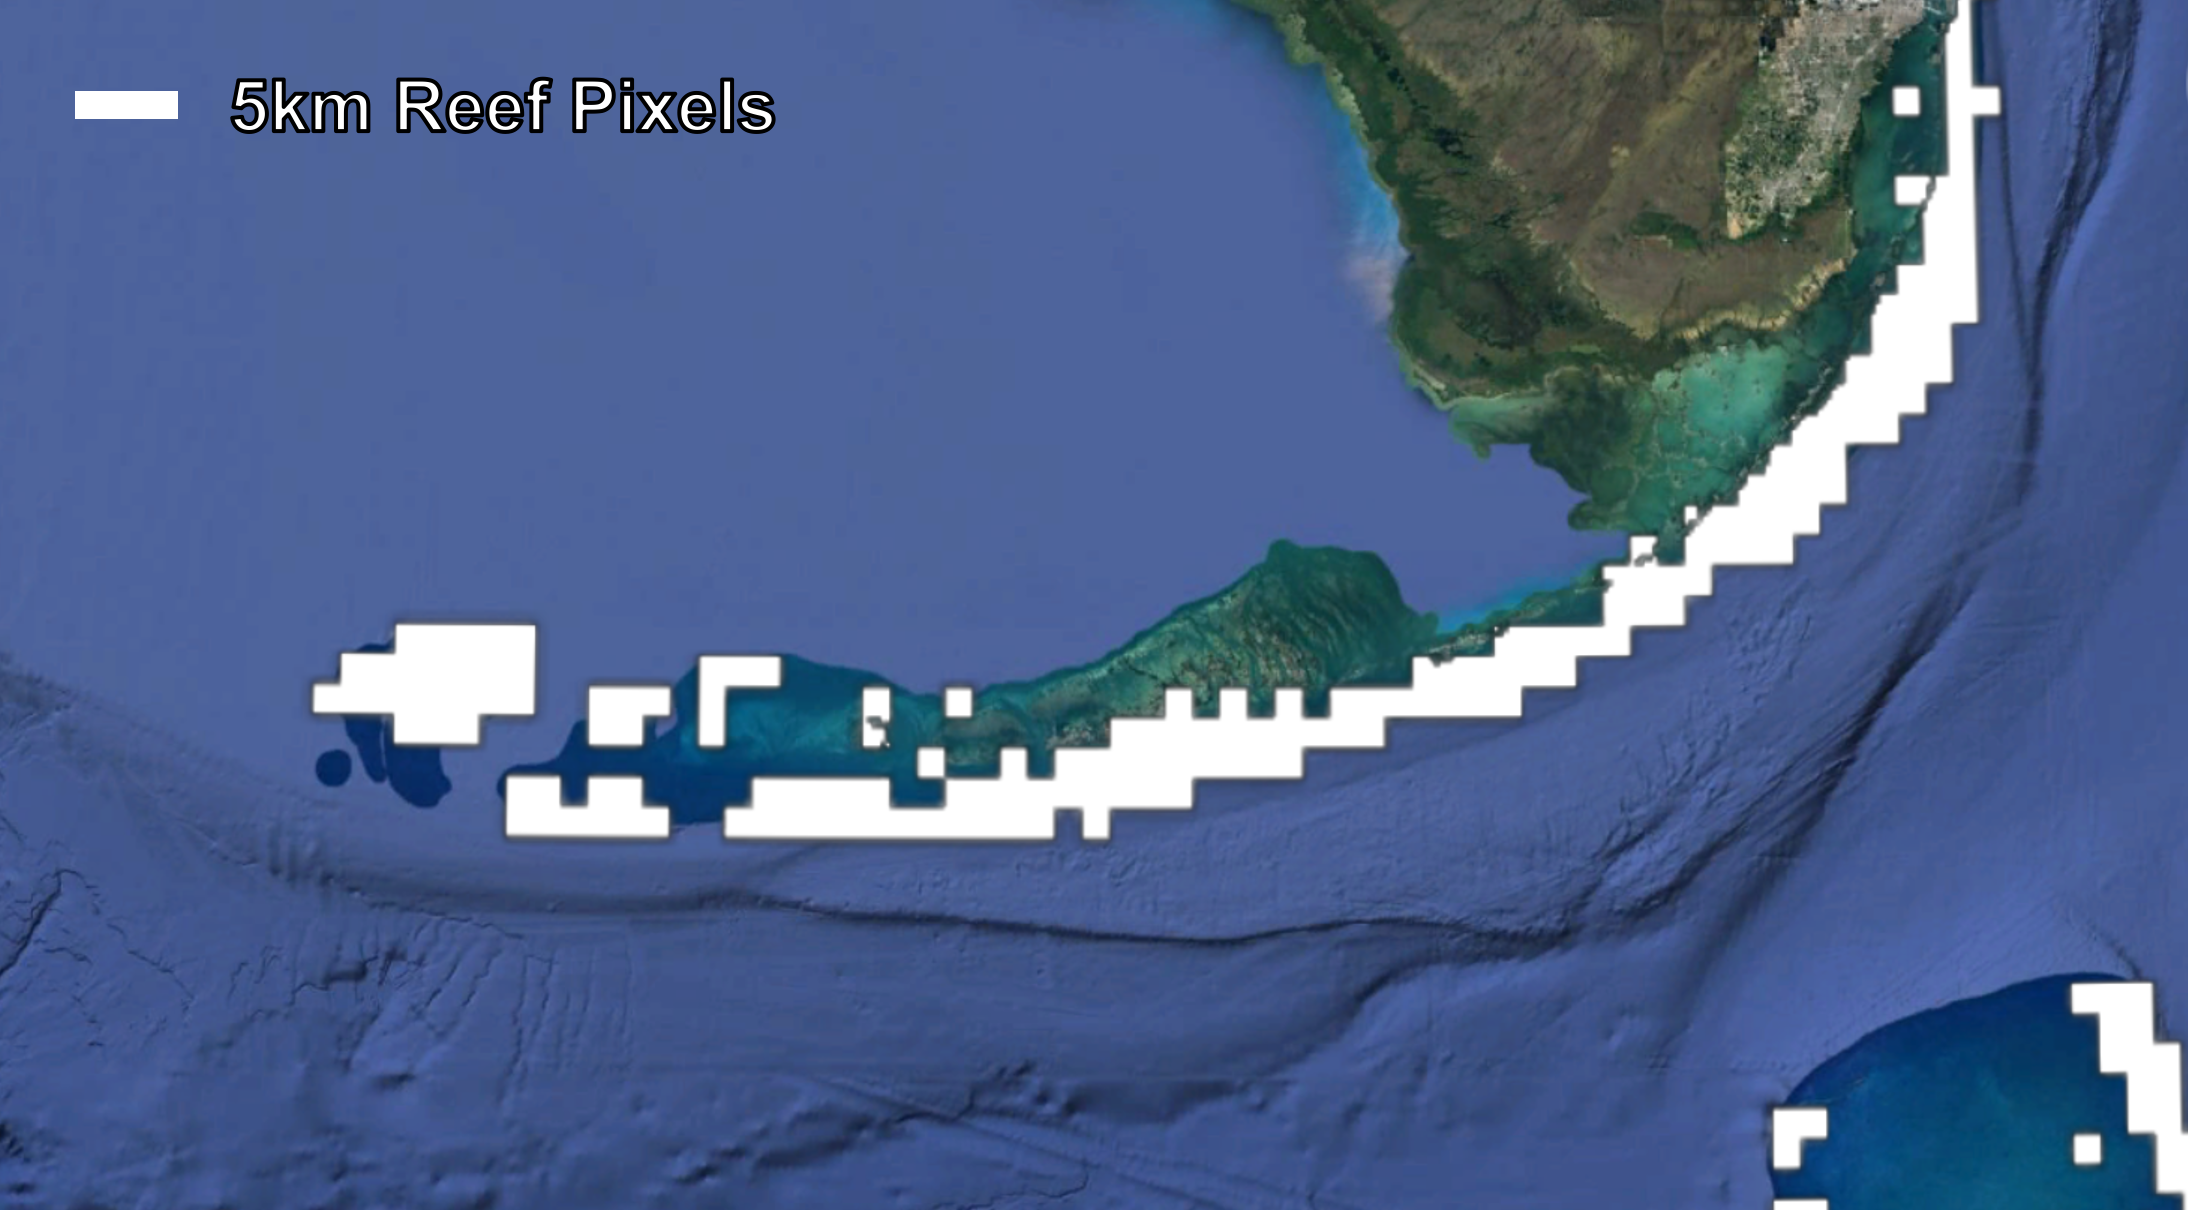
We then buffer these coral reef pixels, using a 20km buffer, to incorporate all local oceanographic conditions surrounding the reefs of interest. 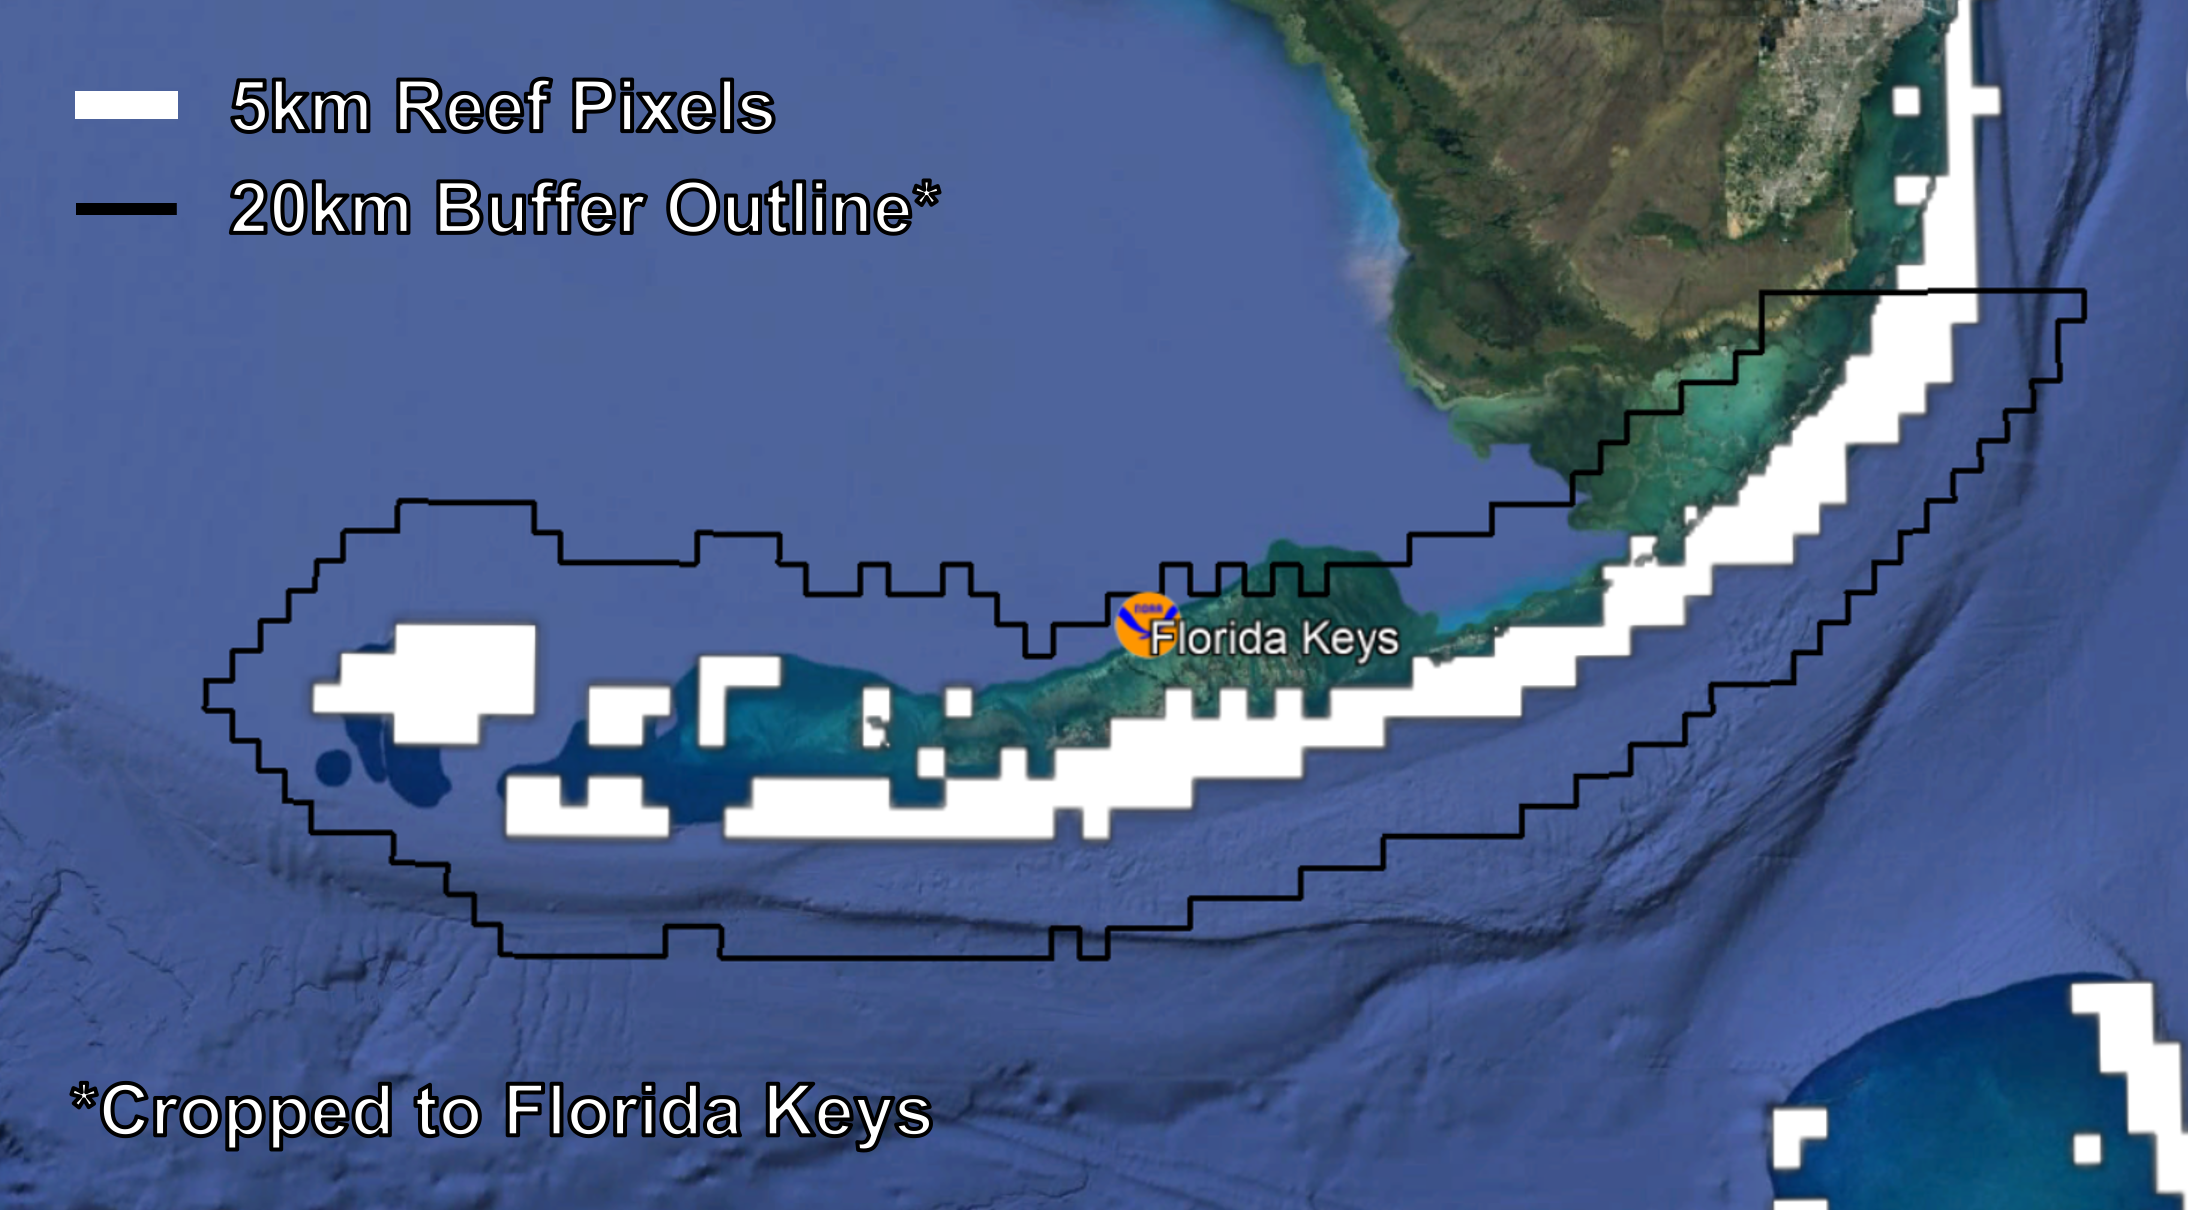
We crop the buffered coral reef pixels into geographic regions of interest for the entire globe. These are the 5km Regional Virtual Stations. 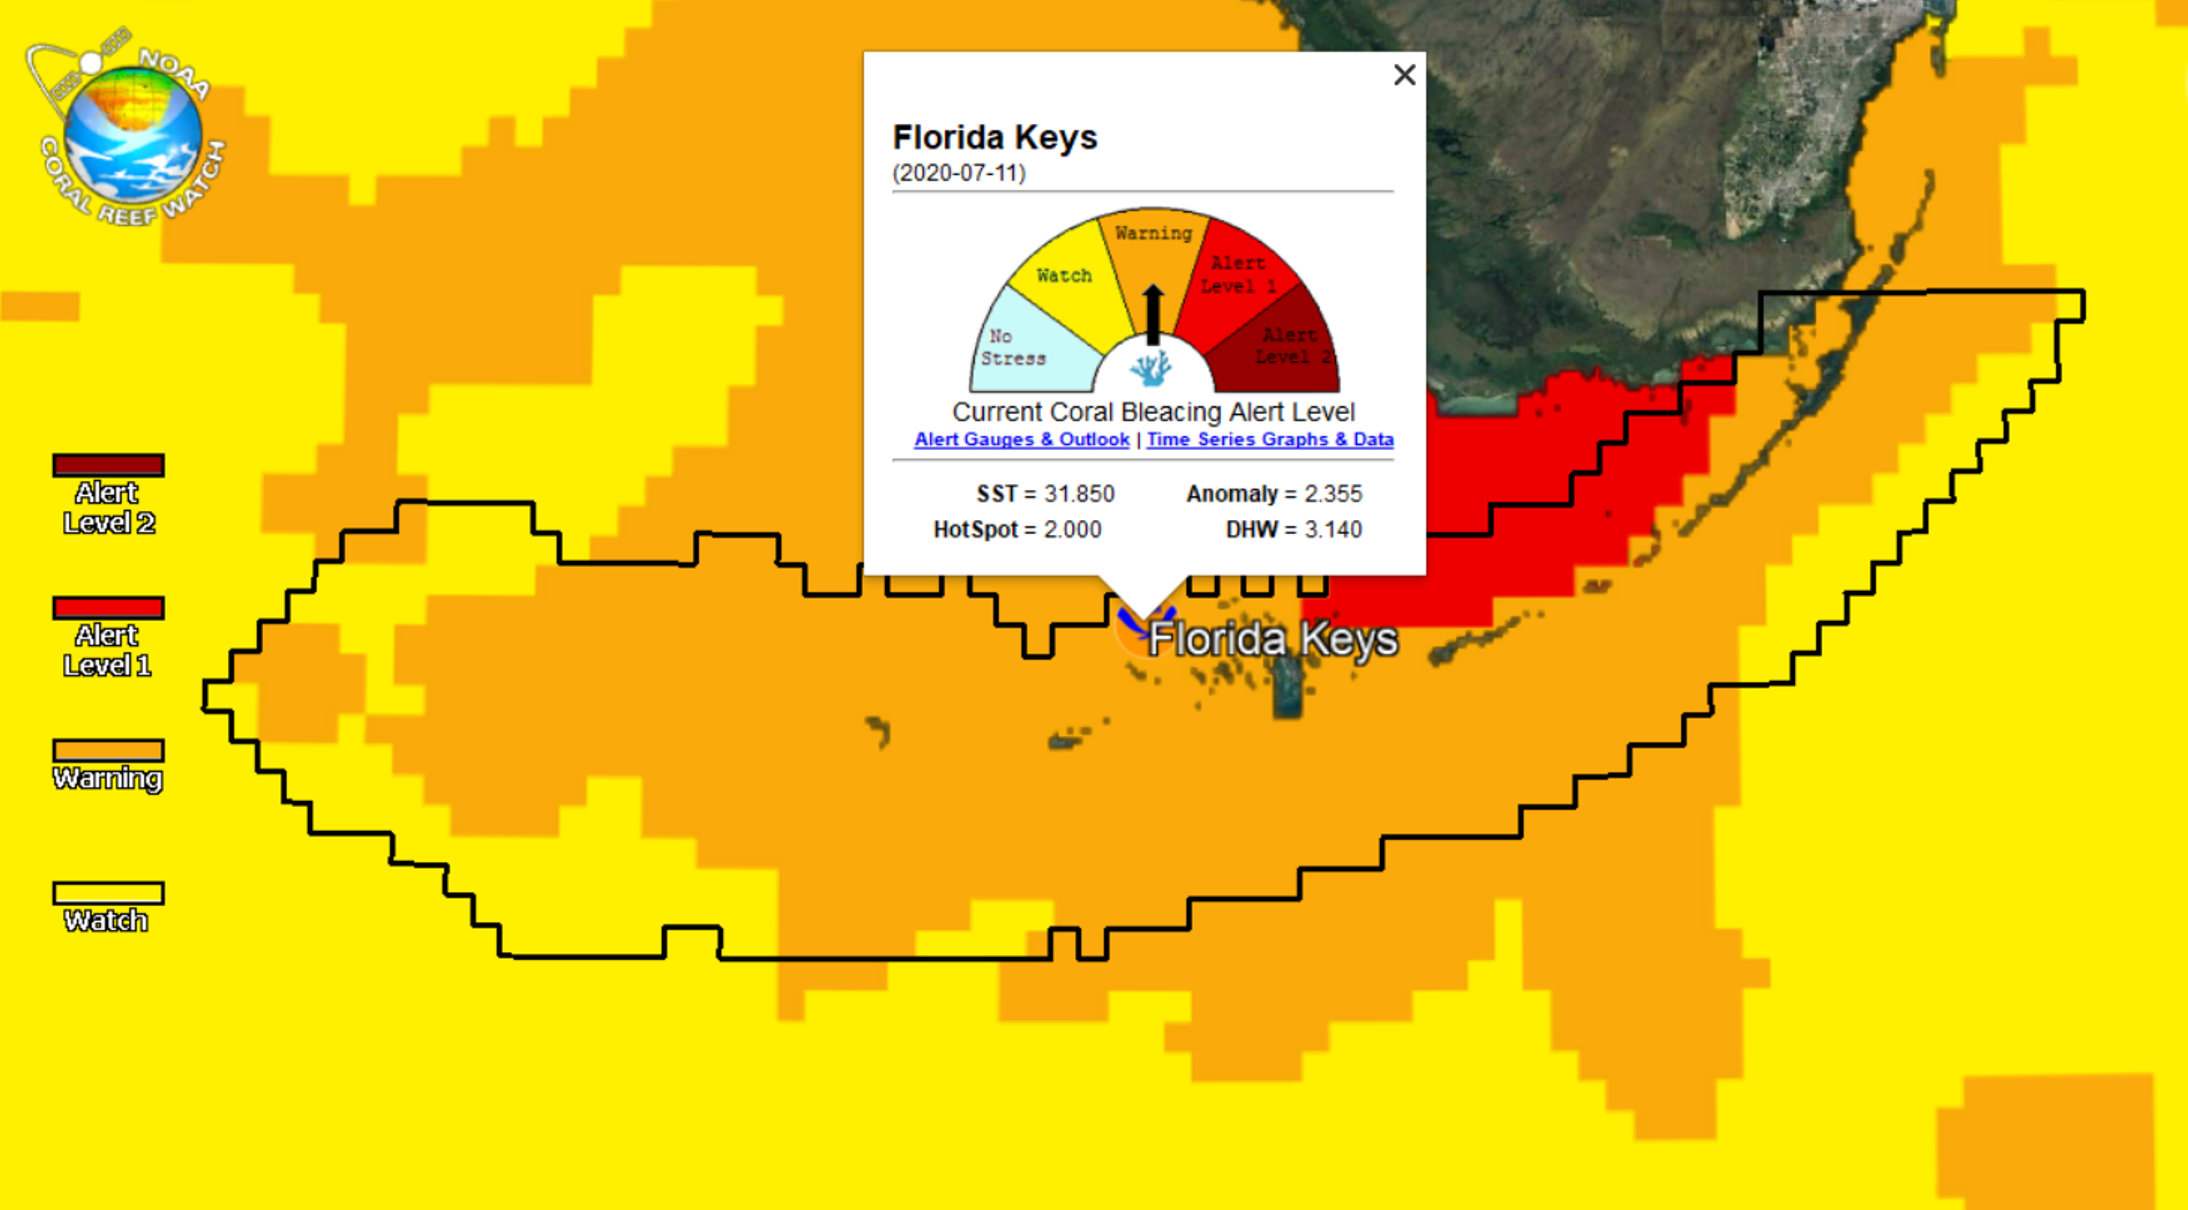
We use the data that fall within the boundary of each Regional Virtual Station
to create a time series.
Rather than provide the value of every 5km satellite pixel data point
within a Regional Virtual Station's boundary, we developed a new Regional
Virtual Station algorithm. The algorithm is based on the daily 90th percentile
Coral Bleaching HotSpot
value among a Station's 5km pixels, and the other variables –
Sea Surface Temperature (SST) and
SST Anomaly (SSTA) -
at the pixel where the 90th percentile Coral Bleaching HotSpot value is located.
Daily SST values are taken from this roaming satellite pixel. The Daily Regional DHW and Bleaching Alert Area (7-day maximum) measurements are then derived from the new 90th percentile Coral Bleaching HotSpot time series. 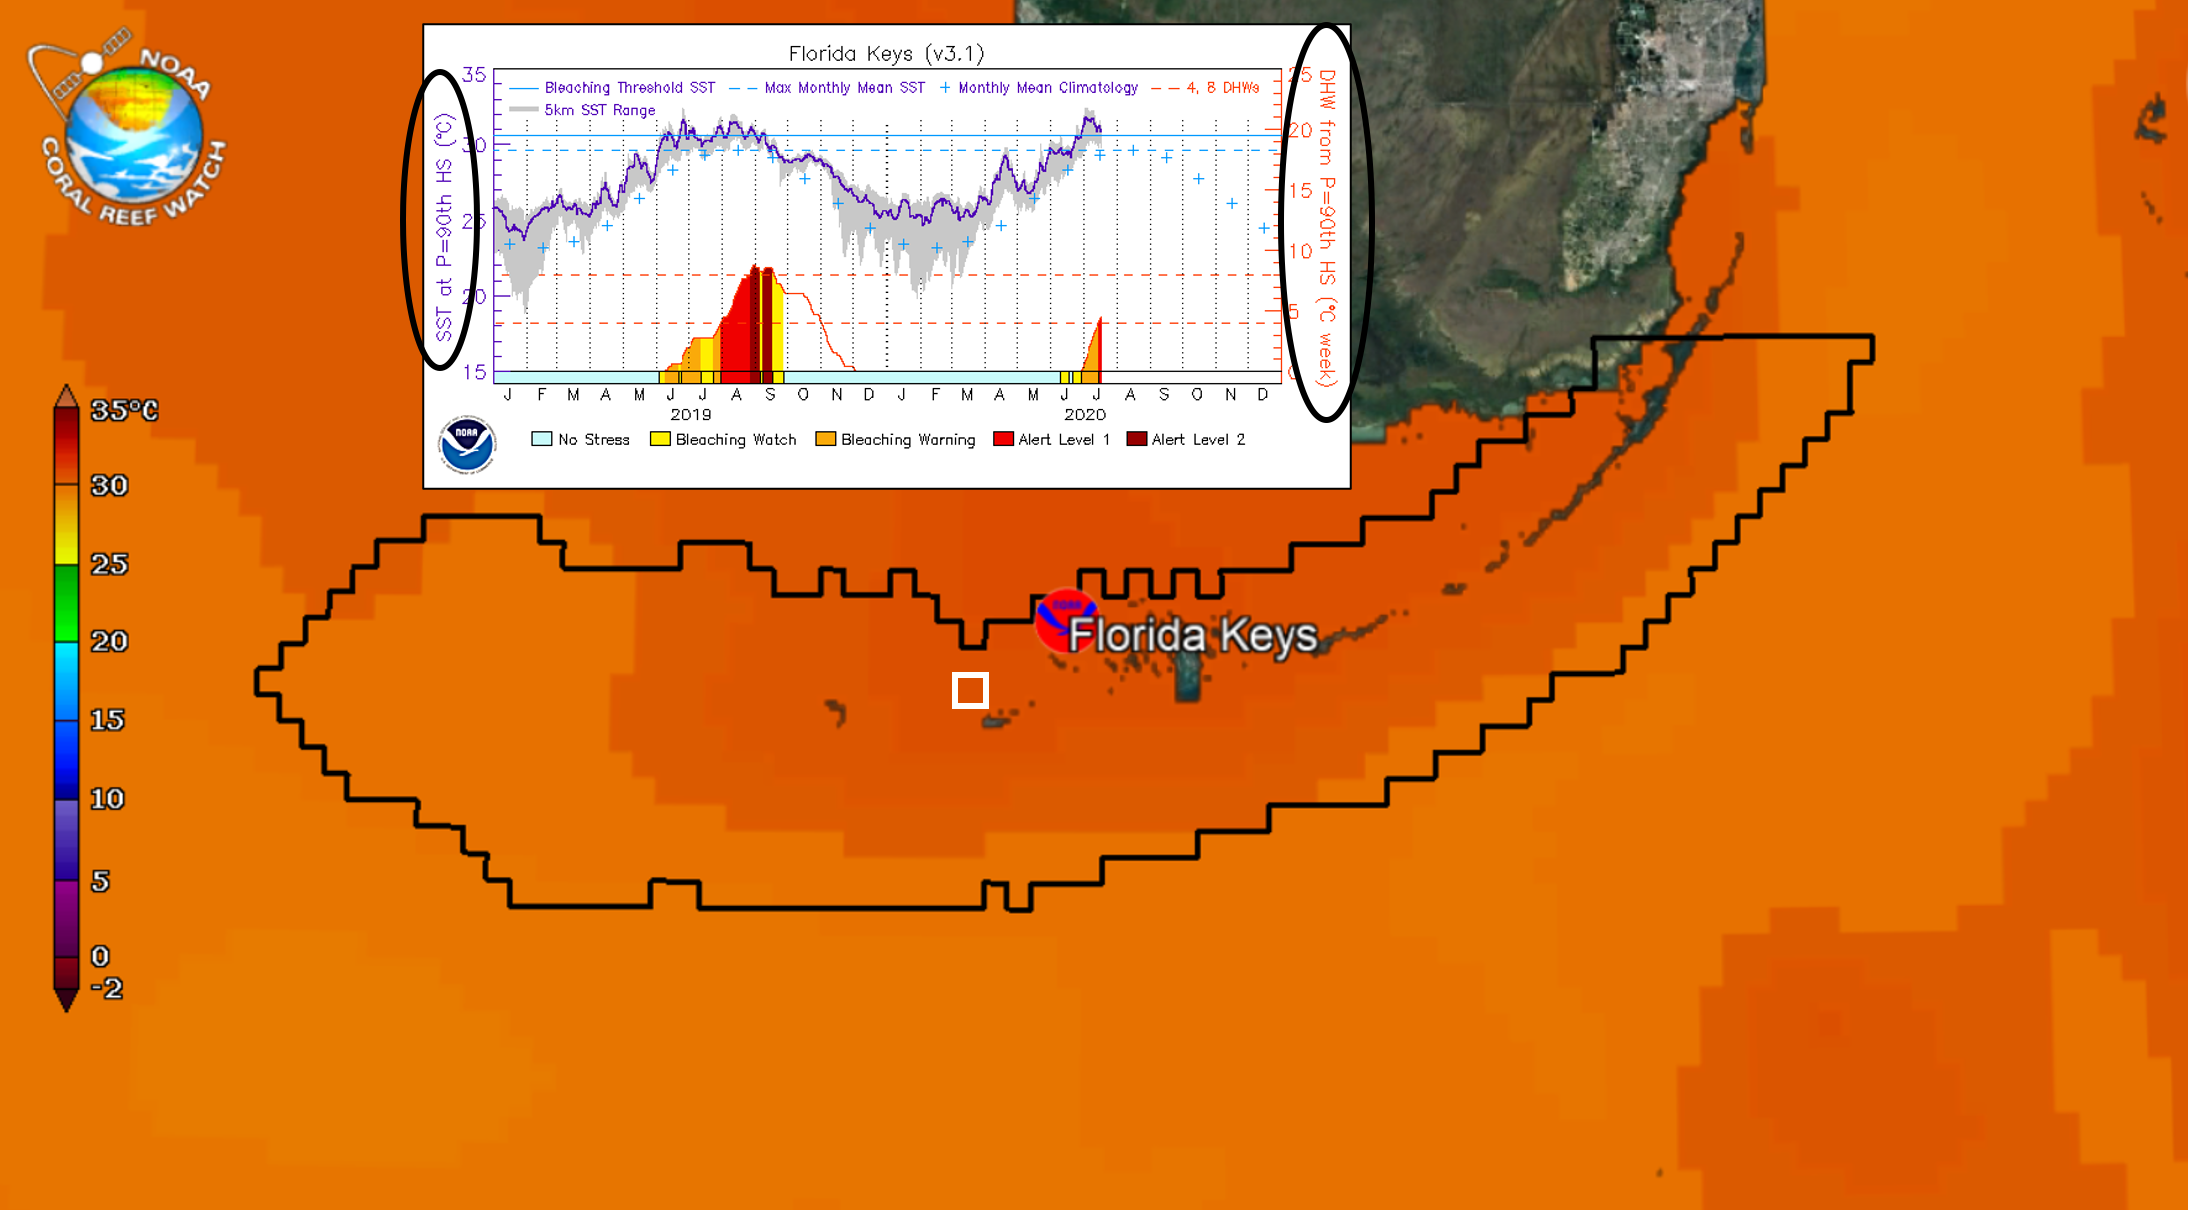
The daily range of all SST values is shown in gray in the time series graph in the image below. The Monthly Means (light blue + in the time series graph) are the averages within the region. The Maximum Monthly Mean, or MMM (light blue dashed line in the time series graph), is the maximum of the regional Monthly Means. 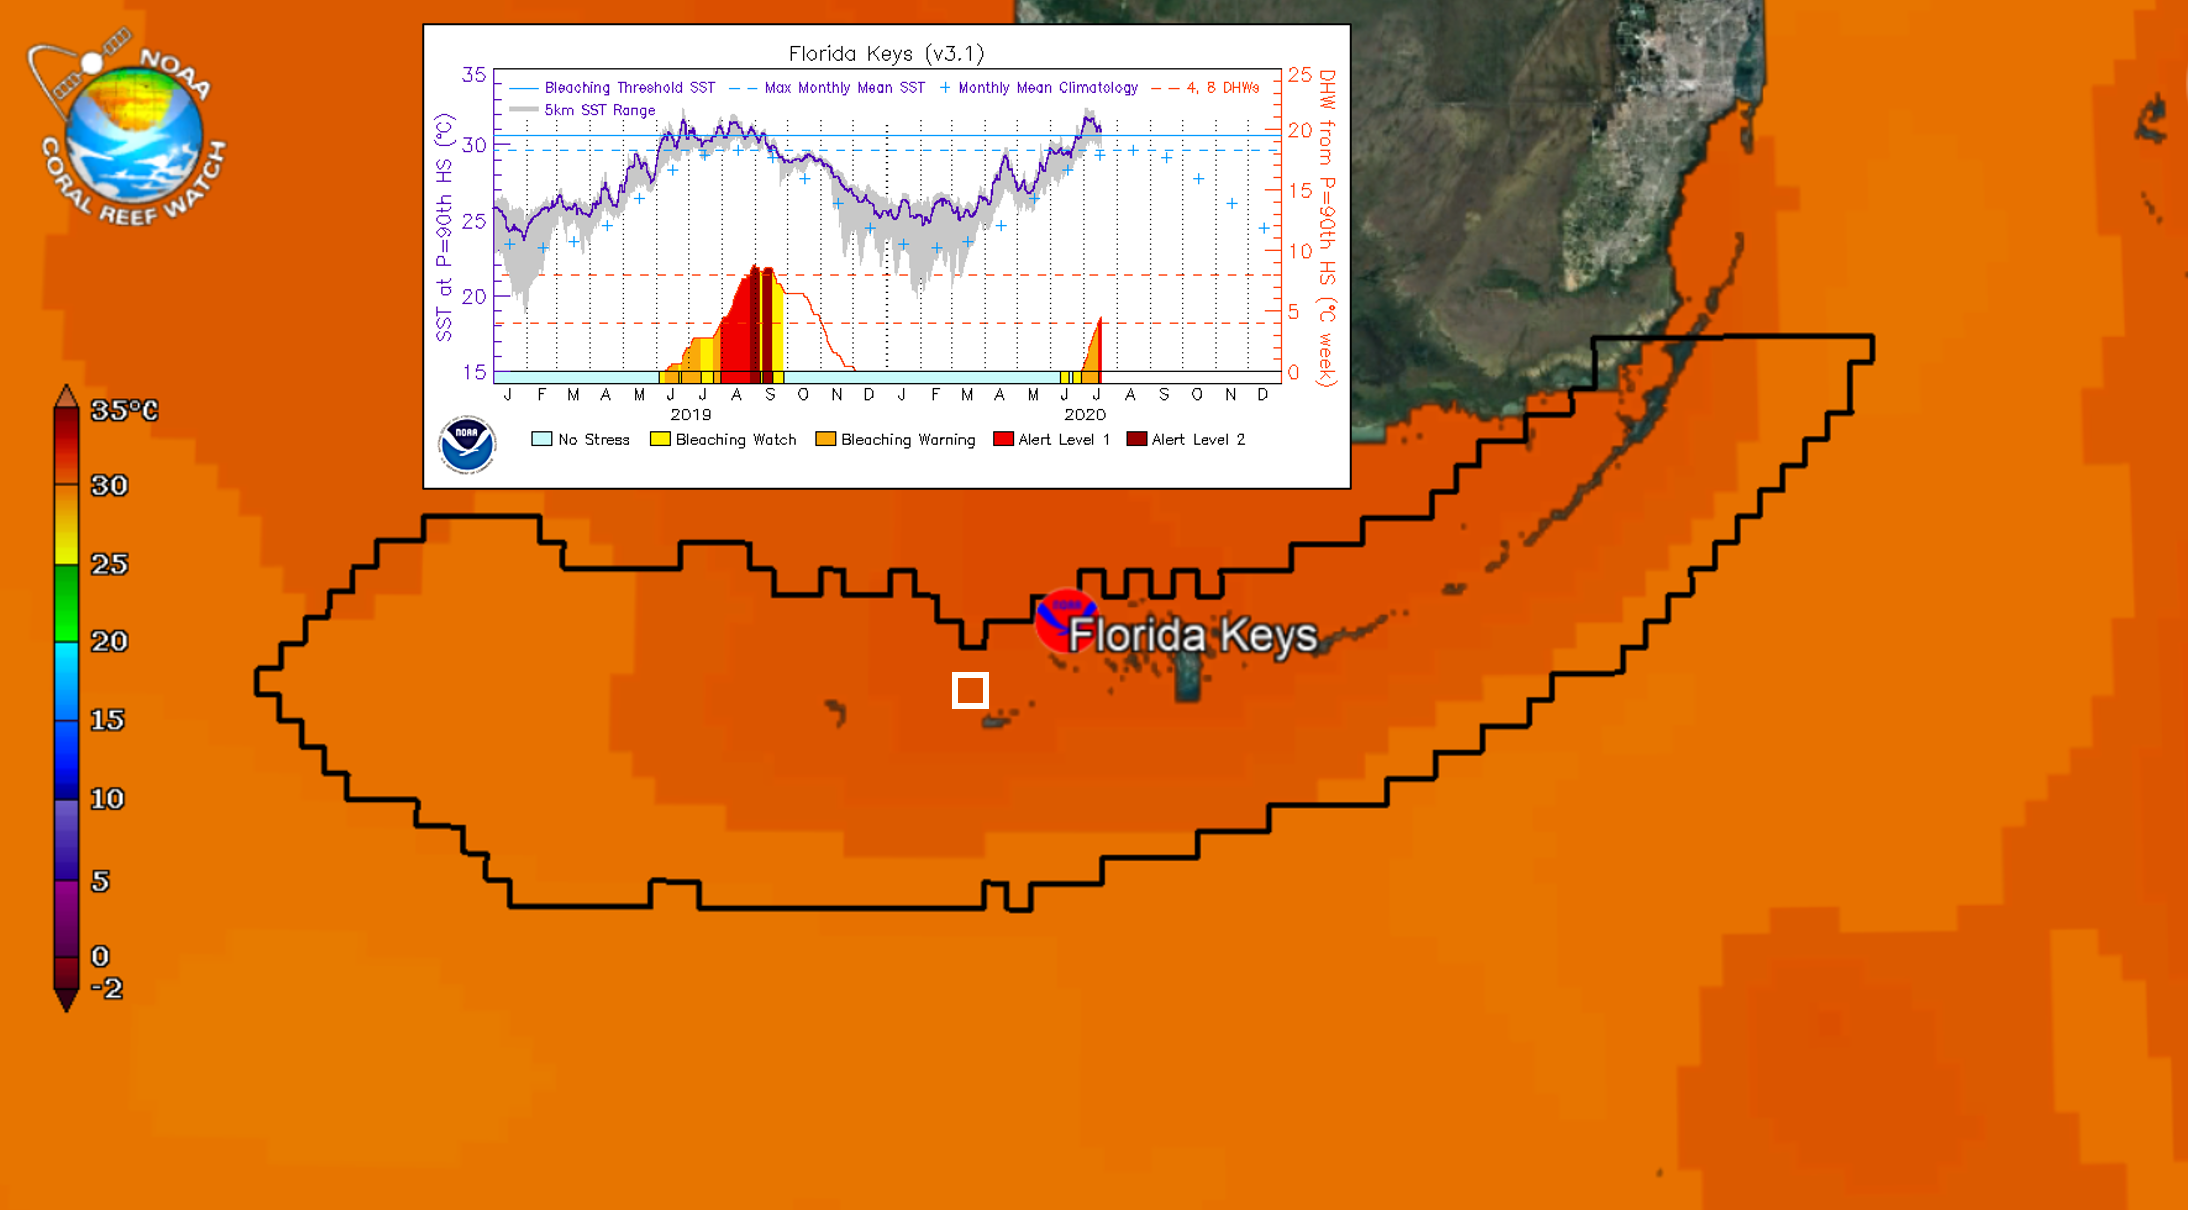
On the NOAA CRW website, we show time series data and graphs for each Regional Virtual Station. You also can sign up for free automated e-mail alerts. Alerts are based on the Regional Virtual Station's Bleaching Alert Area (7-day maximum) composite. They are meant to inform the subscribers that they should look at the map products (with data overlays currently in a Google Maps interface) for more detail. The next-generation 5km Regional Virtual Stations and the associated 5km Satellite Bleaching Alert email system are updated daily. 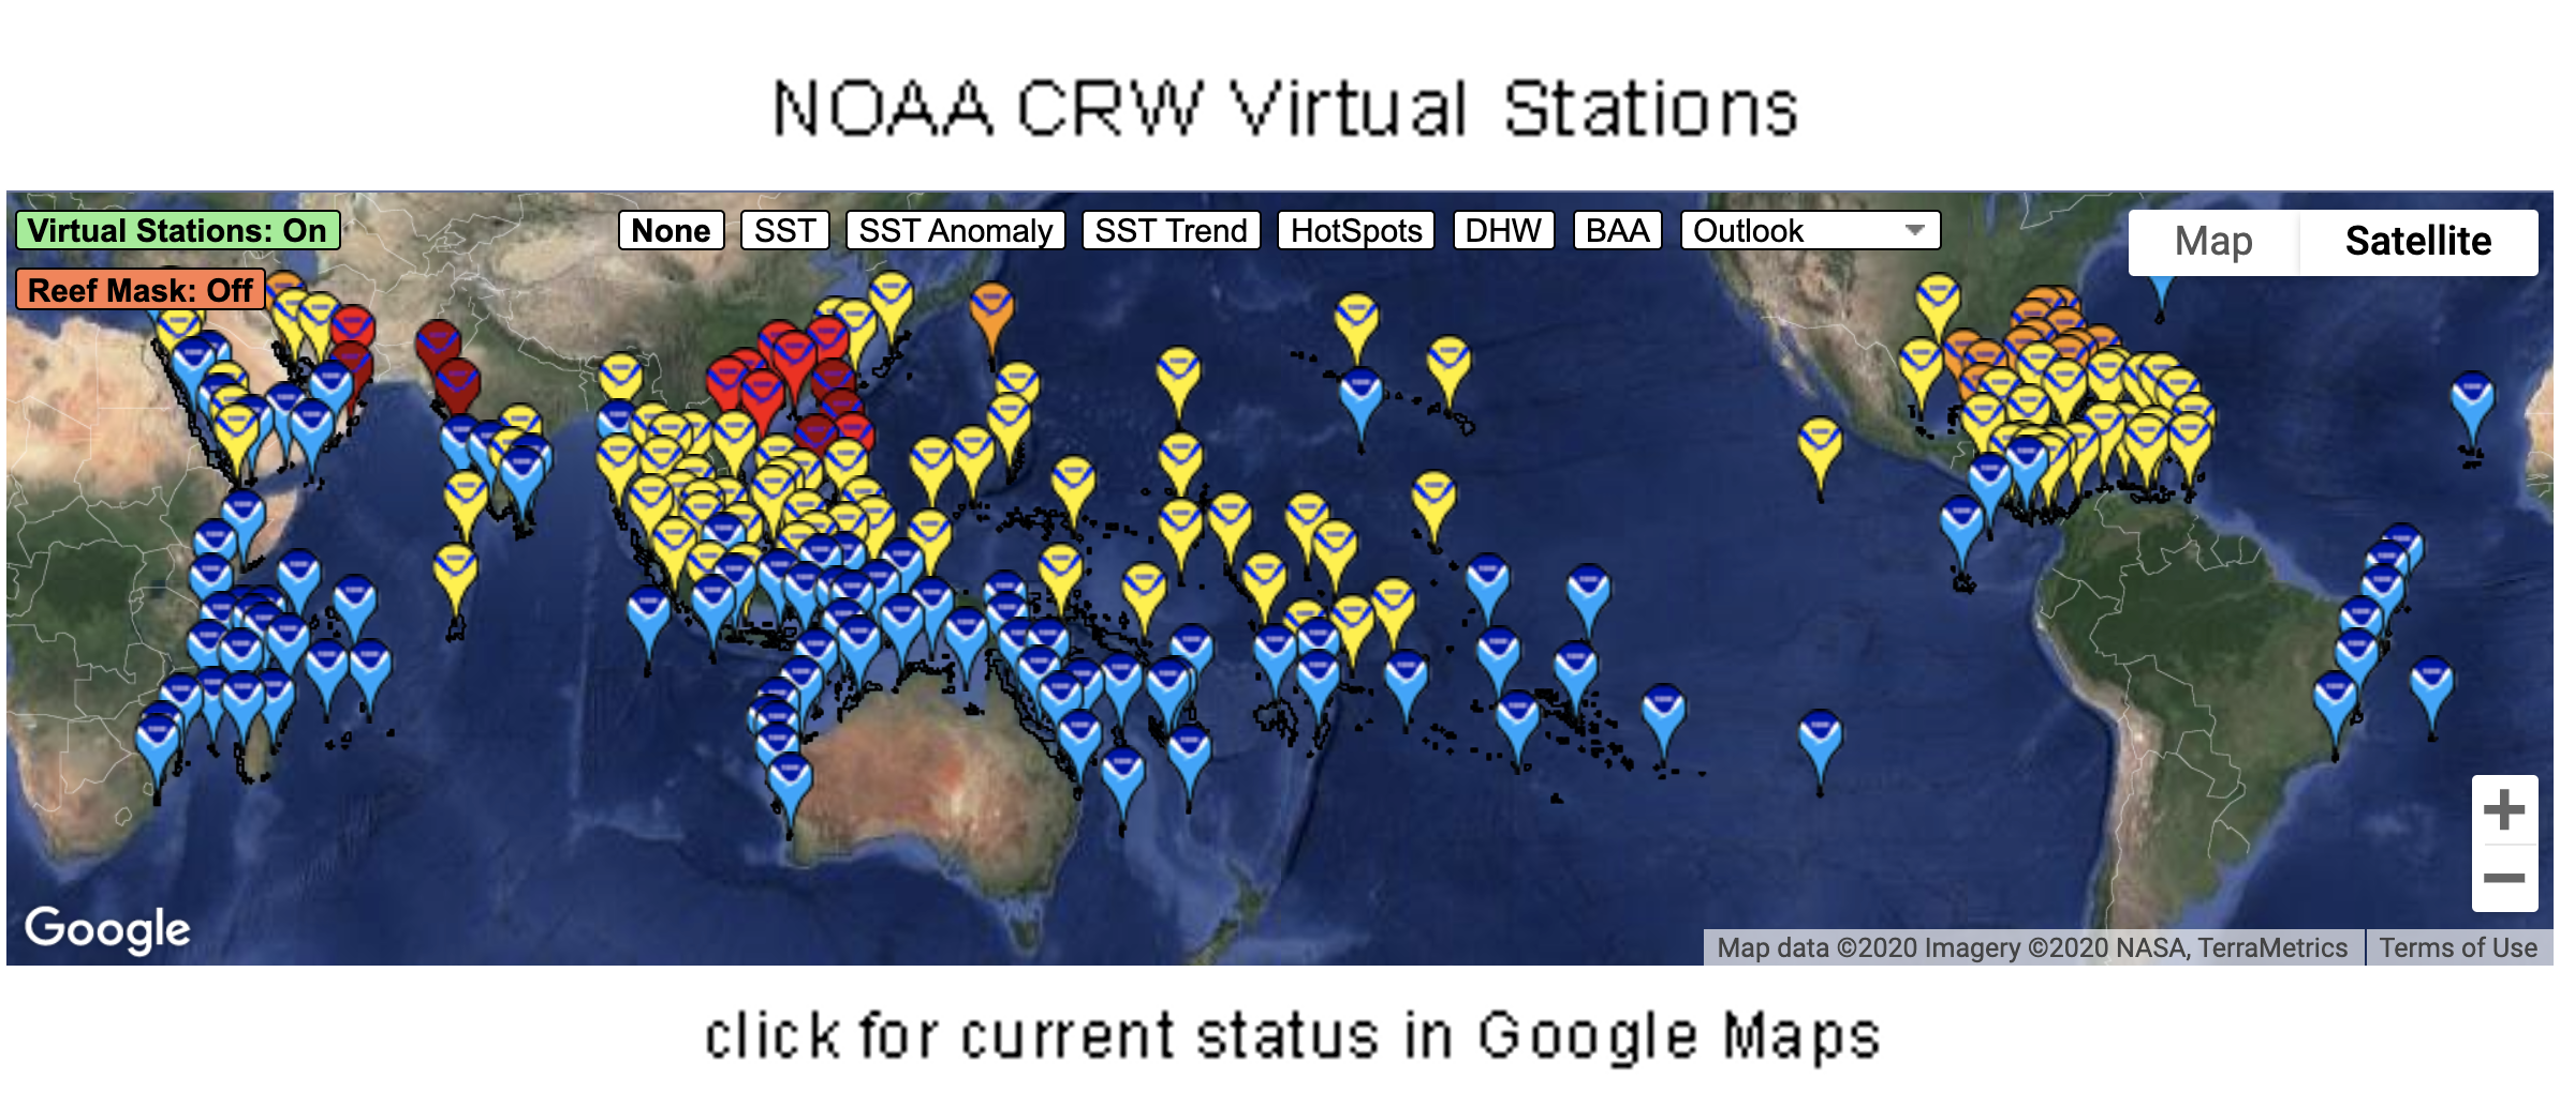
|
|||||||||||||
|
|
||||||||||||||

