


|
|
For each 5km Regional Virtual Station we show how the sea surface temperature (SST) changes over time with a series of graphical representations:
Time series graphs show the Regional Virtual Station's daily SST (along with the SST range of the Station's selected pixels), Degree Heating Week (DHW), and Bleaching Alert Area heat stress levels since January 1, 1985. We provide two-year and multi-year graphs, as well as long-term mean conditions: the Monthly Mean SST climatology, the Maximum Monthly Mean (MMM) SST climatology, and the bleaching threshold SST. In addition to the time series data, the daily 5km Regional Virtual Stations product includes Regional Bleaching Heat Stress Gauges, maps with data overlays in a Google Maps interface and in a Google Earth (kmz) file. The Regional Virtual Stations product also includes three maps showing the prediction of bleaching heat stress for up to twelve weeks into the future, based on CRW's modeled Four-Month Coral Bleaching Outlook product (not described in this tutorial). Let's look again at the example 5km Regional Virtual Station for the Main Hawaiian Islands that we introduced in prior tutorial chapters -- but now for the years 2015 and 2016. The graph below shows two years of 5km satellite SST data (2015-2016) at the 90th percentile Coral Bleaching HotSpot value for the Main Hawaiian Islands region. The SST is shown as a dark bluish-purple solid line, and the SST range is shaded in grey around the SST solid line. The 5km SST exceeded the MMM SST (shown as a light blue, horizontal dashed line) during July-October in both years (2015 and 2016). However, it only crossed above the Bleaching Threshold SST (shown as a light blue, horizontal solid line) in 2015. As you can see on the graph, DHWs started accumulating in August 2015, and reached Alert Level 2 heat stress in late September. Alert Level 2 heat stress then remained throughout almost the entire month of October 2015. The highest 5km SST that NOAA CRW observed remotely during 2015 and 2016 happened in mid-September 2015, when the SST reached approximately 29 °C. 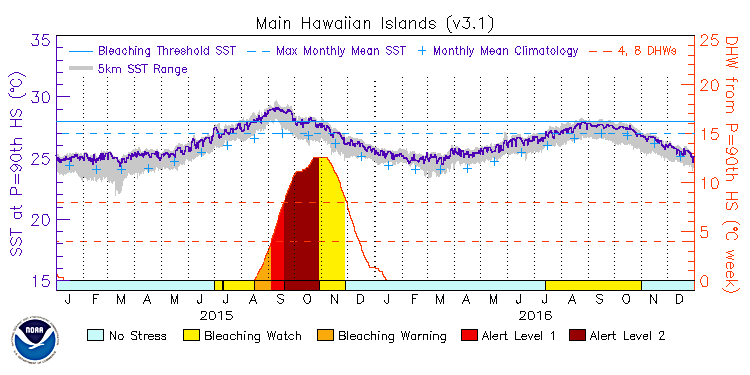
Click here to access the time series graphs and data for the 5km Regional Virtual Stations that are updated daily. To receive updates as the environmental conditions change at a coral reef of interest, you can also subscribe to NOAA CRW's free, automated SBA Email System (described in the next section).
|
|||||||||||
|
|
||||||||||||

