|
|
|
|
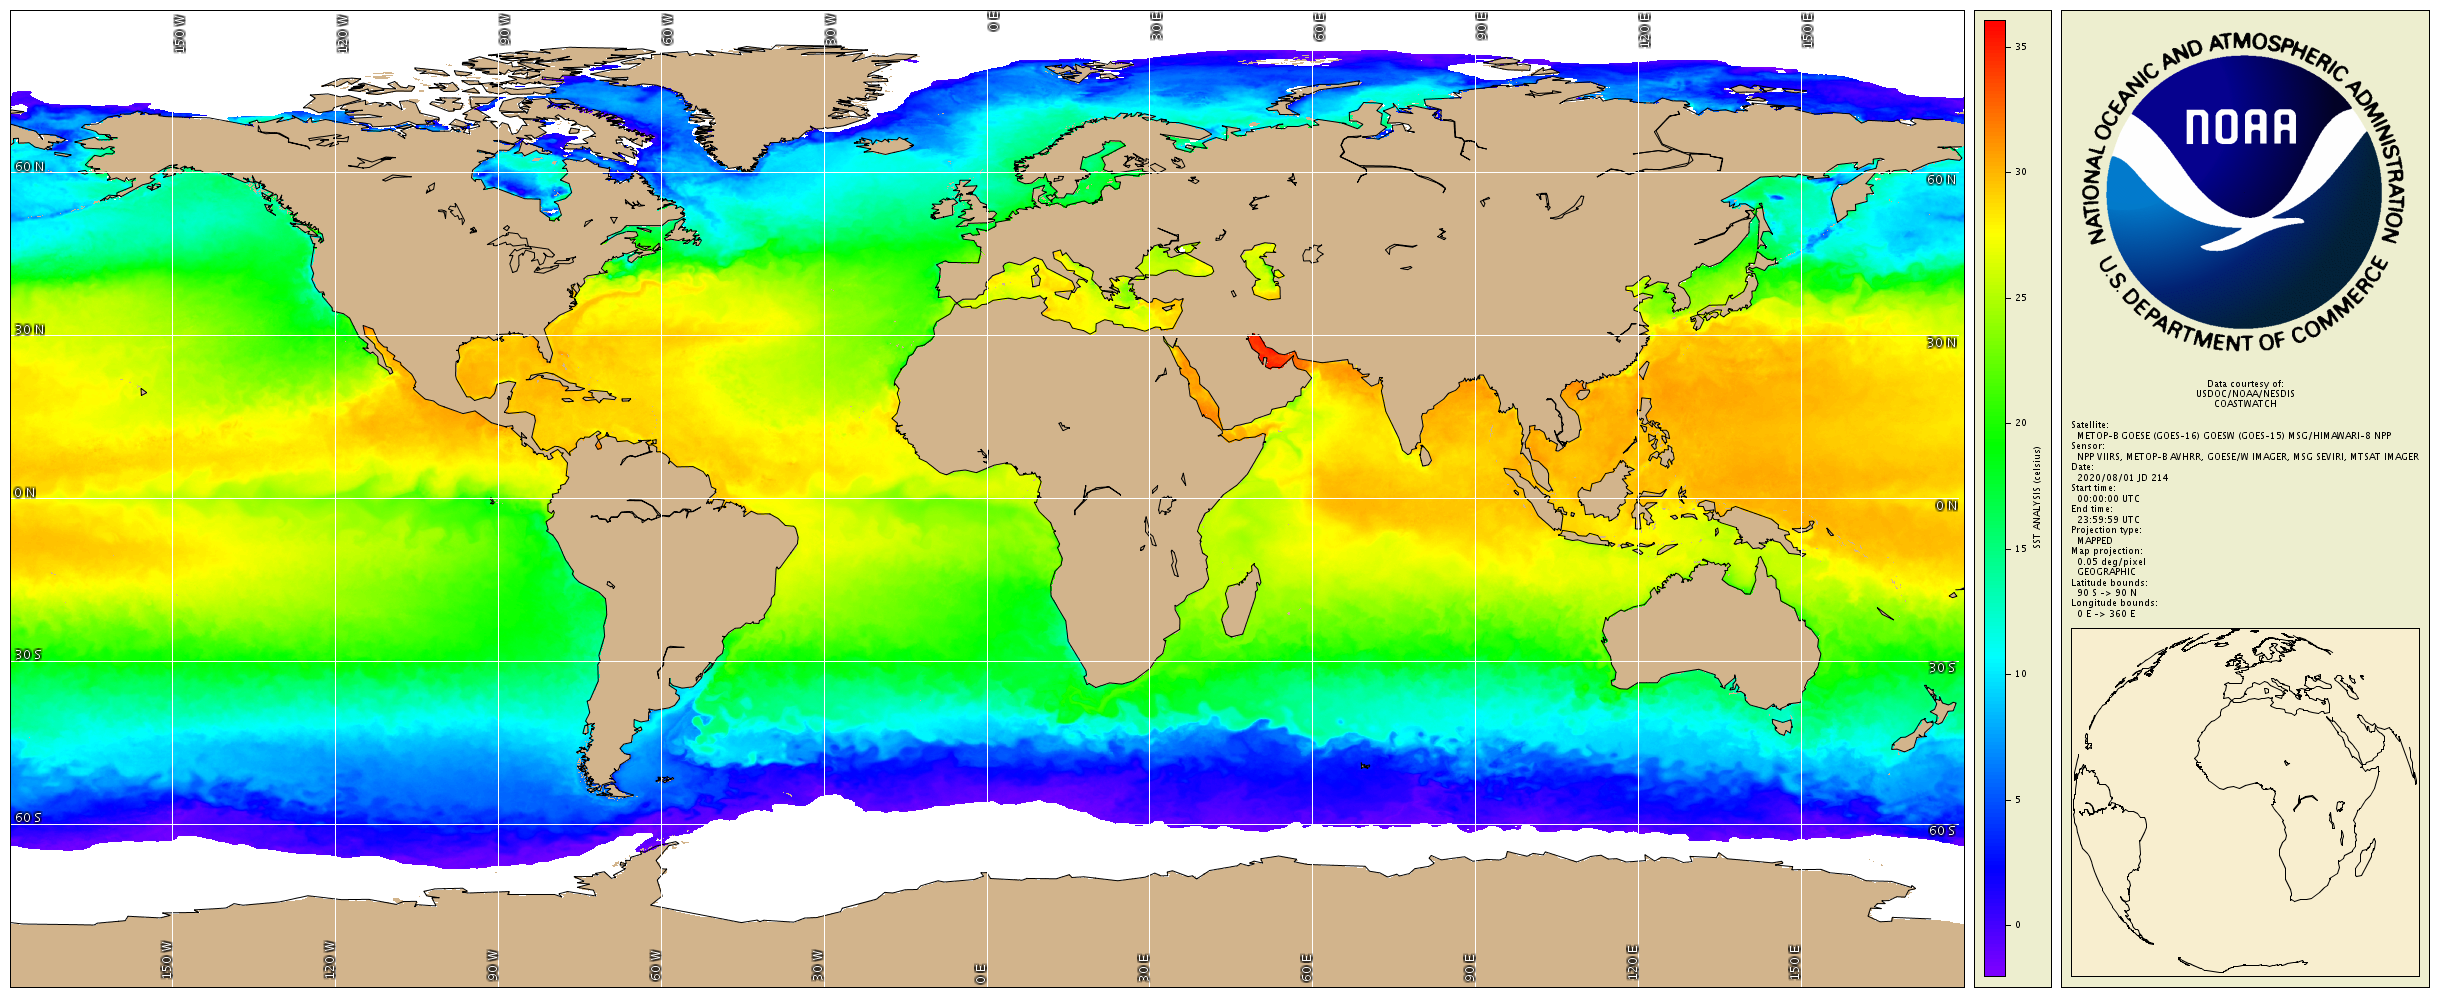
Example image of the NOAA Geostationary-Polar-Orbiting Blended Global
Sea Surface Temperature (SST) Analysis, from August 1, 2020, which combines SST data from U.S., Japanese, and European geostationary infrared imagers,
and U.S. and European polar-orbiting infrared imagers, into a single high-resolution 5km product.
Credit:
NOAA CoastWatch/OceanWatch.
Click the image to view a larger version.
|

|
|
There are four properties that an environmental satellite can directly measure over the ocean:
- How far away is the water surface?
- How rough is the surface?
- What color is the water?
- What is the water temperature?
Marine scientists and resource managers use these four basic types
of data to measure and interpret a wide range of properties about the ocean environment, such as:
- Sea surface temperature (SST)
- Sea surface height (sea level)
- Speed and direction of ocean currents
- Wave height, length, and direction
- Wind speed and direction
- Bathymetry (sea floor topography)
- Oceanographic features: eddies, temperature fronts, tidal fronts, shearing, etc.
- Air-sea fluxes (Energy: heat, water vapor - evaporation, light, momentum, gases)
- Turbidity (how clear the water is)
- Suspended sediment (soil particles floating in the water)
- Dissolved organic matter (usually pollutants or tannic acid from forests)
- Chlorophyll
- Primary production
For more information about how satellites measure these properties,
please see our Online Resources section. For the NOAA CRW
applications in the rest of this tutorial, we will focus on ocean temperature at the surface (or SST).
(top)
|
|


