Satellites & Bleaching

5km Products Overview

previous page next page
Intro to CRW's 5km Data Products  |  Data Delivery and Formats
CRW DHW for the Caribbean on Aug 09 2020 in Google Earth

NOAA CRW's Degree Heating Week (DHW) product, displayed on Google Earth, shows the accumulated heat stress leading to coral bleaching throughout the Caribbean on August 9, 2020.

NOAA CRW provides its 5km data in a variety of formats. Product data are available on our website for free download and use on the CRW website. Data are presently available in Network Common Data Form version 4 (NetCDF4) via File Transfer Protocol (FTP), Hypertext Transfer Protocol (HTTP), and Thematic Real-time Environmental Distributed Data Services (THREDDS) and Environmental Research Division’s Data Access Program (ERDDAP) servers. We also provide preview images (graphic displays) of the data.

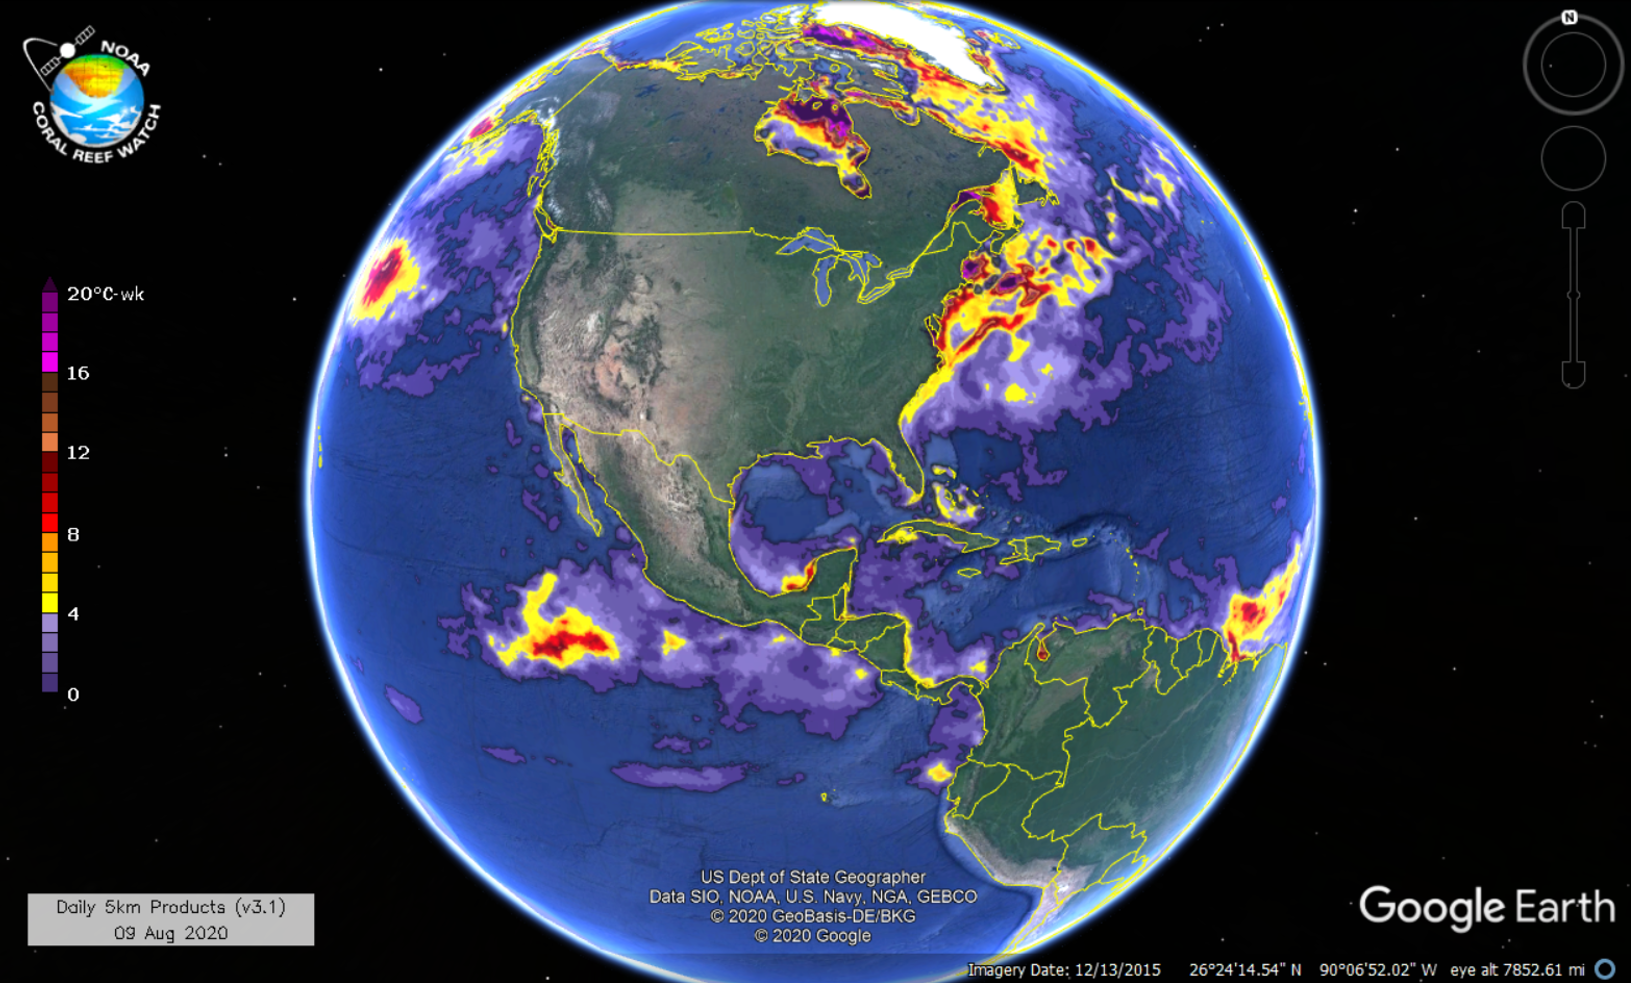
Additionally, CRW's daily global 5km coral bleaching heat stress monitoring products can be viewed using Google Earth. Available products include: Sea Surface Temperature (SST), SST Anomaly, Coral Bleaching HotSpot, Degree Heating Week (DHW), Bleaching Alert Area, SST Trend, and the Regional Virtual Stations. Click here to access the 5km data products in Google Earth format.

Furthermore, NOAA's CoastWatch program developed a free Utilities tool that is customized to read CRW's NetCDF4 files, visualize the 5km product data, view data information and values, calculate certain statistics, and create graphic output. The software is easy to install and use but is not required to visualize and manipulate the data. Many commonly used computer programming languages and software packages can read and process NetCDF4 files.

To access CRW's 5km data, click here.


previous page next page


(top)

NOS Web site footer