


St. Thomas
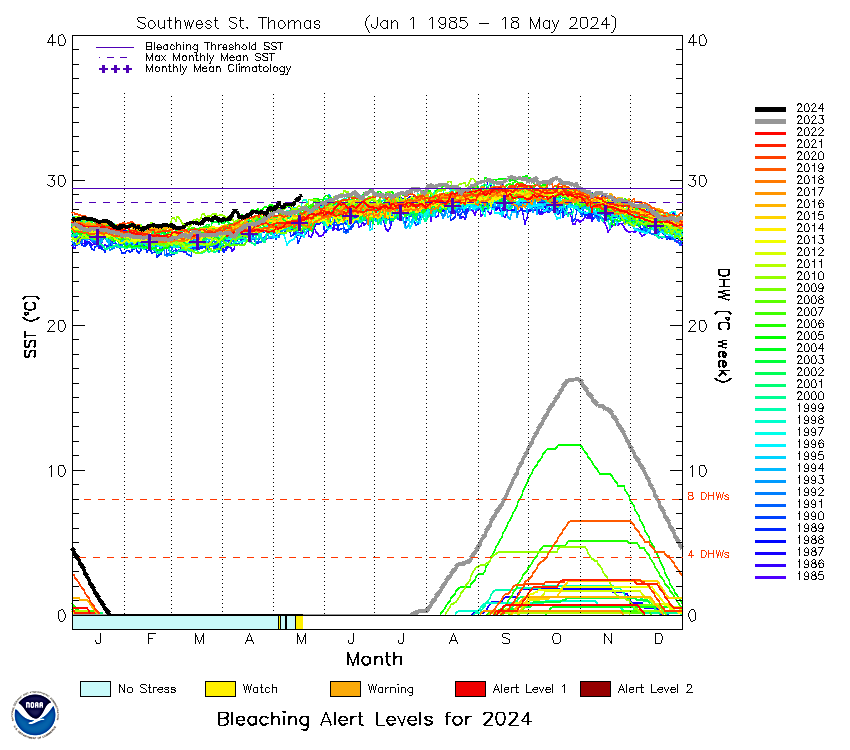
1. Southwest St. Thomas
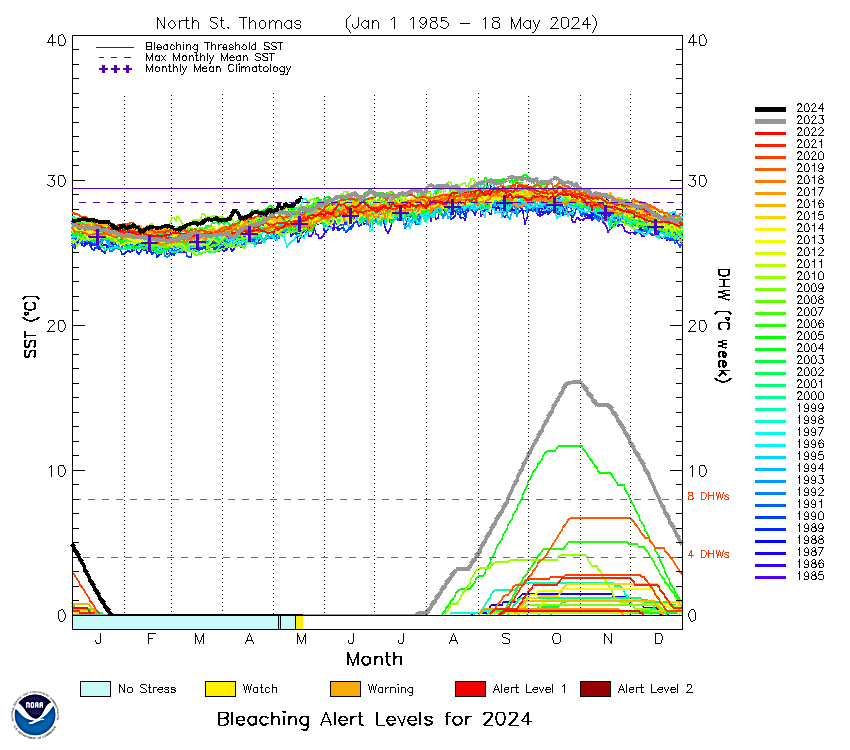
2. North St. Thomas
St. John
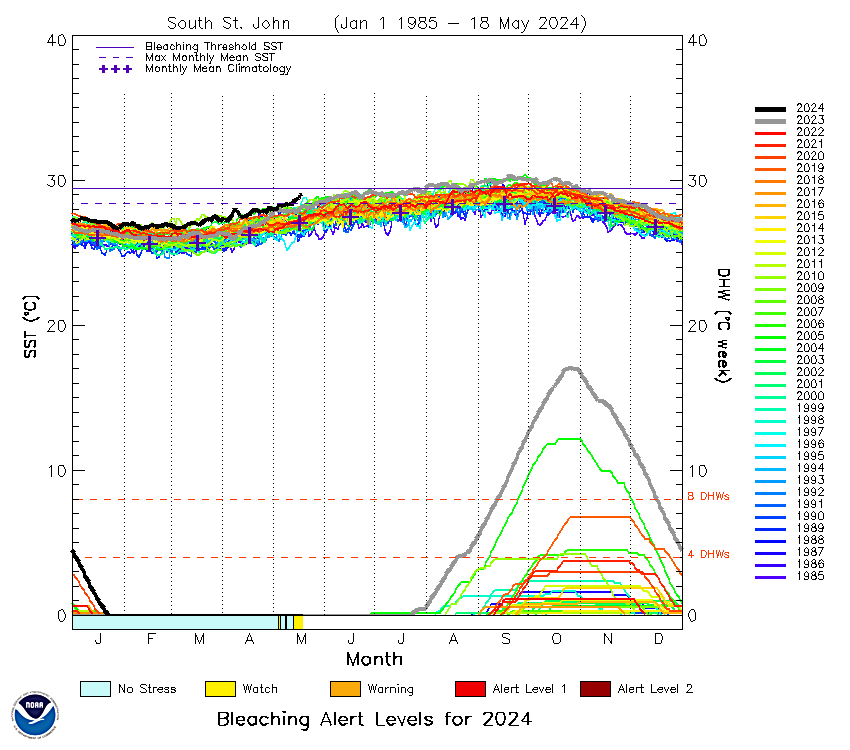
3. South St. John
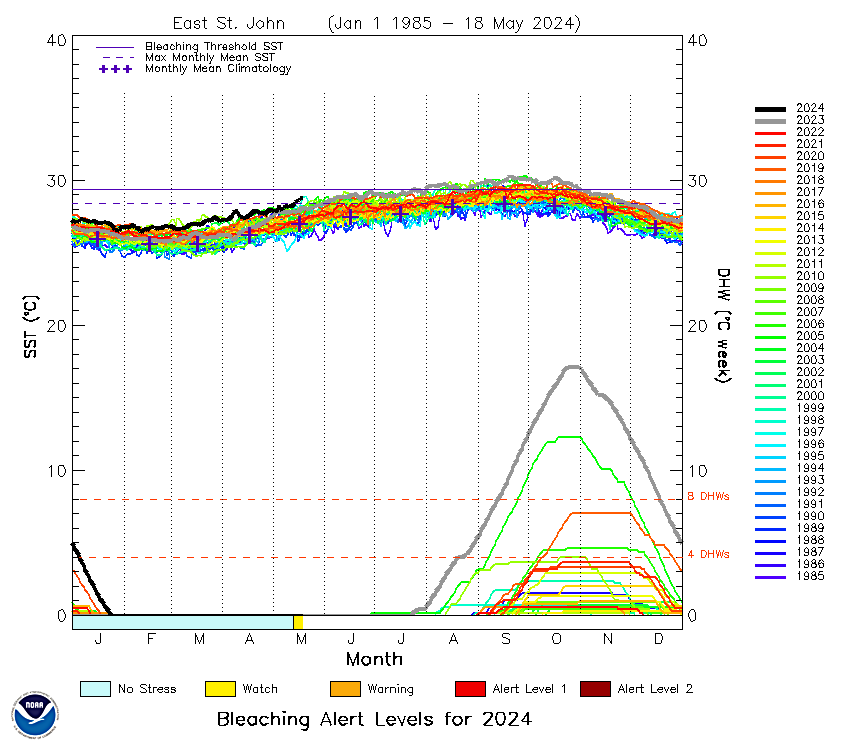
4. East St. John
St. Croix
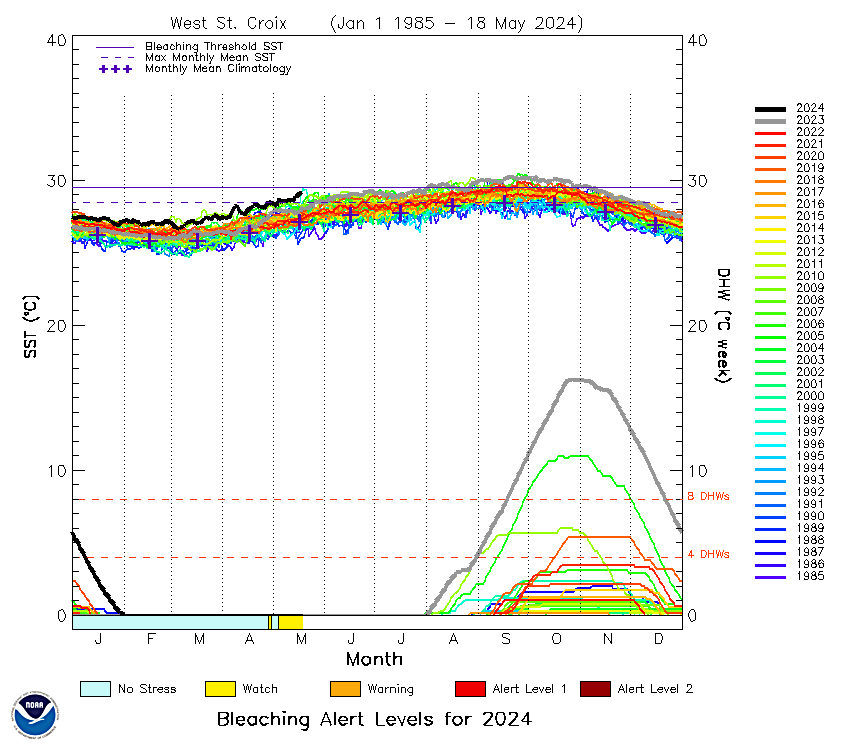
5. West St. Croix
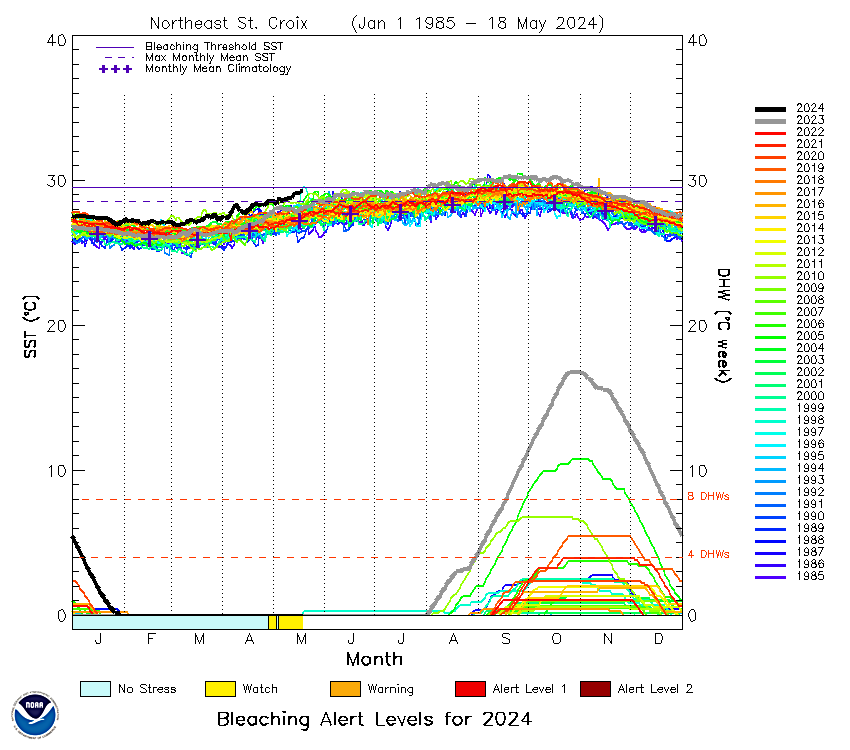
6. Northeast St. Croix
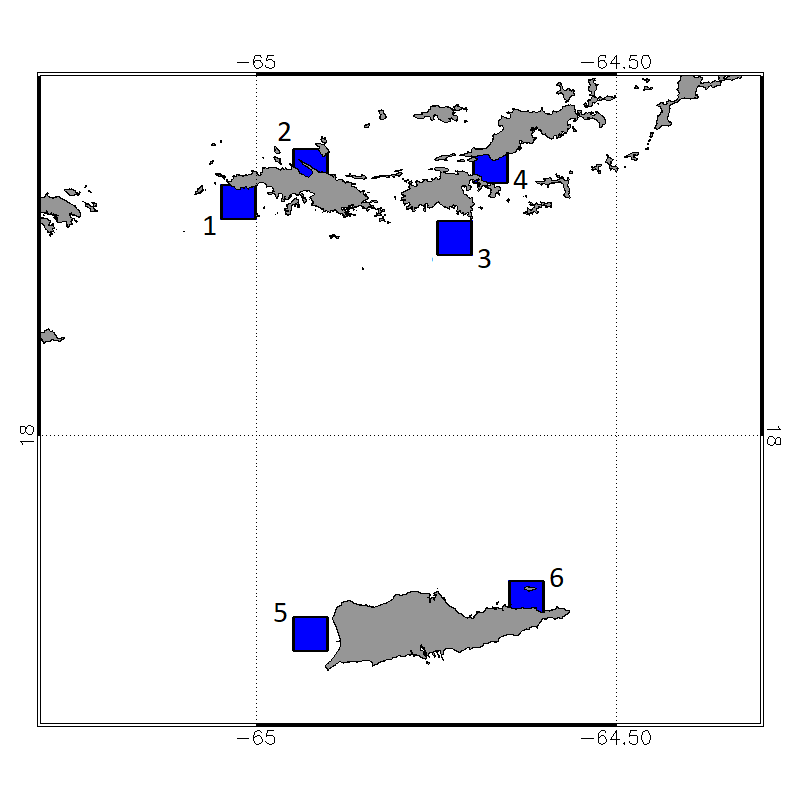
Virgin Islands 5 km Single-Pixel Virtual Stations
(experimental product for collaborators based on v3.1 global products)
(experimental product for collaborators based on v3.1 global products)
NOTE: Alerts displayed on individual Regional Virtual Station (RVS) and Single-Pixel Virtual Station pages still use the heritage bleaching alert level system (which extended to Bleaching Alert Level 2). We are currently updating these systems to reflect the modified bleaching alert levels (now extending to Bleaching Alert Level 5). Until this update is complete, when a Station displays Alert Level 2, we suggest that users consult the Time Series data file that is linked directly below or to the right of the two-year time-series graph. This data file displays the underlying Coral Bleaching HotSpot and Degree Heating Week (DHW) values, from which a user can determine, on any day, what the new, corresponding Bleaching Alert Level should be, if higher than Alert Level 2.
Click on a location on the map, the name of a site, or scroll down to see the time series for each location.


