


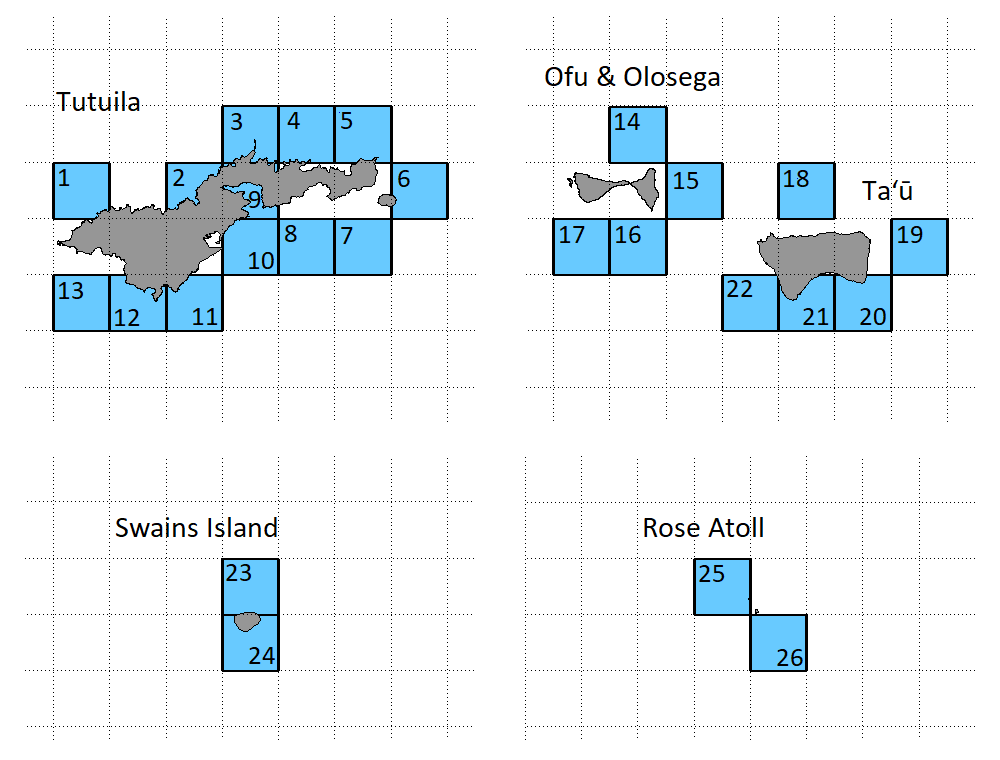
Tutuila
1. Fagamalo
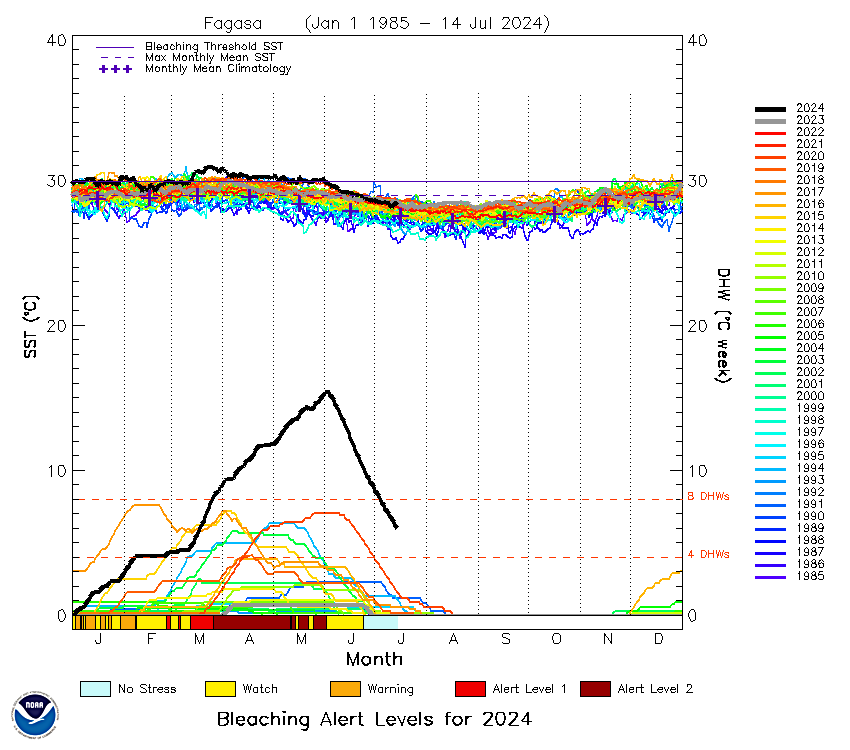
2. Fagasa
3. West Pola
4. Vatia
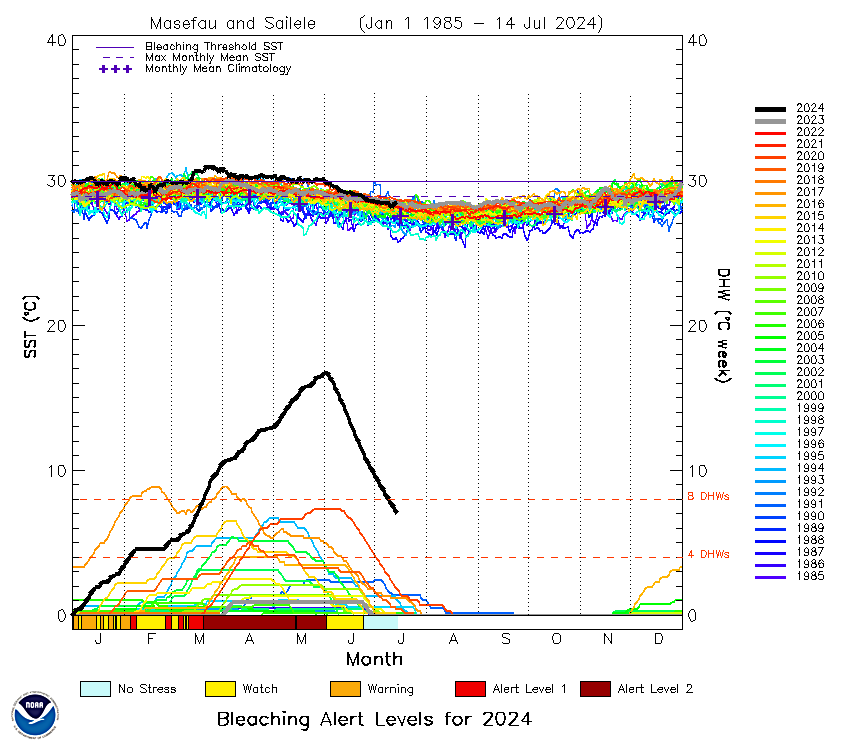
5. Masefau and Sailele
6. Aunu'u East
7. Aunu'u West
8. Fagaitua
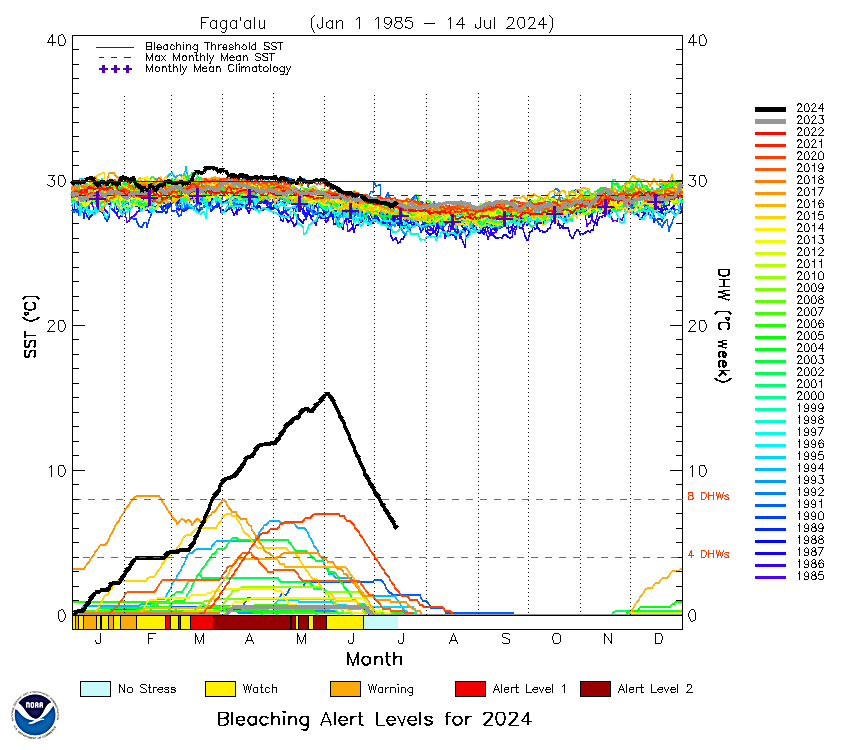
9. Faga'alu
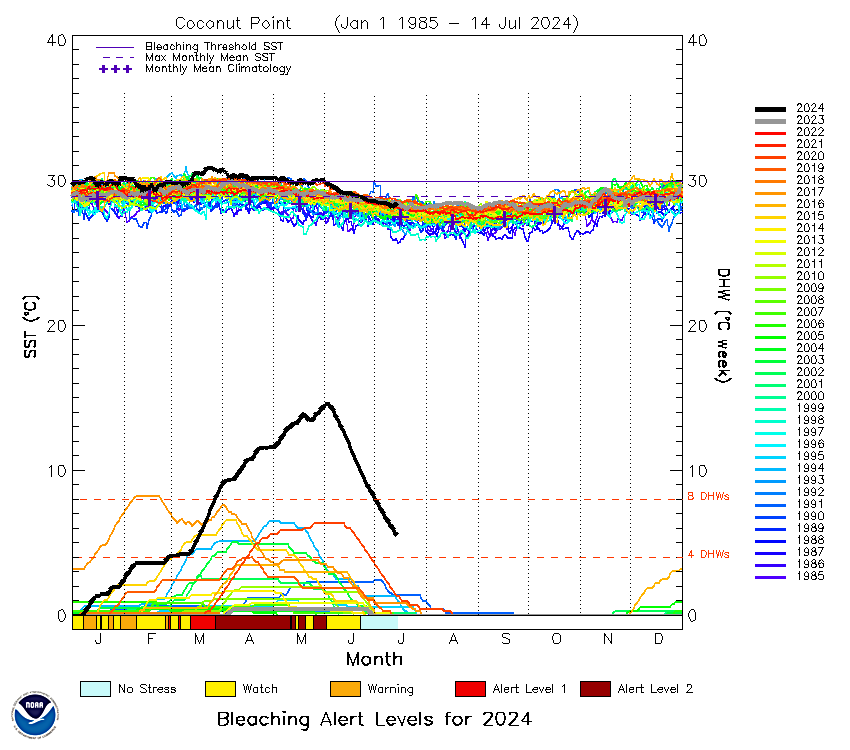
10. Coconut Point
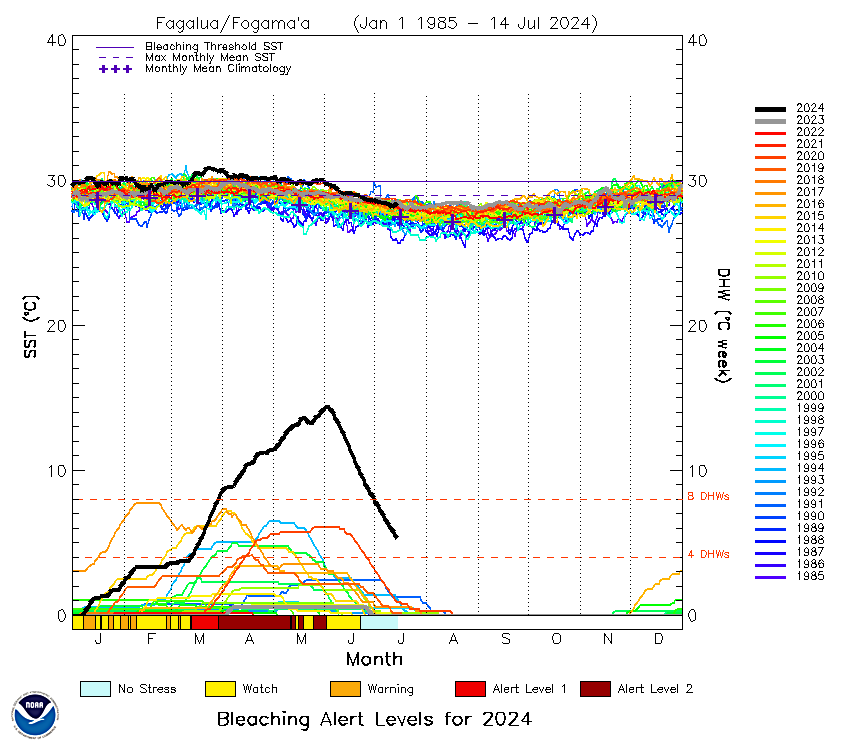
11. Fagalua/Fogama'a
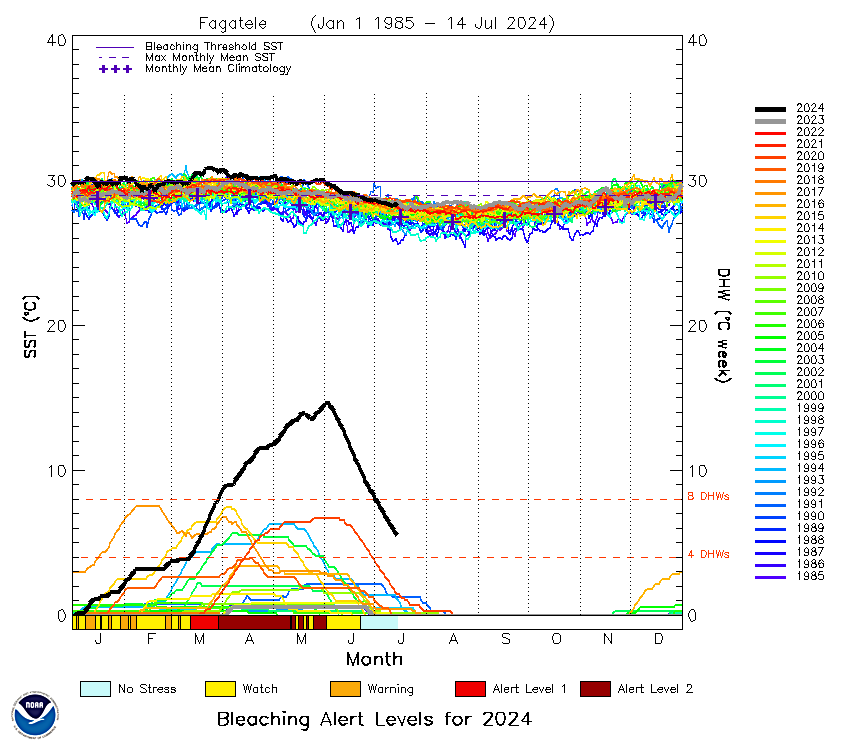
12. Fagatele
13. West Tutuila
Ofu & Olosega
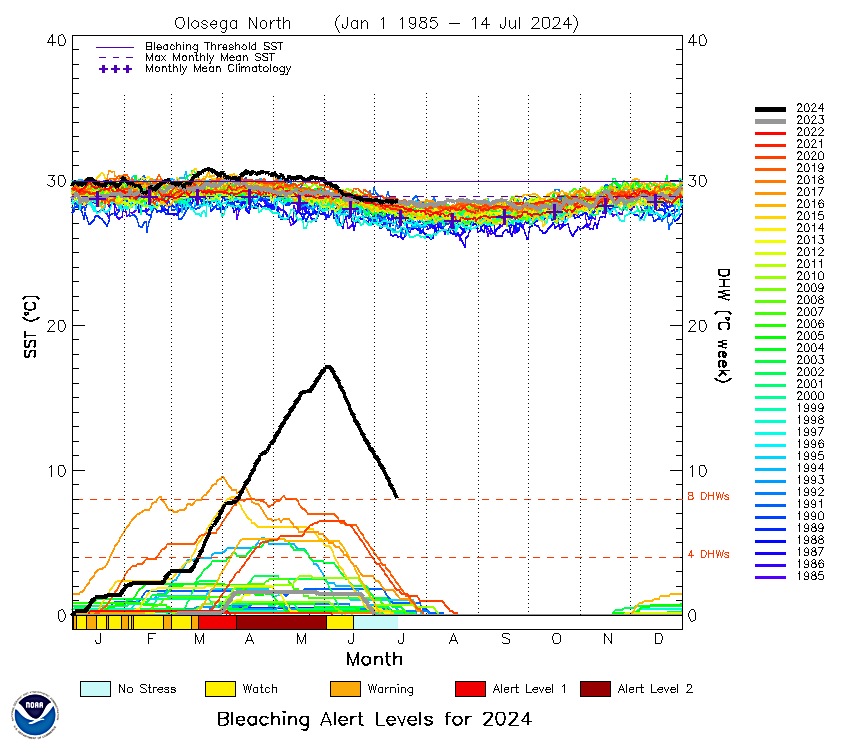
14. Olosega North
15. Olosega East
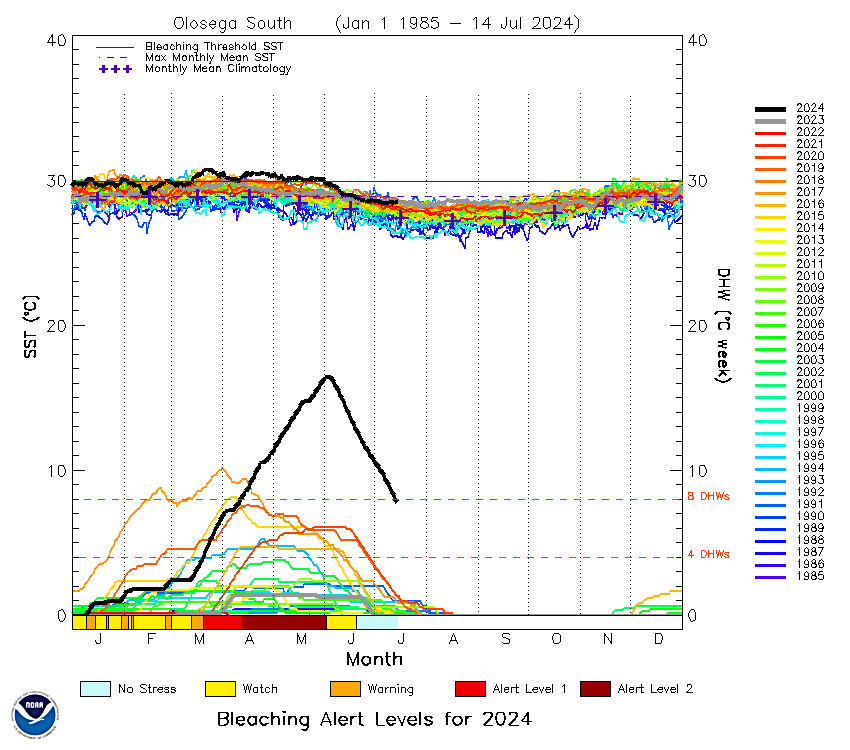
16. Olosega South
17. Ofu South
Ta'ū
18. Ta'ū North
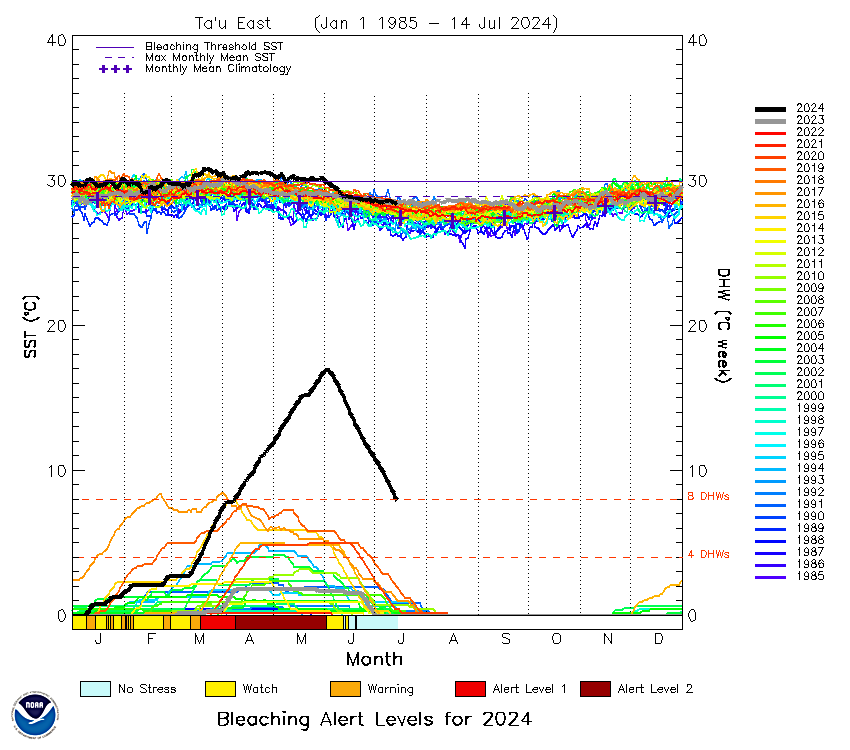
19. Ta'ū East
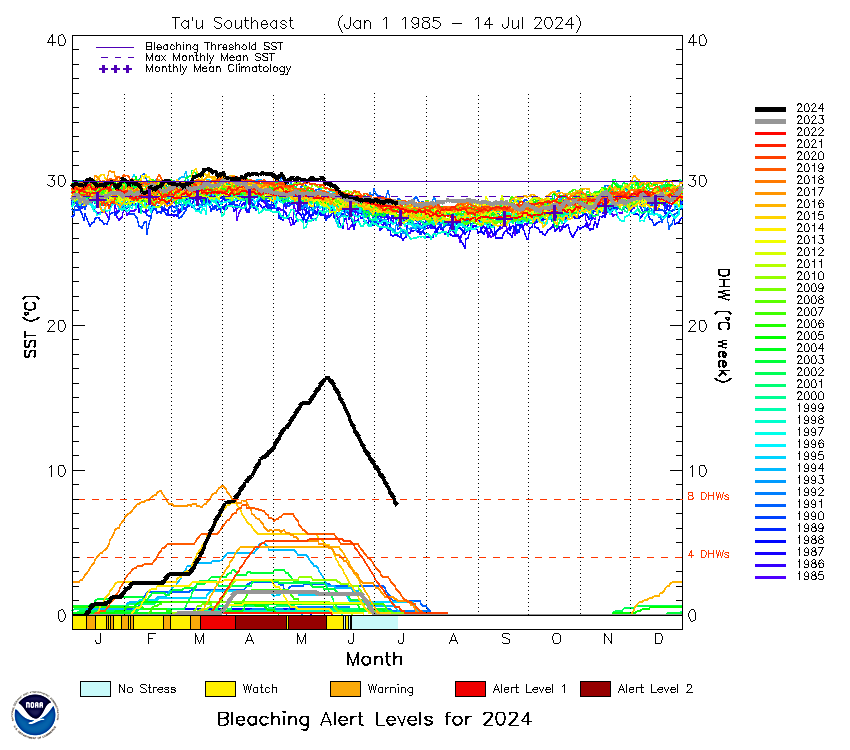
20. Ta'ū Southeast
21. Ta'ū South
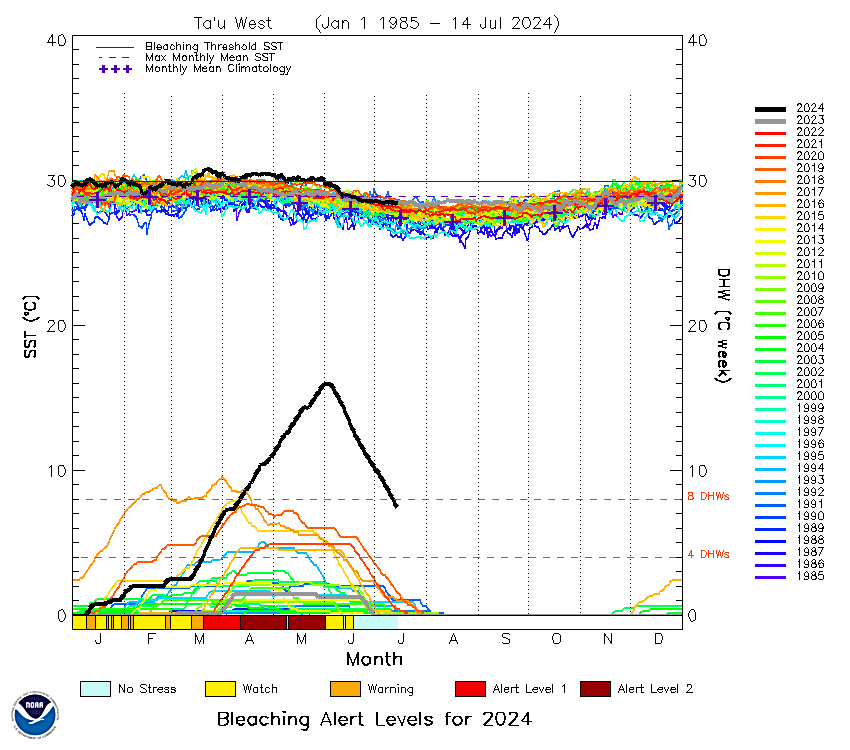
22. Ta'ū West
Swains Island
23. Swains North
24. Swains South
Rose Atoll
25. Rose Atoll West
26. Rose Atoll East
Samoan Islands 5 km Single-Pixel Virtual Stations
(experimental product for collaborators based on v3.1 global products)
(experimental product for collaborators based on v3.1 global products)
NOTE: Alerts displayed on individual Regional Virtual Station (RVS) and Single-Pixel Virtual Station pages still use the heritage bleaching alert level system (which extended to Bleaching Alert Level 2). We are currently updating these systems to reflect the modified bleaching alert levels (now extending to Bleaching Alert Level 5). Until this update is complete, when a Station displays Alert Level 2, we suggest that users consult the Time Series data file that is linked directly below or to the right of the two-year time-series graph. This data file displays the underlying Coral Bleaching HotSpot and Degree Heating Week (DHW) values, from which a user can determine, on any day, what the new, corresponding Bleaching Alert Level should be, if higher than Alert Level 2.
Click on a location on the map, the name of a site, or scroll down to see the time series for each location.


