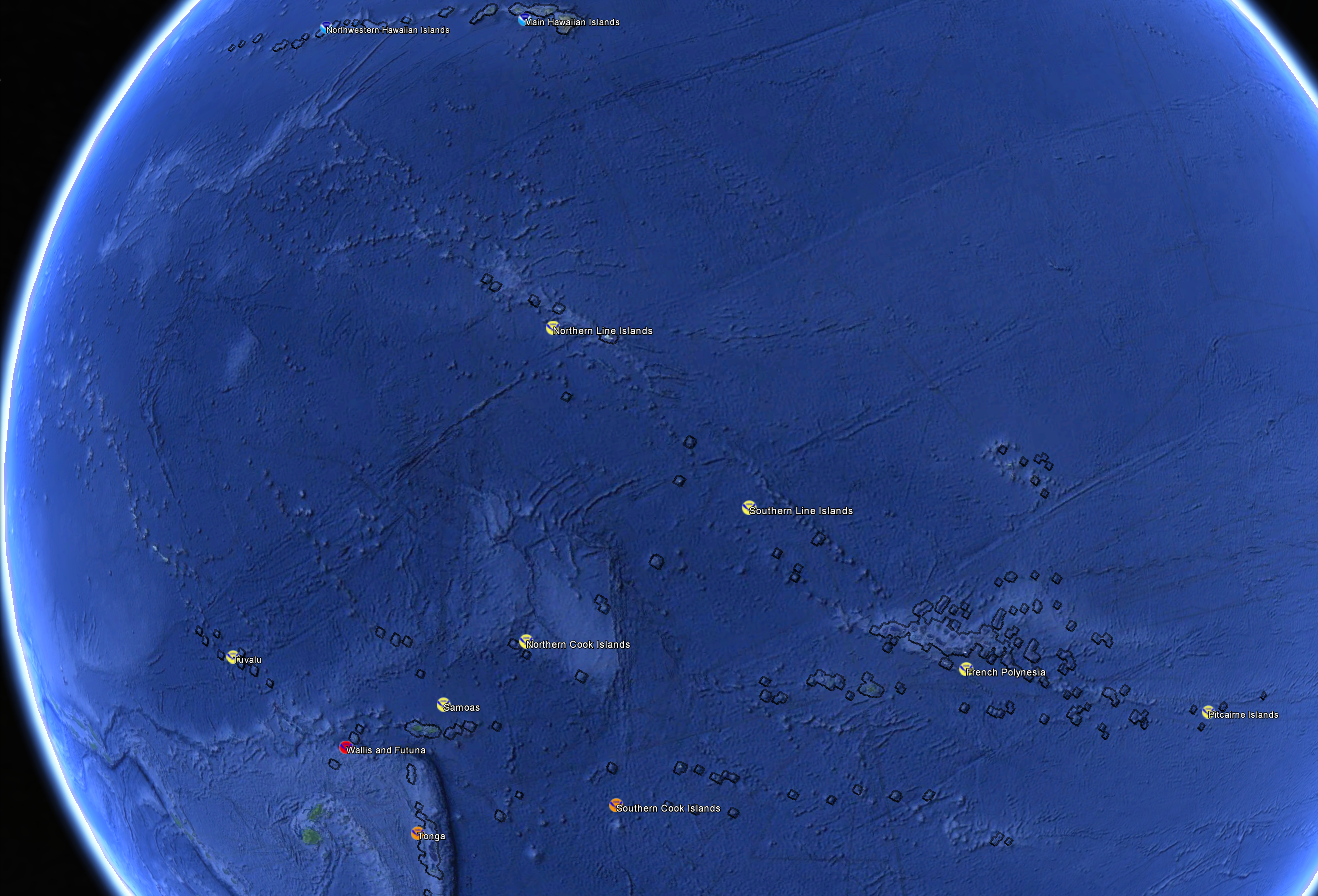
Polynesia 5 km Regional Virtual Station Time Series Graphs
(Version 3.1, released July 31, 2019, experimental product)
NOTE: Alerts displayed on individual Regional Virtual Station (RVS) and Single-Pixel Virtual Station pages still
use the heritage bleaching alert level system (which extended to Bleaching Alert Level 2). We are currently updating
these systems to reflect the
modified bleaching alert levels (now extending to Bleaching Alert Level 5). Until this update is complete, when
a Station displays Alert Level 2, we suggest that users consult the Time Series data file that is linked directly
below or to the right of the two-year time-series graph. This data file displays the underlying Coral Bleaching
HotSpot and Degree Heating Week (DHW) values, from which a user can determine, on any day, what the new,
corresponding Bleaching Alert Level should be, if higher than Alert Level 2.
This page hosts the regional time series graphs and data.Google Maps interface for the 5-km Virtual Stations system .
Select a 2-yr range:
2025-2026
2024-2025
2023-2024
2022-2023
2021-2022
2020-2021
2019-2020
2018-2019
2017-2018
2016-2017
2015-2016
2014-2015
2013-2014
2012-2013
2011-2012
2010-2011
2009-2010
2008-2009
2007-2008
2006-2007
2005-2006
2004-2005
2003-2004
2002-2003
2001-2002
2000-2001
1999-2000
1998-1999
1997-1998
1996-1997
1995-1996
1994-1995
1993-1994
1992-1993
1991-1992
1990-1991
1989-1990
1988-1989
1987-1988
1986-1987
1985-1986
(description)
Multi-year Graph
(description)
Time Series Data
(description)
Thermal Stress Gauge


