


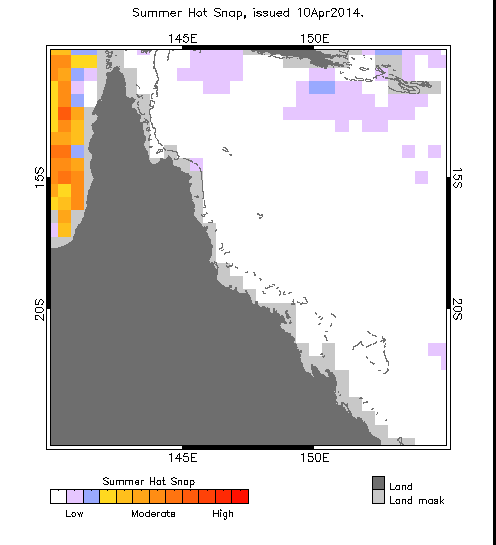
Great Barrier Reef, Australia
(Accumulating for November 2013 - April 2014)
 |
 |
 |
 |
 |
| Current |
2001/02 | 2002/03 | 2003/04 | 2004/05 | 2005/06 | 2006/07 | 2007/08 | 2008/09 | 2009/10 | 2010/11 | 2011/12 | 2012/13
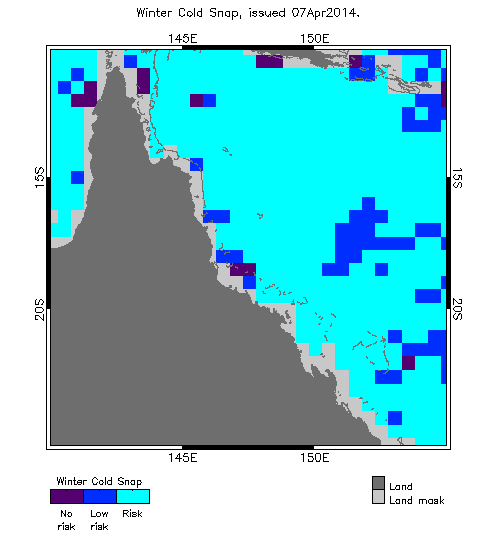
The CDW (Cold Degree Weeks) metric accumulates anomalously cold temperatures through time, as compared with the usual range of winter temperatures, providing an indication of unusually cold events. Such events (dark blue) reflect a reduction in pathogen loading during extreme cold periods.
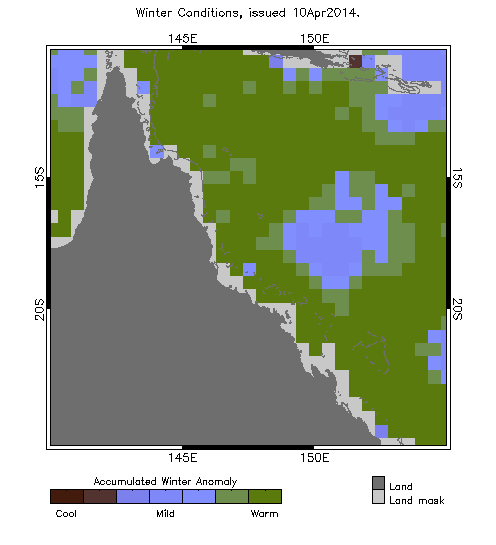
The WDW (Winter Degree Weeks) metric accumulates temperature anomalies during the cold season as compared with the average temperature observed in the three coldest months ("winter") at each location. It represents the variation of the current cold season from the average condition. Mild winters (blue) have been linked to subsequent outbreaks of White Syndrome disease; research has shown that such outbreaks do not occur following cool winters (brown) or warm winters (green), likely related to a reduction in disease pathogen abundance and an increase in host resistance, respectively.
The HDW (Hot Degree Weeks) metric accumulates anomalously hot temperatures through time, as compared with the usual range of summer temperatures, providing an indication of unusually hot events. This metric represents the level of hot stress that corals experience.
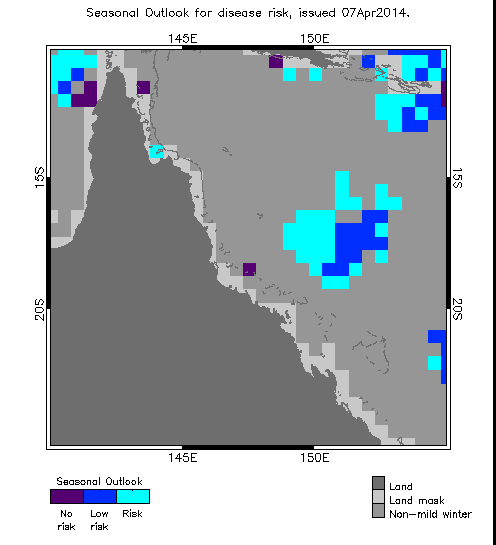
The Winter Pre-Conditioning is based only on the cold season metrics, and gives a measure of the pre-disposition to disease outbreak during the following warm season. Only locations that experienced mild winters (blue WDW) are considered to be at-risk, with the likelihood defined by the presence/absence of unusually cold events (CDW). The Pre-Conditioning value is issued at the end of the cold season, providing a 3-6 month forecast of the likelihood of disease outbreak.
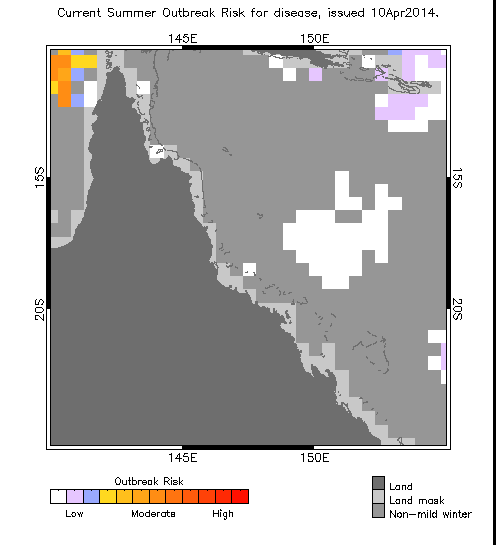
The Current Summer Outbreak Risk is assigned only for locations that experienced mild winters (blue WDW) and is defined by the level of hot stress (HDW) experienced during the subsequent warm period. Outbreak Risk in the yellow-to-red range has shown significant likelihood of disease for corals, increasing linearly with the color scale. The Outbreak Risk is updated in near real-time during the warm season.
Reference: Heron S.F., B.L. Willis, W.J. Skirving, C.M. Eakin, C.A. Page, I.R. Miller (2010). Summer Hot Snaps and Winter Conditions: Modelling White Syndrome Outbreaks on Great Barrier Reef Corals, PLoS One.
![]() The Disease Outbreak Risk product was developed by Coral Reef Watch in close
collaboration with James Cook University;
and with support from the Remote Sensing and Coral Disease Working Groups
of the Coral Reef Targeted Research (CRTR)
Program and the Australian Institute of
Marine Science.
The Disease Outbreak Risk product was developed by Coral Reef Watch in close
collaboration with James Cook University;
and with support from the Remote Sensing and Coral Disease Working Groups
of the Coral Reef Targeted Research (CRTR)
Program and the Australian Institute of
Marine Science.
CRW has collaborated in a parallel research effort into links between temperature and coral disease based on the ReefTemp product. Predictions of coral disease outbreak using ReefTemp are modeled for the tropical regions of Australia.

