


As of this initial writing (May 7, 2014), with the 2015 El Niño continuing to develop and intensify in the Northern Hemisphere, the following is a brief overview of the pattern and timing of heat stress that resulted in widespread, severe coral bleaching in many parts of the world, during 1997-1999. Past reports have estimated that over 15% of the world's coral reefs were effectively lost during 1997-1999 (Wilkinson 2000). At that time, NOAA Coral Reef Watch observed widespread, prolonged high temperatures that caused coral bleaching. This was associated with what has been argued to be the largest El Niño on record (1997-1998), followed immediately by a strong La Niña (1998-1999). In general, many areas that are untouched by warming during an El Niño are influenced by warming during a La Niña (see Eakin et al. 2009).
| ||
The following discussion uses the NOAA Coral Reef Watch SST Anomaly and Bleaching Alert Area products to illustrate the events. The Bleaching Alert Area shows patterns of areas with accumulated thermal stress sufficient to cause coral bleaching. The patterns are a bit different, and more coral-focused, than those visible in the SST Anomaly data. More on these products can be found at: https://coralreefwatch.noaa.gov/satellite/index.php.
1997:
The classical El Niño warming pattern formed by May 1997, with initiation of SST warming from the central tropical Pacific eastward to the South American coastline. Prolonged thermal stress with the potential to cause bleaching was seen along the equator, from Howland and Baker Islands east to the Galapagos and the Ecuadorian coastline, during the remainder of 1997. During this time, warming also proceeded northward along the South American coast to Panama. Additionally, warming was seen reaching northeast to Mexico, and some warming was seen along the Central American Coastline. Limited warming was seen in the Caribbean.
| ||

| ||
1998:
By early 1998, the classic El Niño pattern was fully developed, with broader areas of high temperature in the eastern Tropical Pacific and extending up the Central American coast past Costa Rica, including all of the eastern Tropical Pacific islands; high temperatures in these regions began to dissipate in June. Bleaching levels of warming were seen along the Great Barrier Reef in February-March. Warming also began in the eastern to central Indian Ocean south of the equator, spreading to the eastern Indian Ocean by March, and dissipating after May.
| ||
| ||
| ||
In May and June, bleaching levels of warming were also seen across the Indian Ocean north of the equator and into Southeast Asia.

| ||

| ||
| ||
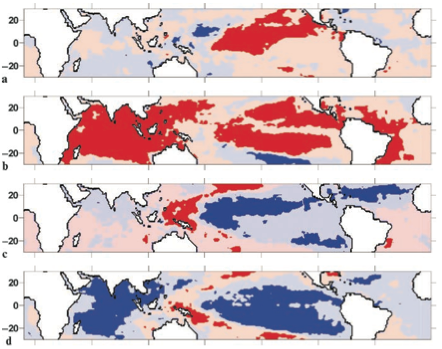 |
Bleaching warming in the Western Atlantic/Gulf of America/Caribbean is most commonly seen in the year after the onset of an El Niño (see figure on left from Eakin et al. 2009).
The bleaching warming started to develop in July 1998 and peaked in the Gulf of America in August and in the Caribbean Sea in October.
| ||
| ||
| ||
| ||
1999:
By 1999, the worst of the thermal stress was over, from a coral bleaching perspective, but only after major losses of coral reefs worldwide in 1998. Some warming was seen along the Great Barrier Reef in early 1999 but was much weaker than the prior year. Conditions were rather quiescent until August, when warming of the western North Pacific led to low bleaching levels of thermal stress that reached down to the Mariana Islands. Warming was again seen in the Caribbean in August-September 1999 but to a lesser extent than in 1998.
References
Wilkinson CR (2000) Status of Coral Reefs of the World: 2000. Global Coral Reef Monitoring Network and Australian Institute of Marine Science, Townsville, Australia 363pp.
Disclaimer
The content posted on this web page solely represents the opinions of the authors and does not constitute a statement of policy, decision, or position on behalf of NOAA or the US Government.
The appearance of external links on this World Wide Web site does not constitute endorsement by the Department of Commerce/National Oceanic and Atmospheric Administration of external Web sites or the information, products or services contained therein. For other than authorized activities, the Department of Commerce/NOAA does not exercise any editorial control over the information you may find at these locations. These links are provided consistent with the stated purpose of this Department of Commerce/NOAA Web site.

